0546
The impact of CSF pulsation on reconstructed brain conductivity1Philips Research Europe, Hamburg, Germany, 2Hokkaido University Hospital, Sapporo, Japan
Synopsis
It has recently been shown that the WHO grade of a glioma is correlated with its electric conductivity, which can be determined via post-processing the acquired MR transceive phase. However, the transceive phase and thus the derived conductivity might be corrupted by motion induced phase, particularly from cardiac pulsation transferred to the cerebrospinal fluid (CSF). In this study, the impact of CSF pulsation on the reconstructed conductivity was investigated by synchronizing the transceive phase acquisition to the cardiac cycle. It turned out that the pulsation significantly affects reconstructed conductivity of the CSF, but not of gray and white matter.
Purpose
It has recently been shown that the WHO grade of a glioma is correlated with its electric conductivity, and that this conductivity can be determined via post-processing the MR transceive phase acquired with a steady-state free-precession sequence [1]. However, this transceive phase and the subsequently derived conductivity might be corrupted by motion induced phase, particularly from cardiac pulsation transferred to the Cerebro-Spinal Fluid (CSF). In this study, the impact of CSF pulsation on the reconstructed conductivity was investigated by synchronizing the transceive phase acquisition to the cardiac cycle.Methods
A balanced Turbo-Field Echo (bTFE) sequence was applied on a commercial 3T scanner (Achieva TX, Philips Healthcare, Best, The Netherlands) using a 32-channel RF head coil with the following parameters: TR/TE = 3.2/1.6 ms, flip angle = 25°, voxel size = 1x1x1 mm³, echo train length = 110, total scan time ~ 4-5 minutes depending on the pulse rate of the volunteer. For cardiac triggering, a Peripheral Pulse Unit (PPU) was applied via a finger clip. The sequence was repeated using six different trigger delays Td: the minimally and maximally possible Td according to the individual pulse rate as well as three equally distributed Td between minimum and maximum Td. As a sixth Td, it has been tested to determine the point in time with minimal CSF flow using a phase contrast (PC) MRI sequence (TR/TE = 21/7.8, flip angle = 10°, voxel size = 1.0x1.4x10 mm³, VENC = 5 cm /s). Eleven healthy volunteers with informed consent and local ethical approval were investigated (mean age = 39±10 years, 6 male, 5 female).
Conductivity reconstruction has been performed as described in [1], i.e., after applying the numerical Laplacian to get a "raw" conductivity, a bilateral median filter has been applied for denoising. Tissue boundaries for this median filter has been extracted from the magnitude image of the measured bTFE sequence.
Results
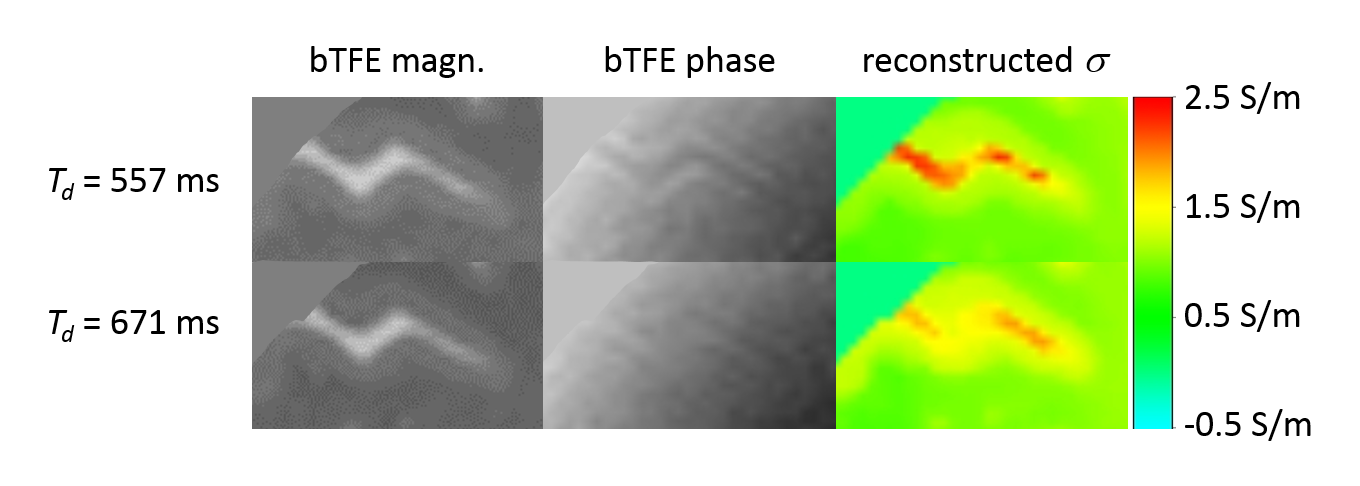
Figure 1 shows a zoomed cerebral sulcus, filled with CSF, for two different Td. A clear impact of Td on the phase in the CSF is visible, resulting in an altered conductivity of the CSF, in contrast to the unaltered phase and conductivity around the sulcus.
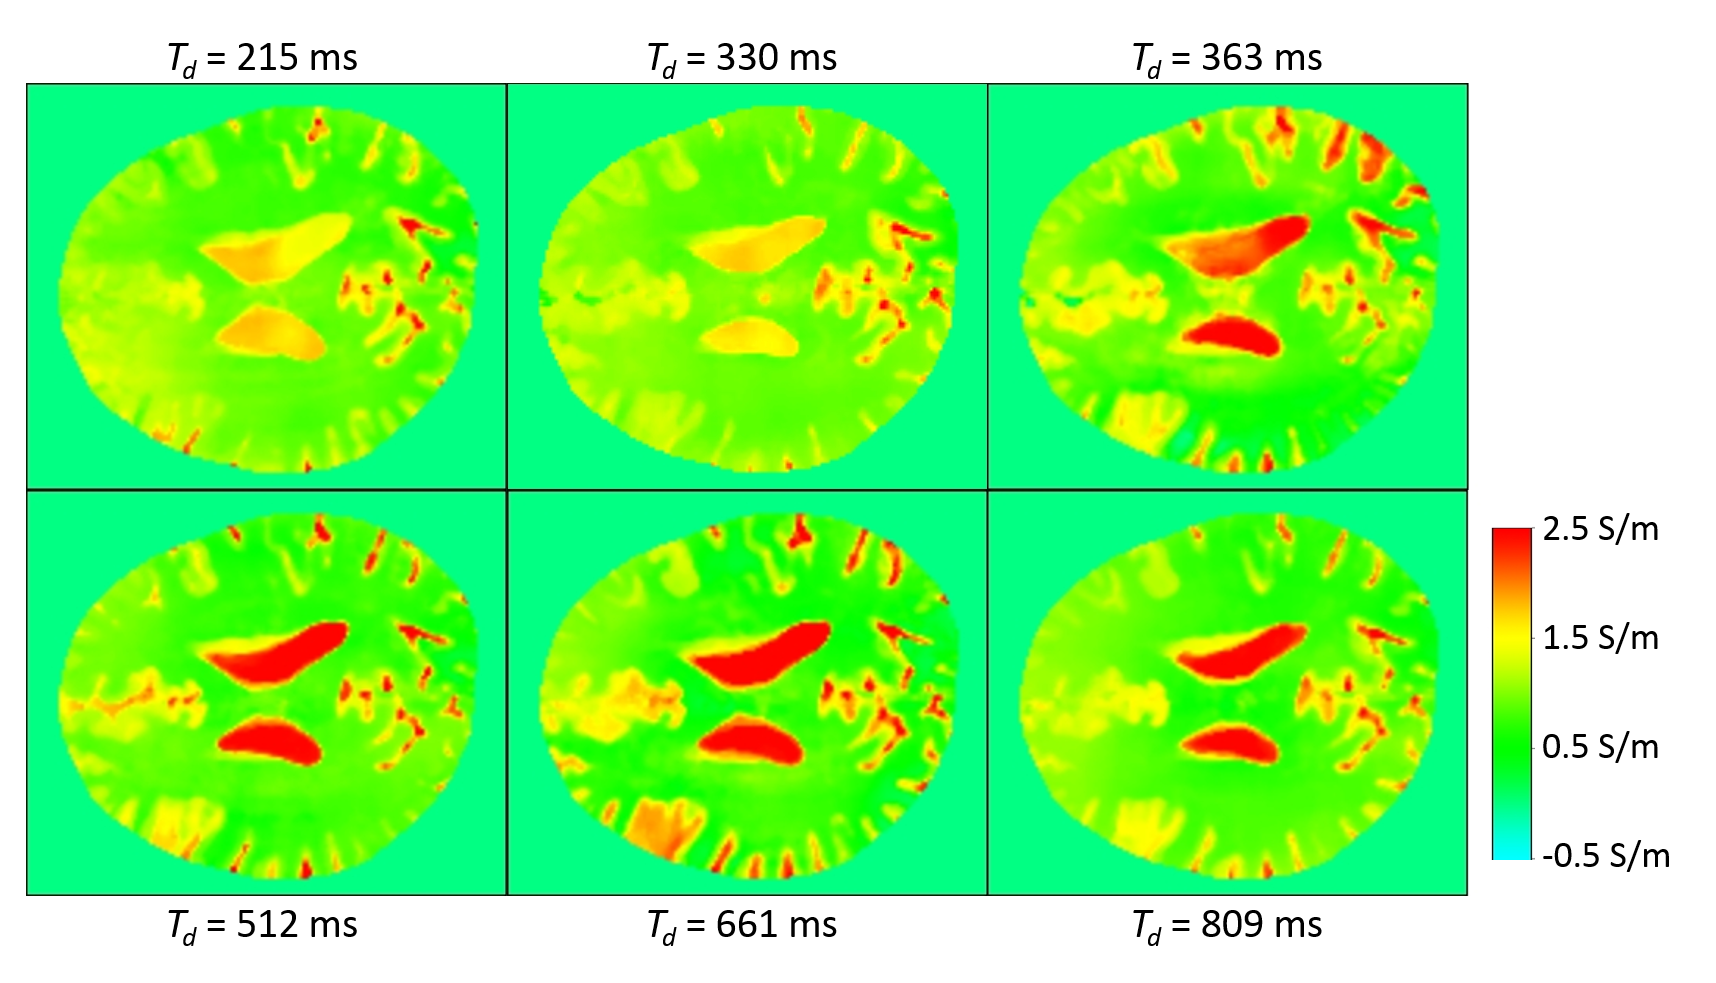
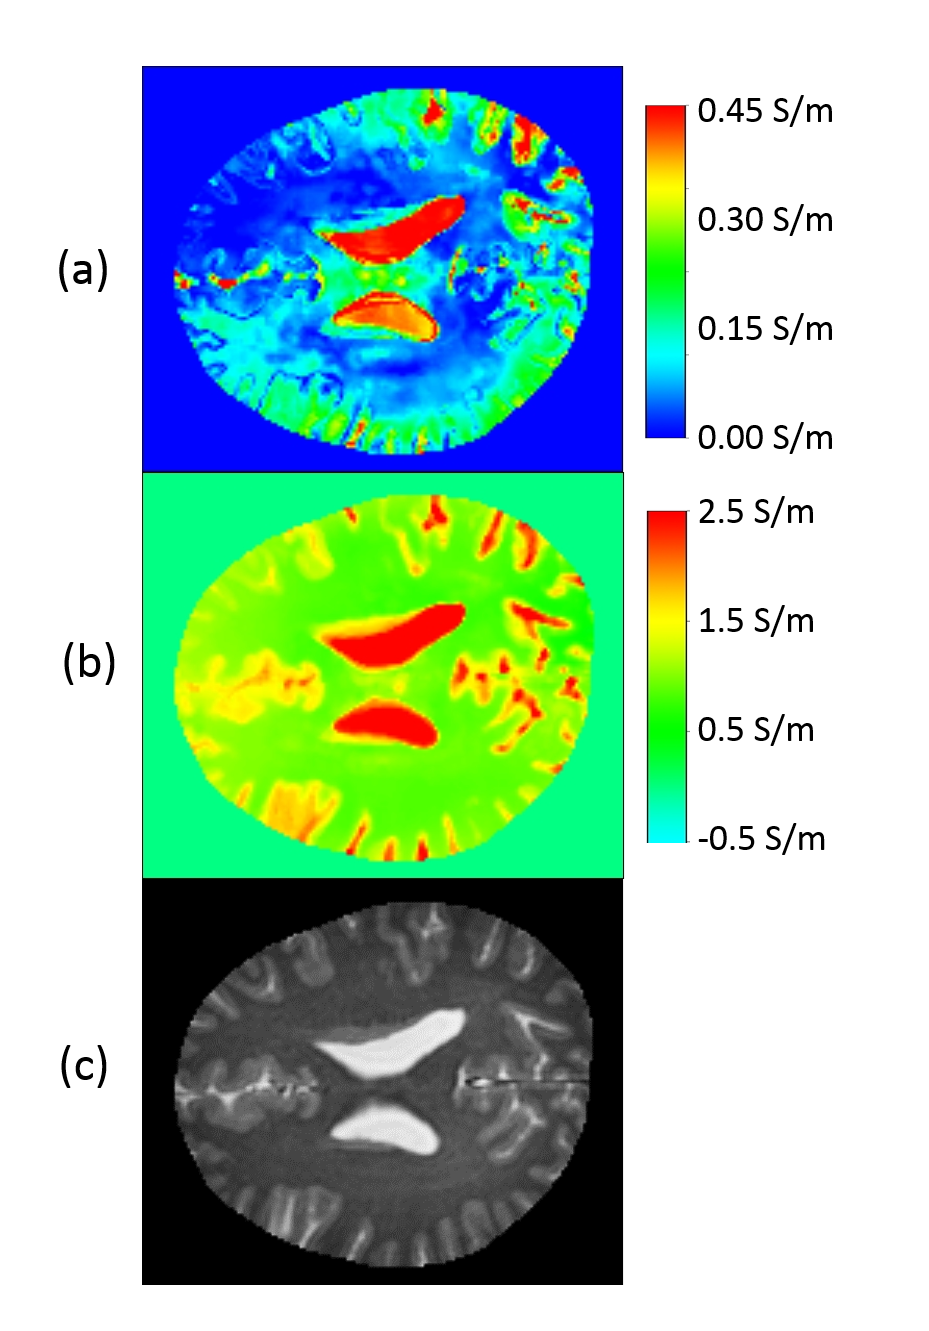
Figure 2 shows the conductivity of the six different values of Td as described above for one of the volunteers. The optimal Td as derived from the PC-MRI does not lead to an optimally reconstructed CSF conductivity. The standard deviation of the reconstructed conductivity over the different Td show a clear maximum inside the CSF and is much smaller in gray and white matter (Fig. 3a). Optimal (i.e., most homogeneous) CSF conductivity across the brain is observed by calculating the upper quartile of the conductivity over the different Td (Fig. 3b). This holds for the CSF in the sulci as well as for the CSF in the ventricles.
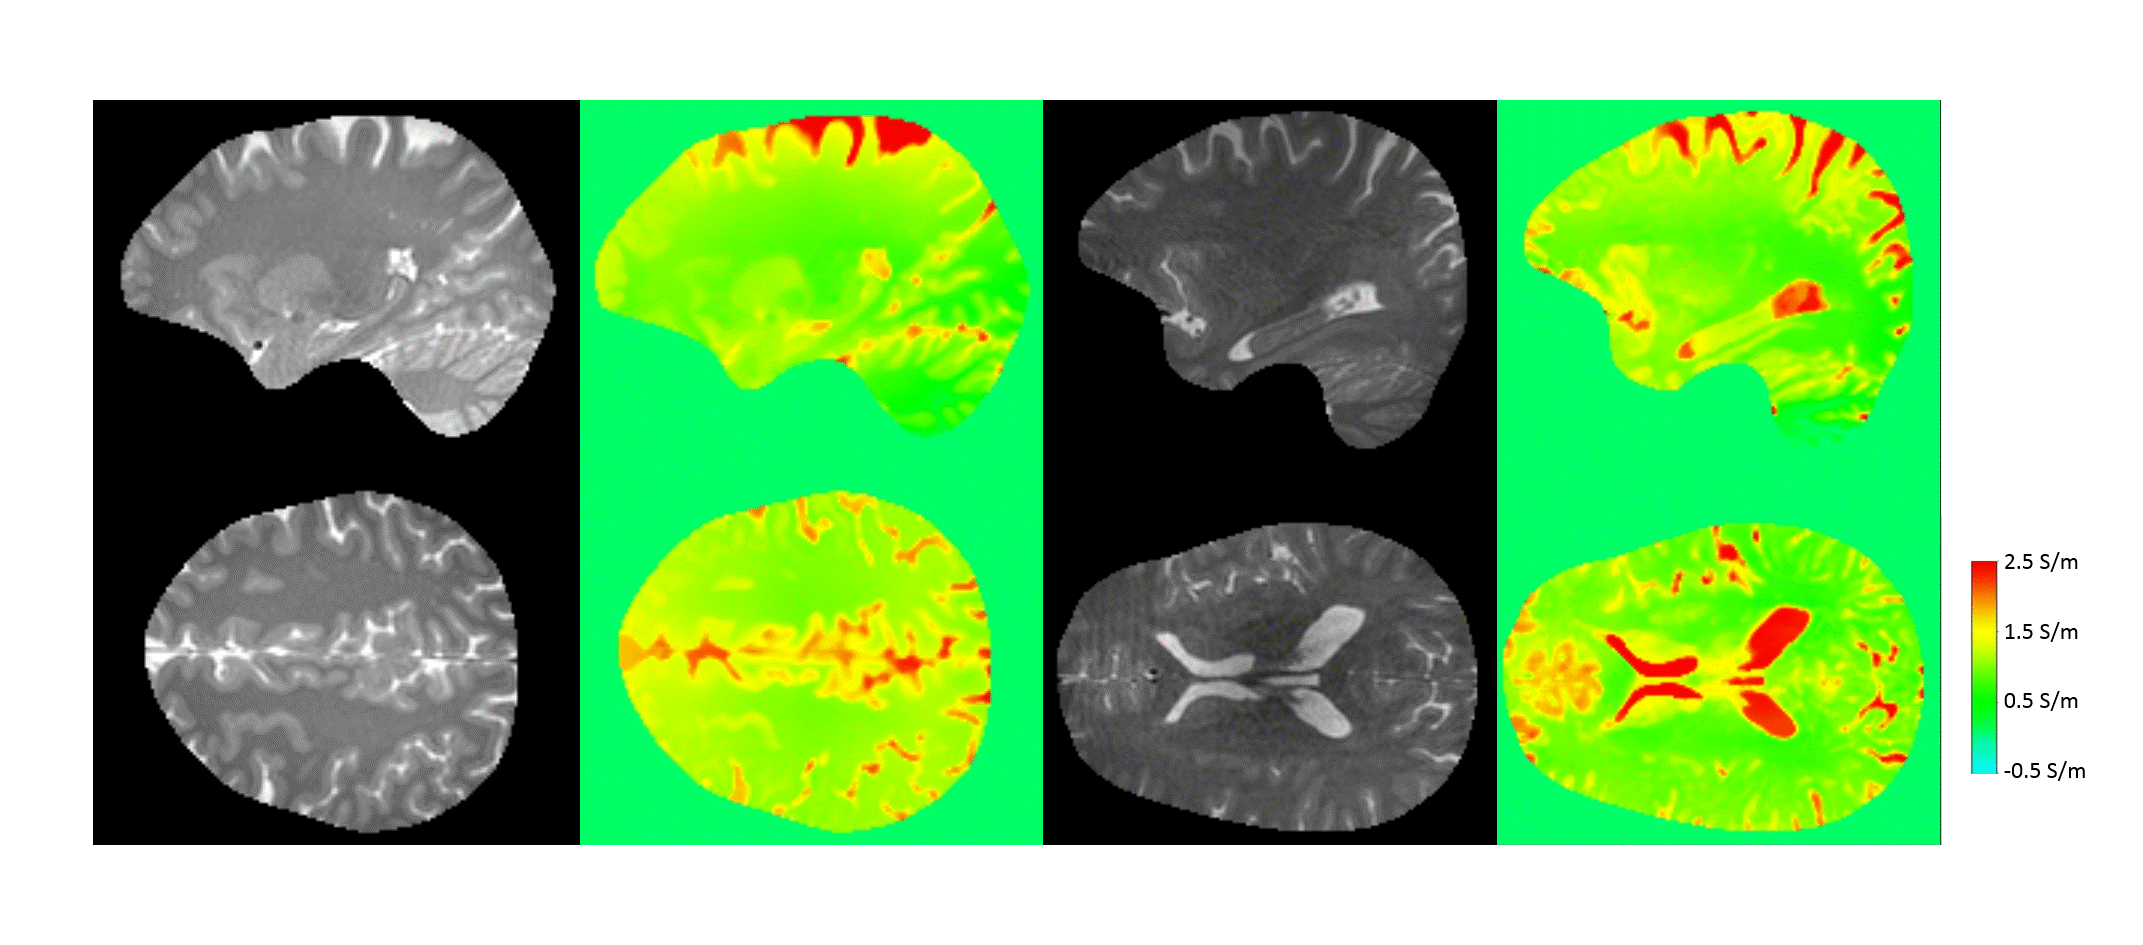
Figure 4 shows results of more volunteers, comparing the magnitude of bTFE with the upper quartile of conductivity over Td as in Fig. 3b. A high consistency of the reconstructed CSF conductivity over the volunteers is observed.
Discussion
The study shows a clear impact of the trigger delay on the reconstructed conductivity of the CSF, obviously caused by the motion-induced phase from cardiac pulsation transferred to CSF. The finding that the upper conductivity quartile over the different trigger delays yields the most homogeneous CSF suggests that pulsation tends to lower the reconstructed conductivity. Since this effect is predominantly bound to CSF voxels, related artefacts seem to play a negligible role for the conductivity determination of gray and white matter as well as presumably of brain tumors. A similar effect is expected for conductivity determination of pulsating blood inside large vessels, which shall be investigated in a separate study.Acknowledgements
The authors wish to thank the Japan Society for the Promotion of Science (JSPS) for funding and Thomas Stehle for kind contribution of brain segmentation algorithm.
References
[1] Tha KK et al., Noninvasive electrical conductivity measurement by MRI: a test of its validity and the electrical conductivity characteristics of glioma, Eur Radiol 2017, doi: 10.1007/s00330-017-4942-5Figures