0545
Multi-frequency MREIT Demonstrated using Semipermeable Membrane Models1SBHSE, Arizona State University, Tempe, AZ, United States, 2ECEE, Arizona State University, Tempe, AZ, United States
Synopsis
Magnetic Resonance Electrical Impedance Tomography (MREIT) has been used to measure low frequency (ca. 10 Hz) electrical conductivity properties. Here, finite element simulations are used to show that it should be possible to measure electrical properties at frequencies in the range 10- ~5000 Hz using current waveform modulation. We also show imaging results that demonstrate differential signals can be measured in phantoms containing dialysis membranes with different thicknesses and permittivity characteristics.
Introduction
Magnetic Resonance Electrical Impedance Tomography (MREIT) has typically been used to image low-frequency electrical properties of tissue. This is useful in applications involving conduction of endogenous electromagnetic fields (EEG source analysis) and in analyzing paths taken by the transcranially applied electric currents used in neuromodulation techniques such as transcranial DC stimulation (tDCS). Electrical properties of biological tissue are complex and frequency dependent, and show large variation in the range between 10 Hz and 1000s of Hz. Therefore, it is of interest to determine if MREIT can image frequency dependence separate from other stray conductive or scanner dependent effects. In this study, we performed simulations to determine the spectra of modulated MREIT waveforms and determined critical frequencies of a semipermeable membrane in a simulated phantom. Finally, we imaged several semipermeable membranes using spin-echo MREIT techniques and modulated MREIT waveforms.
Methods
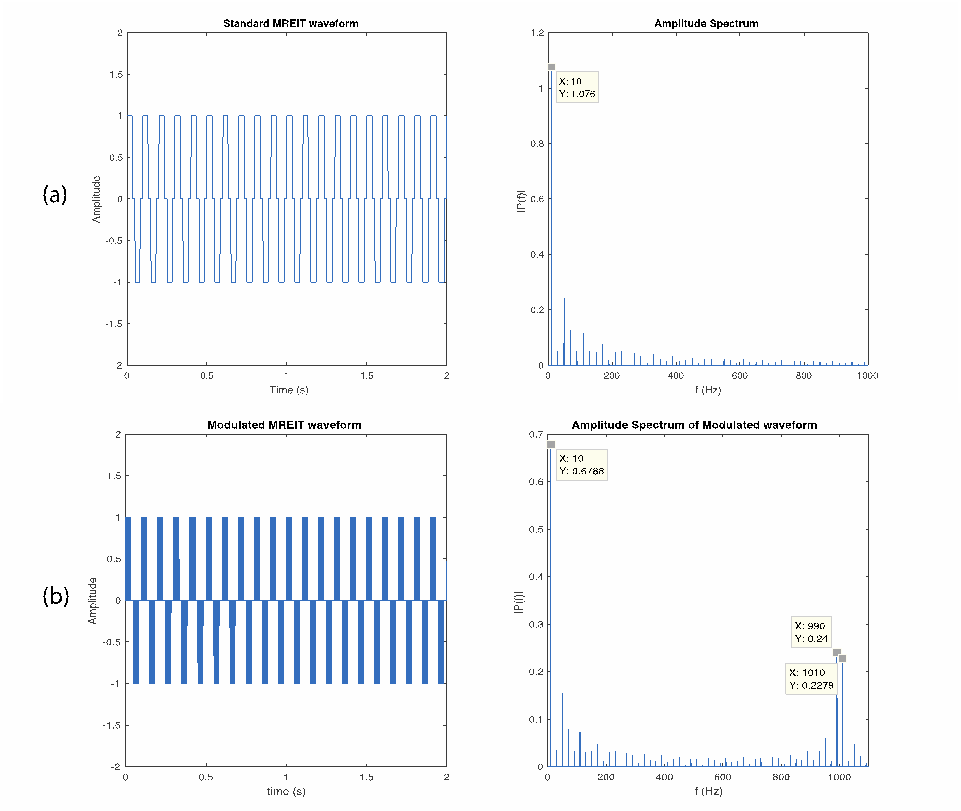
Waveform Analysis: A standard MREIT current waveform (based on earlier studies1,2) was constructed using MATLAB, using a 10 kHz sample rate. The standard waveform had a cycle length of 100 ms, and a duty cycle of 64%. The modulated waveform was created by multiplying a rectified 500 Hz sine wave, sampled at the same 10 kHz rate, with the standard waveform. Figure 1 shows the original and modulated waveforms and their corresponding spectra.
As expected, the spectrum of the standard waveform was principally at 10 Hz, and rectification of the modulating function resulted in its spectrum having peaks at both 10 Hz around 1000 Hz, since rectification of the sine wave should have doubled its characteristic frequency. Approximately half the power in the modulated waveform was at around 10 Hz, and half around 1000 Hz.
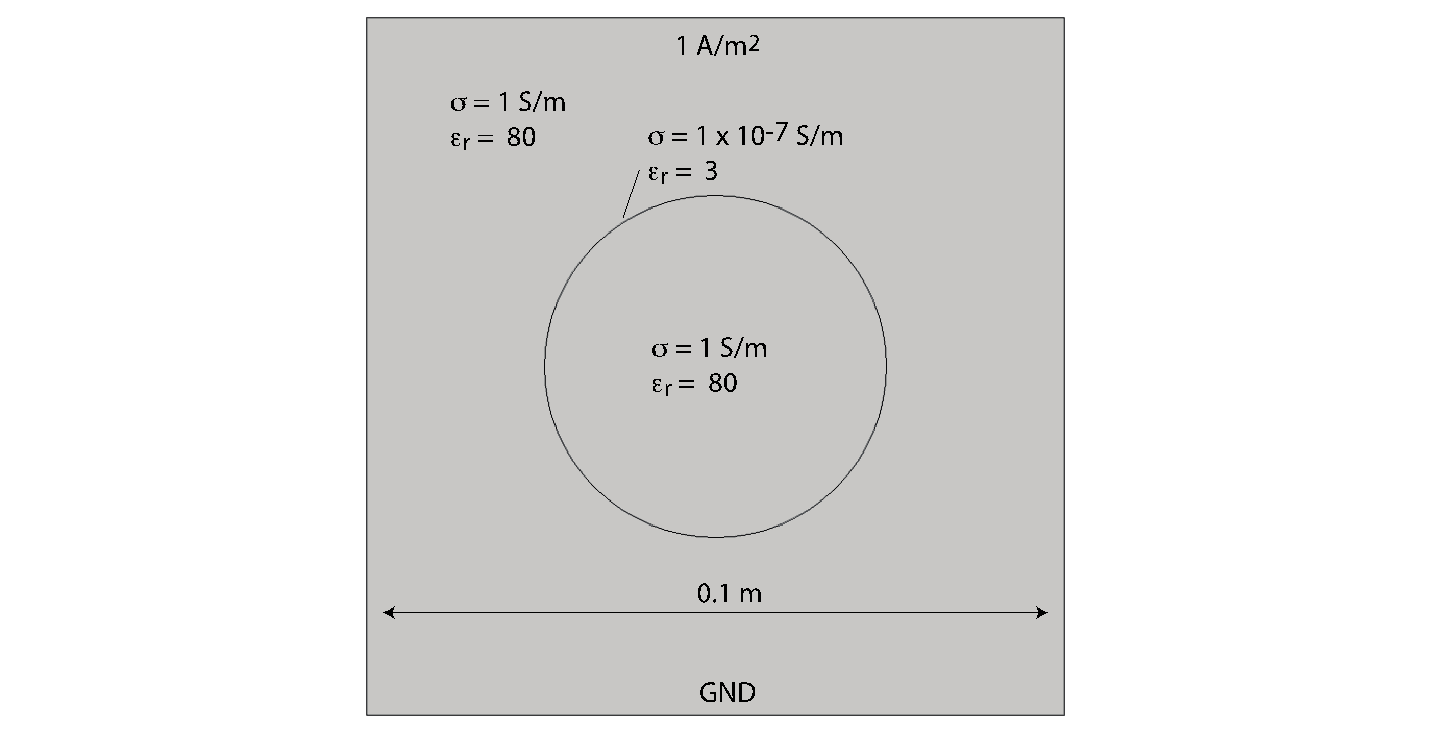
COMSOL Models: A two-dimensional COMSOL (Burlington, MA) model of a conducting square (10 cm) was constructed (Fig. 2). A cellulose membrane-like inclusion was modeled using the COMSOL AC/DC Module contact impedance boundary condition. The thickness of the cellulose membrane was specified as 72 nm.The conductivity and relative permittivity of the membrane were set to be 10-7 S/m, and 3 respectively3. The conductivity of the medium surrounding and within the membrane was 1 S/m, and its relative permittivity was 80. A normal current density of 1 A/m2 was applied at the upper edge, and the lower edge was grounded.
Frequency Dependent Simulations: A frequency dependent simulation was performed to characterize the response of the model to applied current waveforms of discrete frequencies from 0 to 10 kHz, in steps of 1000 Hz. Real current density magnitudes and corresponding magnetic flux densities were plotted as a function of frequency.
Experimental Measurements: Dialysis membrane tubing was purchased from Spectrum Laboratories. One, thicker, membrane had a 500 Da molecular weight cut off (MWCO) and the other was thin and had a 3500 Da MWCO. Membrane tubes were fixed to the end faces of a cylindrical phantom and saline solution with an approximate conductivity of 1 S/m was used to fill the membrane interior and container. MR Imaging was performed using a 7T Bruker Biospin MRI (Billerica, MA) with bore diameter 20cm, located at the BNI, AZ, USA. Imaging parameters were: Field of view = 80x80 mm2, matrix size = 100×100, TR/TE = 1000/40 ms, slice thickness = 5 mm, averages = 4, injected current amplitude (I)= 2.5mA, Tc= 36ms, and total scan time = 400s. MR phase measured during separate positive and negative current injection (I±) were combined to compute the z-component of the magnetic flux density (Bz) and cancel the effect of systematic phase artifact. Since any reactive membrane properties should appear in magnitude images, we examined changes in differences of magnitude image cross sections.
Results
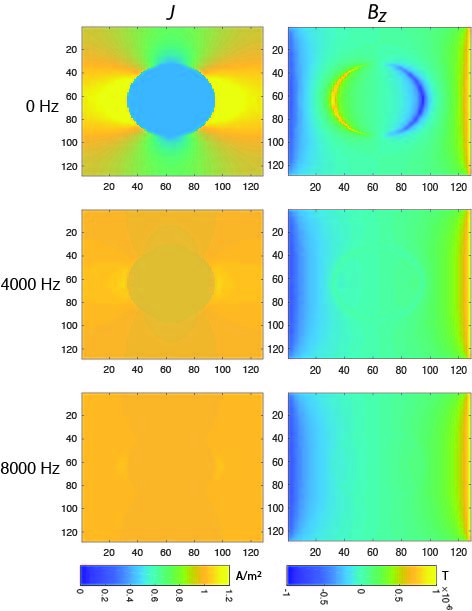
Frequency Dependent Simulations Figure 3 shows the magnitude of the complex current density in the model as a function of frequency. Since the membrane did not conduct at low frequencies the current density within the membrane was low below around 100 Hz, but as frequency increased the current distribution became more uniform. Similarly, Bz distributions were only affected by membrane properties at low frequencies.
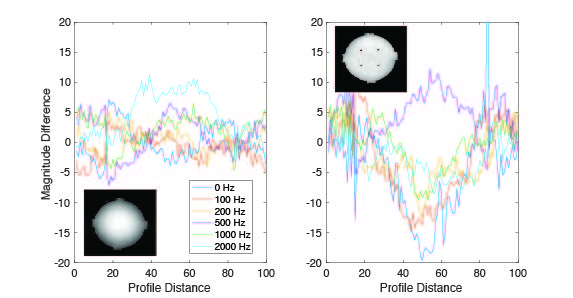
Experimental Results: Magnitude difference images of the very low conductivity membrane (Fig. 4 (left)) were very similar (differences < 5) at all frequencies, suggesting no current leaked through this membrane. However, magnitude difference images in the thin 3500 MWCO membrane depended strongly on frequency.
Conclusion
We believe these results indicate that MREIT may be used to image frequency dependent properties of biological tissues.
Acknowledgements
Research reported in this publication was supported by the NIH-NINDS under Award Number R01NS077004.
References
[1]. Kasinadhuni AK, Indahlastari A, Chauhan M, Schär M, Mareci TH, Sadleir RJ. Imaging of Current Flow in the Human Head During Transcranial Electrical therapy. Brain Stimulation 2017;10:764-772. 2.
[2]. Kasinadhuni AK, Chauhan M, Indahlastari A, Anderson C, Carney P, Mareci TH, Sadleir RJ. Mapping magnetic fields due to electrical stimulation in the human brain: First Measurements. 2016 7-13 May, 2016; Singapore. International Society for Magnetic Resonance in Medicine. p 1-4. 3.
[3]. Asaka K. Dielectric properties of cellulose acetate reverse osmosis membranes in aqueous salt solutions. Journal of Membrane Science 1990;50:71-84.
Figures