0540
Fat Quantification Using A High-Resolution Bipolar Gradient Water-Fat SequenceAlireza Akbari1,2, Lanette J Friesen-Waldner1, Timothy RH Regnault3,4, and Charles A McKenzie1,2
1Medical Biophysics, Western University, London, ON, Canada, 2Robarts Research Institute, Western University, London, ON, Canada, 3Obstetrics and Gynaecology, Western University, London, ON, Canada, 4Physiology and Pharmacology, Western University, London, ON, Canada
Synopsis
In this work we demonstrate high-resolution bipolar water-fat imaging sequence produces same fat quantification as compared to conventional unipolar water-fat imaging sequence under the same scan time. Images of resolved boundaries in bipolar Proton Density Fat Fraction (PDFF) maps are presented. Fat quantifications of the same regions of interest drawn on bipolar and unipolar PDFF were compared and statistical analysis was performed to evaluate the similarity of the two methods.
INTRODUCTON
Guinea pigs are suitable animal model for studying obesity as they accumulate adipose deposits in a similar manner as humans.1 However, quantifying adipose tissue in guinea pigs is challenging, as the fat tissue volume is much smaller than humans due to their small body size. Hence, to quantify fat tissue, high-resolution images are required to reduce partial volume effects and minimize segmentation errors.2 Conventional water-fat imaging based on quantitative IDEAL3 uses several unipolar gradient echoes that are acquired over multiple repetition times (TRs) to achieve optimal echo-spacing. However, a bipolar water-fat imaging sequence would require fewer numbers of TRs to acquire the requisite gradient echoes with optimal echo-spacing, leading to a more time-efficient sequence.4 In this work, we investigate how a high-resolution bipolar sequence would perform in quantifying fat in vivo compared to a conventional unipolar sequence with the same scan time.METHODS
Four guinea pigs were scanned using a 3T MR scanner (Discovery MR 750, GE Healthcare, Waukesha, WI) and 32-channel cardiac coil. The unipolar imaging parameters were as follows: echo train length (ETL)=3, TR/TE1/ΔTE = ~11.0/1.6/1.3 ms, slice thickness=0.9 mm and acquisition matrix = 276 x 182 x 88 corresponding to voxel dimensions = 0.94 x 0.86 x 0.9 mm3(= 0.728 mm3). The bipolar imaging parameters were set to: ETL=6, TR/TE1/ΔTE = ~12.2/1.8/1.6 ms, slice thickness=0.7 and acquisition matrix = 276 x 278 x 112 resulting in voxel dimensions = 0.94 x 0.56 x 0.7 mm3(= 0.368 mm3). The rest of the imaging parameters: FOV=26 cm x 15.6 cm, flip angle=3 °, BW=142.86 KHz, NEX=3 were kept the same for both sequences. The scan time for unipolar and bipolar sequences were kept as close to identical as possible (10:57 and 11:18, respectively) to facilitate comparison. Conjugate-gradient SENSE5 and Max-IDEAL6 were used in the water-fat image reconstruction. The reconstructed matrix size for unipolar and bipolar images were 512x512x88 and 512x512x112, respectively. Proton Density Fat Fraction (PDFF) maps were calculated for both the unipolar- and bipolar-acquired images and were used for all the image analyses as they provide a quantitative measurement of fat. To assess the partial volume improvement in bipolar PDFF maps a region of interest (ROI) was drawn on the boundary between visceral and subcutaneous fat where the boundary was clearly identifiable on the bipolar PDFF images. The ROI was subsequently applied to the same volume on the unipolar PDFF maps. The mean PDFF were computed and an unpaired two-tailed t-test was performed to determine whether the bipolar sequence would perform differently in resolving the boundaries as compared to unipolar sequence. Fat quantification was performed by drawing ROIs on sections of visceral (either thoracic or abdominal) fat in the unipolar PDFF maps and their corresponding volumes on bipolar PDFF maps. All ROI analyses were performed using 3D-Slicer (www.slicer.org). To assess the level of agreement (i.e., identical fat quantification results) between unipolar and bipolar measurements of PDFF, a one-sample t-test was performed on the PDFF measurements difference values. These difference scores were tested against a value of 0, which would indicate that the measurements were identical.RESULTS
Figure 1 shows that the bipolar sequence achieved higher resolution compared to unipolar in approximately the same scan time. Figure 2 reports higher fat fraction measured in the boundary between visceral and subcutaneous fat in unipolar PDFF maps as compared to the same regions in bipolar PDFF maps (p<0.001). The measured fat fractions were the same per region between unipolar and bipolar images, and are reported in Table 1. The t-test for difference (unipolar minus bipolar) against 0 for fat volume was not significant (p=0.314), indicating the results were statistically similar.DISCUSSION
Our results indicate that the bipolar sequence performs like unipolar in terms of quantifying fat in vivo as indicated in table 1 while doubling the image resolution. Higher resolution helps delineate fat tissue where the boundary between the fat and other tissues may be unclear due to partial volume effects, as is demonstrated in Figure 1. The results from figure 2 indicate the boundaries between subcutaneous and visceral fat in unipolar PDFF maps suffer from partial volume effects as their mean fat fraction are higher compared to the same regions in bipolar PDFF maps. Therefore, the high-resolution bipolar sequence would be ideal for both manual and automated segmentation to produce more accurate quantitative results.CONCLUSION
We have demonstrated that high-resolution bipolar water-fat imaging reduces partial volume effects without compromising the ability in quantifying fat as compared to conventional unipolar water-fat imaging under the same imaging time.Acknowledgements
No acknowledgement found.References
1. Castañeda-Gutiérrez E, Pouteau E, Pescia G, et al. The guinea pig as a model for metabolic programming of adiposity. The American J of Clin Nutrition. 2011; 94:1838S-1845S. 2. Ranefall P, Bidar AW, Hockings PD. Automatic segmentation of intra‐abdominal and subcutaneous adipose tissue in 3D whole mouse MRI. JMRI. 2009;30(3):554-60. 3. Reeder SB, McKenzie CA, Pineda AR, et al. Water–fat separation with IDEAL gradient‐echo imaging. Journal of Magnetic Resonance Imaging. 2007 Mar 1;25(3):644-52. 4. Soliman AS, Wiens CN, Wade TP, et al. Fat Quantification with an Interleaved Bipolar Acquisition, Magnetic Resonance in Medicine. 2016; 75:2000–2008. 5. Pruessmann KP, Weiger M, Börnert P, et al. Advances in sensitivity encoding with arbitrary k‐space trajectories. Magnetic resonance in medicine. 2001 Oct 1;46(4):638-51. 6. Soliman AS, Yuan J, Vigen KK, et al. Max‐IDEAL: A max‐flow based approach for IDEAL water/fat separation. Magnetic resonance in medicine. 2014 Aug 1;72(2):510-21.Figures
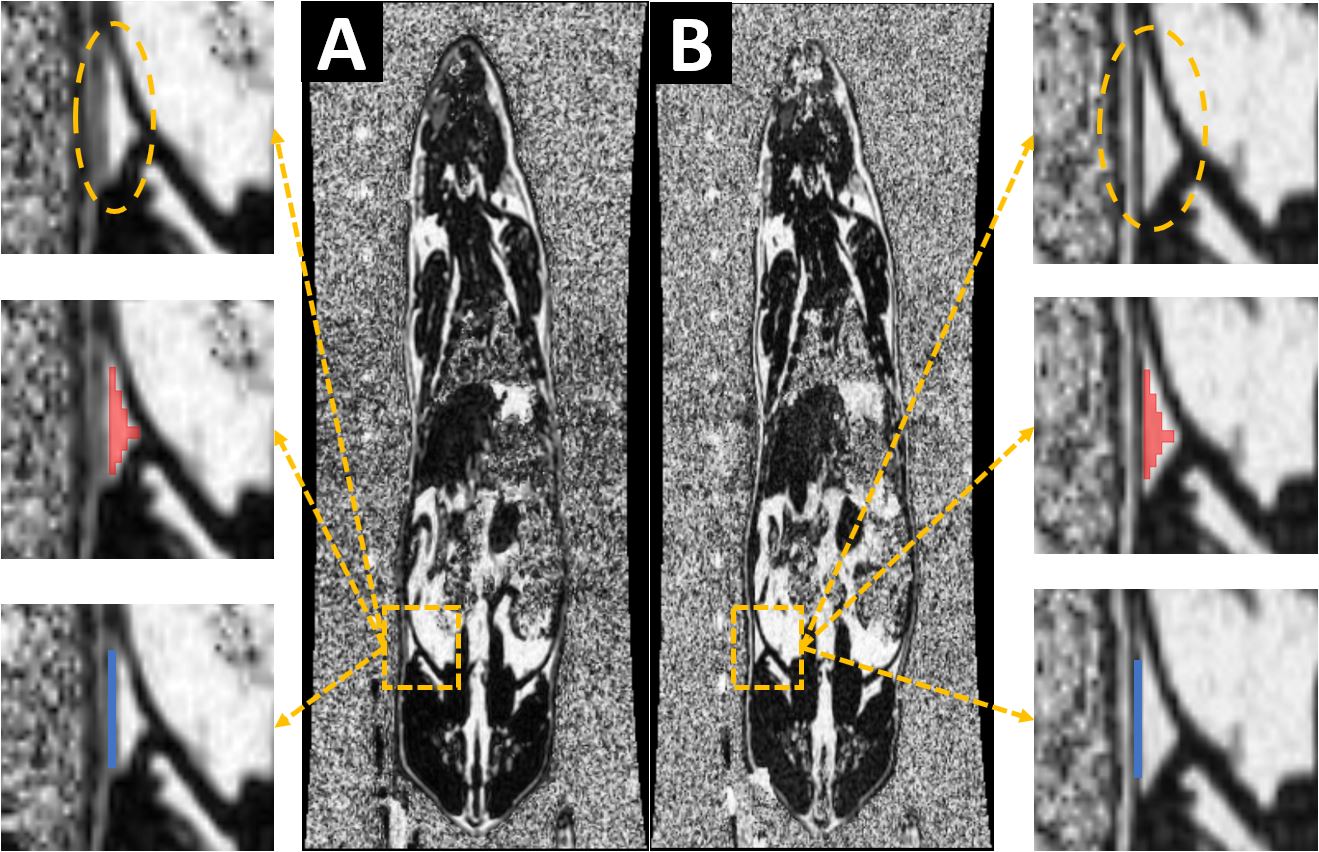
Figure 1. Representative
unipolar (A) and bipolar (B) Proton Density Fat Fraction maps of a guinea pig.
The box indicates the region selected to perform abdominal fat quantification.
The red mask represents the ROI selected for abdominal fat quantification. The blue
line represents
the boundary region selected to assess partial volume effect. Notice the
sharper boundaries in bipolar image as indicated by the orange oval shape.
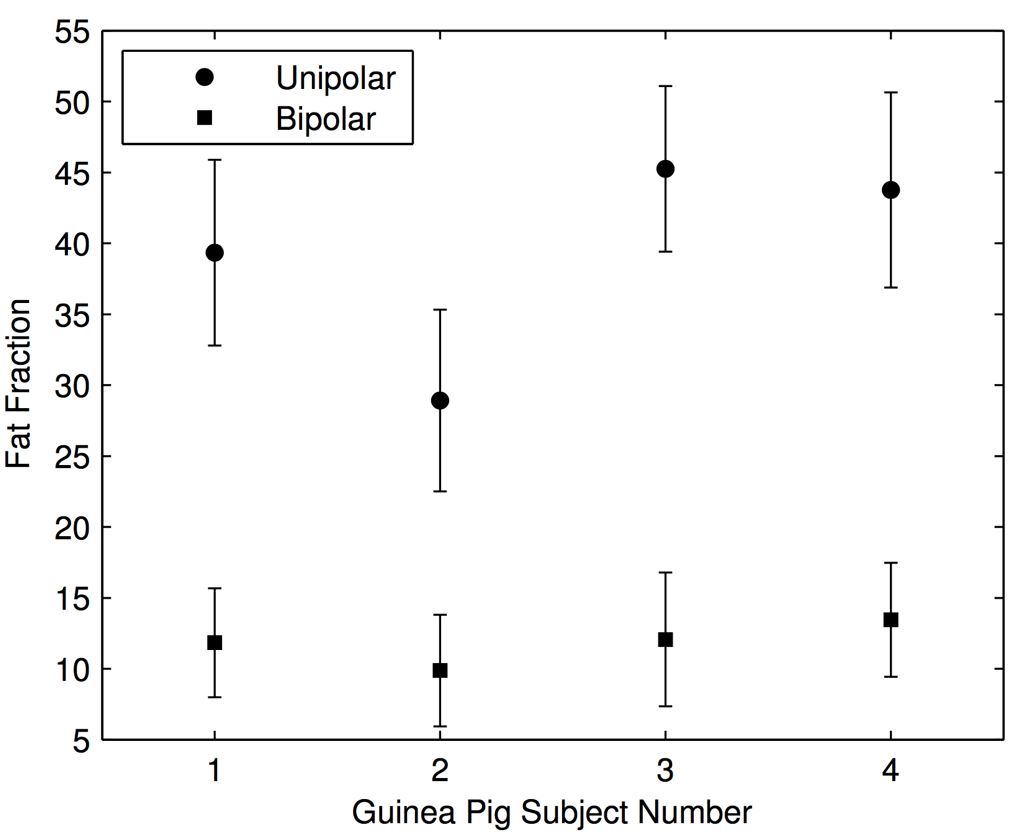
Figure 2. In vivo Proton Density Fat Fraction (PDFF)
measurements in the boundary between visceral and subcutaneous fat regions in
four guinea pigs using bipolar and unipolar water-fat imaging. Unipolar PDFF
measurements showed higher values as a result of partial volume effects
(p<0.001).
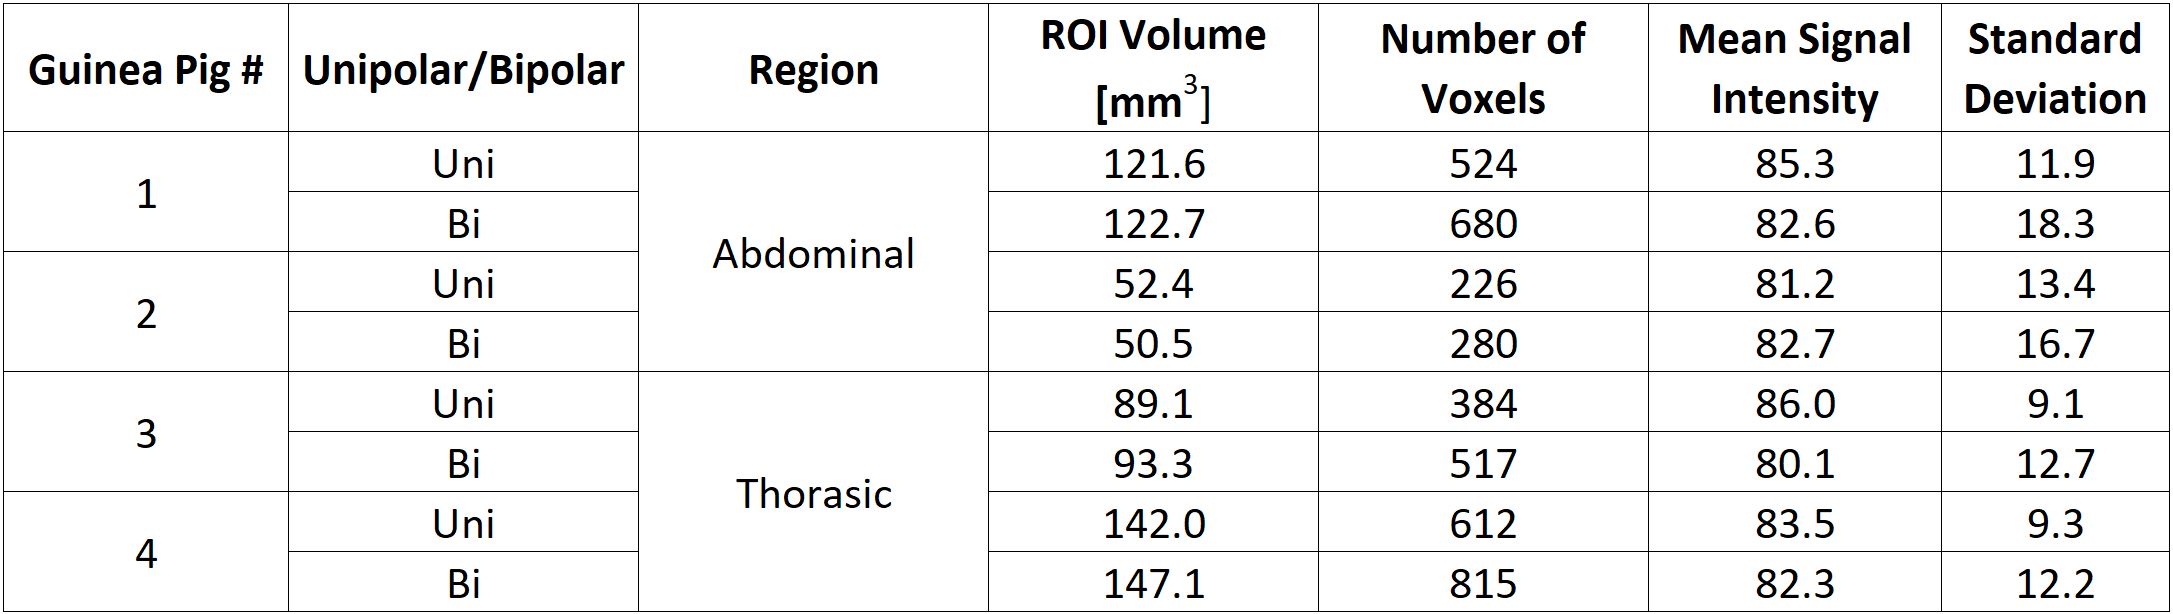
Table 1. In vivo abdominal and thoracic fat quantification in four guinea pigs using unipolar and bipolar water-fat imaging. To assess the level of agreement (i.e., identical fat quantification results) between unipolar and bipolar measurements of Proton Density Fat Fraction (PDFF), a one-sample t-test was performed on the PDFF measurements difference values. The result of t-test for difference (unipolar minus bipolar) against 0 for fat volume was not significant (p=0.314), indicating the results were statistically similar.