0536
Repeatability and Reproducibility of a New Method for Quantifying Triglyceride Saturation Using Bipolar Multi-Echo MRI1Pattern Recognition Lab, Department of Computer Science, Friedrich-Alexander-Universität Erlangen-Nürnberg, Erlangen, Germany, 2Radiology, Duke University Medical Center, Durham, NC, United States, 3Center for Advanced Magnetic Resonance Development, Duke University Medical Center, Durham, NC, United States, 4MR Application Predevelopment, Siemens Healthcare GmbH, Erlangen, Germany, 5MR R&D Collaborations, Siemens Healthineers, Cary, NC, United States
Synopsis
Our purpose was to develop a robust method for joint quantification of water and fat fractions as well as fatty acid maps from bipolar multi-echo MR data. Its accuracy and reproducibility across field strengths and sequences was demonstrated using an oil phantom. Repeated in-vivo breath-hold acquisitions in n = 11 patients yielded median absolute differences of 4.8%, 1.0% and 8.2% for the saturated, mono-unsaturated and poly-unsaturated fat components in the liver, spleen and subcutaneous, perirenal and mesenteric fat depots.
Introduction
Non-alcoholic fatty liver disease (NAFLD) is a metabolic derangement characterized by abnormal amounts of triglyceride deposition in the liver which can progress to non-alcoholic steatohepatitis, with attendant liver injury, fibrosis, and ultimately cirrhosis. Triglycerides throughout the body can be described on a molecular level based on their saturation state. The degree of saturation of triglycerides has been linked to hepatocyte ballooning, one of the histopathological hallmarks of NASH1,2. Several MR-based methods that calculate fatty acid maps based on fitting complex multi-echo data to a signal model have been proposed3-7. The applied confounder-corrected signal model contains many unknown parameters, hence determining the triglyceride saturation in a robust manner is challenging, and solutions may be unstable8. We propose a new method that jointly estimates confounding factors and fatty acid maps from bipolar multi-echo data, and evaluate it with regard to repeatability and reproducibility.Methods
Fatty acid composition quantification: We modeled the evolution of a multi-echo MRI signal acquired using bipolar readout gradients using a complex water component and a 9-peak fat model, which is expressed by means of the number of double bonds (ndb) and the number of methylene-interrupted double bonds (nmidb)9,10. The signal model was confounder-corrected for the field map11-12, extrinsic R'2 and intrinsic R2 components4,5, and an eddy-current phase compensation for phase mismatches between even and odd echoes13. The spatially dependent parameters ndb and nmidb were calculated using the procedure depicted in Fig. 1. Then, saturated, mono-unsaturated and poly-unsaturated fatty acid estimates were determined4. In the proposed approach, the eddy-current phase is analytically addressed by the field map and the relaxation parameter which allows for decoupling of these parameters.
Phantom study: Accuracy and reproducibility were assessed by imaging a vegetable oil phantom containing 17 individual oils and oil mixtures filled into plastic vials inside a water bath. In order to assess the effects of field strengths and sequences, on a 3T MR scanner (MAGNETOM Skyra, Siemens Healthcare, Erlangen, Germany) the phantom was imaged using a prototypical 2D multi-slice GRE sequence, and at 1.5T (MAGNETOM Aera, Siemens Healthcare, Erlangen, Germany) using a prototypical 3D Cartesian VIBE, by means of a 18-channel body and a spine array coil. Table 1 depicts the protocol parameters used. Fatty acid estimates within cylindrical volumes of interest (VOIs) were compared to reference values from the manufacturer using linear correlation analyses. A Bland-Altman analysis was performed to estimate agreement between protocols 1 and 2.
In-Vivo study: In-vivo measurements were performed in n = 11 patients (5 male, 6 female, age: 20.9±18.0 years, weight: 79.5±26.4 kg) undergoing MRI as part of assessment for NAFLD. Each patient was imaged twice at 3T (MAGNETOM Trio a Tim system, Siemens Healthcare, Erlangen, Germany) using a multi-echo GRE pulse sequence acquiring 12 echoes identical to protocol 1 in the phantom study in one breath-hold. Proton density fat fraction (PDFF) maps, saturated, unsaturated, mono-unsaturated, and poly-unsaturated fatty acid maps, and R2* maps were generated using both a previously published step-wise8, and the proposed jointly optimized reconstruction. A total of 11 regions of interest (ROIs) were drawn on the PDFF maps in the liver, spleen, subcutaneous fat (right/left and high/low), perirenal fat (right/left and high/low), and mesenteric fat on each of the above maps, and the difference between mean values from the repeated acquisitions was calculated and compared by location and reconstruction algorithm.
Results and Discussion
The linear correlation analysis in Fig. 2 demonstrated a higher linearity for protocol 1 vs. protocol 2 (Pearson's linear correlation coefficients 0.99; 0.98; 0.98; vs. 0.88; 0.91; 0.96 for the saturated, mono-unsaturated and poly-unsaturated fat component, respectively). The Bland-Altman analysis in Fig. 3 yielded biases of -5.8% (saturated fat), 2.46% (mono-unsaturated fat), and 3.3% (poly-unsaturated fat) between the two protocols.
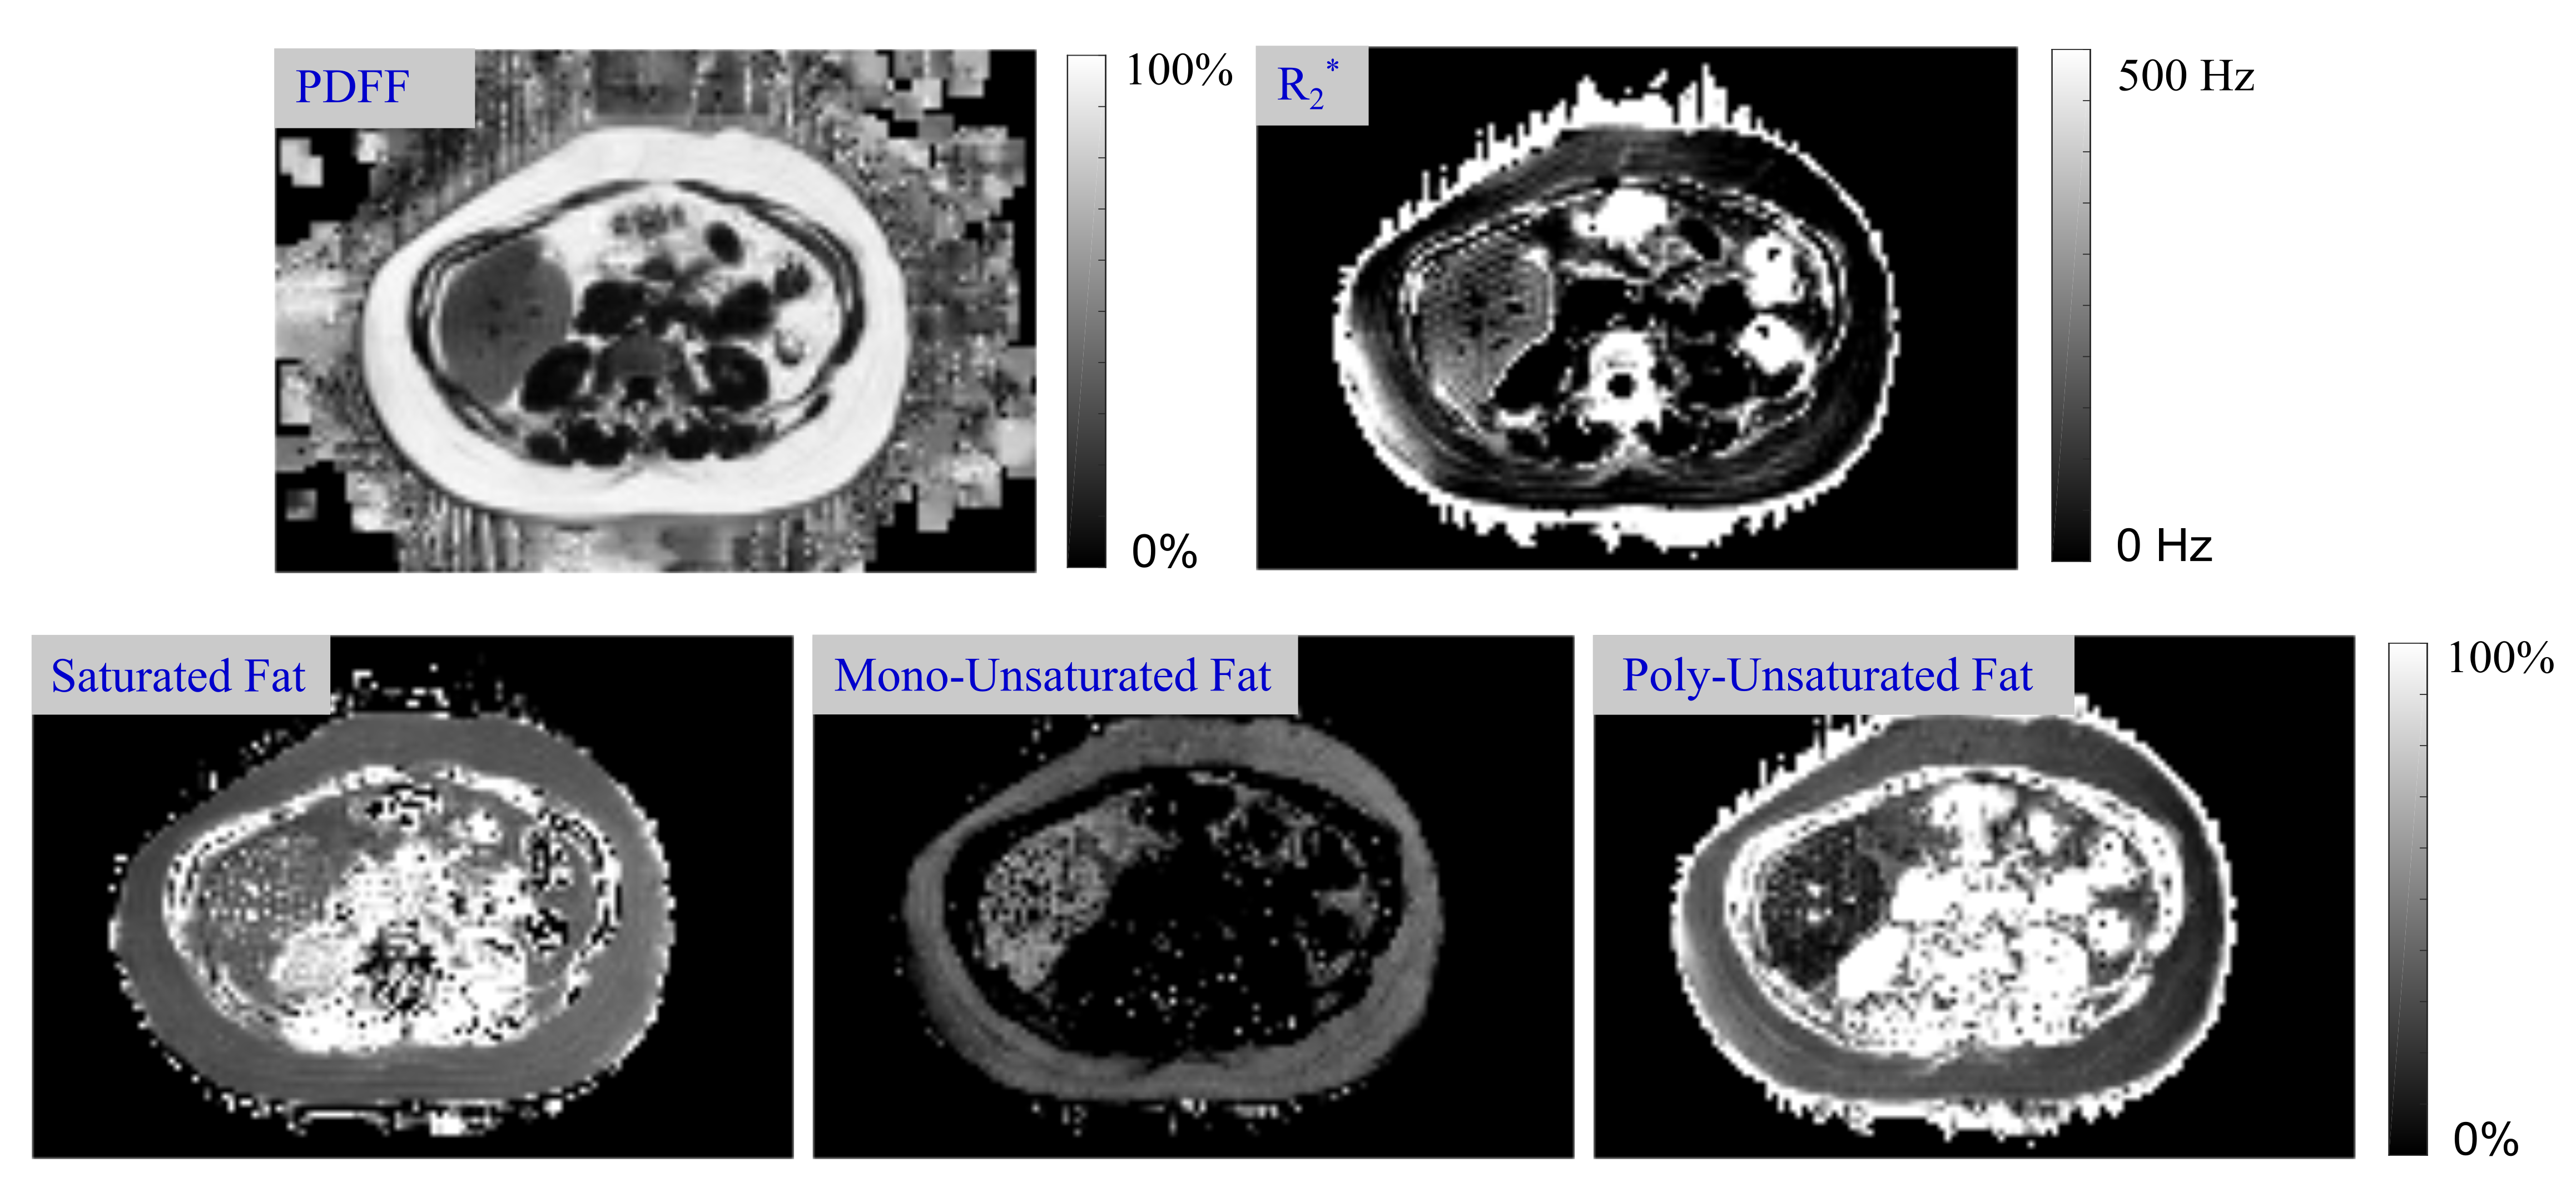
The in-vivo repeatability analysis demonstrated generally lower variability for the joint optimization algorithm compared to the step-wise algorithm on the mono-unsaturated, unsaturated, and R2* maps (median absolute difference 1% vs. 4.2%; 5.4% vs. 11.6%; 4.1% vs. 8.3%, respectively), with similar repeatability for the saturated and poly-unsaturated maps (median absolute difference 4.8% vs. 5.0%; 8.2% vs. 8.7%, respectively). Fig. 4 shows exemplary in-vivo parameter maps reconstructed with the proposed approach.
Conclusion
We have presented an approach for quantifying triglyceride saturation using bipolar multi-echo MRI and showed its accuracy and reproducibility across field strengths and sequences using a vegetable oil phantom. We have demonstrated its in-vivo repeatability in the liver, spleen, and abdominal fat depots.Acknowledgements
No acknowledgement found.References
1. Flintham R, Eddowes P, Semple S, et al. Non-Invasive Quantification and Characterisation of Liver Fat in Non-Alcoholic Fatty Liver Disease (NAFLD) Using Automated Analysis of MRS Correlated with Histology. In: Proceedings of the 24th Annual Meeting of ISMRM; 2016. #0357.
2. van Werven JR, Schreuder TC, Nederveen AJ, et al. Hepatic unsaturated fatty acids in patients with non-alcoholic fatty liver disease assessed by 3.0 T MR spectroscopy. Eur J Radiol. 2010;75(2):e102-e107.
3. Berglund J, Ahlström H, Kullberg J. Model-based mapping of fat unsaturation and chain length by chemical shift imaging - phantom validation and in vivo feasibility. Magn Reson Med. 2012;68(6):1815-1827.
4. Peterson P, Månsson S. Simultaneous quantification of fat content and fatty acid composition using MR imaging. Magn Reson Med. 2013;69(3):688-697.
5. Peterson P, Svensson J, Månsson S. Relaxation effects in MRI-based quantification of fat content and fatty acid composition. Magn Reson Med. 2014;72(5):1320-1329.
6. Leporq B, Lambert SA, Ronot M, et al. Quantification of the triglyceride fatty acid composition with 3.0 T MRI. NMR Biomed. 2014;27(10):1211-1221.
7. Leporq B, Lambert SA, Ronot M, et al. Hepatic fat fraction and visceral adipose tissue fatty acid composition in mice: Quantification with 7.0 T MRI. Magn Reson Med. 2016;76(2):510-518
8. Schneider M, Lugauer F, Nickel D, et al. Improving the Noise Propagation Behavior of Different Fatty Acid Quantification Techniques using Spectral Denoising. In: Proceedings of the 25th Annual Meeting of ISMRM, Honolulu, HI, USA; 2017. #5195.
9. Hamilton G, Yokoo T, Bydder M, et al. In vivo characterization of the liver fat 1H MR spectrum. NMR Biomed. 2011;24(7):784-790.
10. Bydder M, Girard O, Hamilton G. Mapping the double bonds in triglycerides. Magn Reson Imaging. 2011;29(8):1041-1046.
11. Hernando D, Haldar J, Sutton B, et al. Joint estimation of water/fat images and field inhomogeneity map. Magn Reson Med. 2008;59(3):571-580.
12. Hernando D, Kellman P, Haldar J, et al. Robust water/fat separation in the presence of large field inhomogeneities using a graph cut algorithm. Magn Reson Med. 2010;63(1):79-90.
13. Peterson P, Månsson S. Fat quantification using multiecho sequences with bipolar gradients: investigation of accuracy and noise performance. Magn Reson Med. 2014;71(1):219-229.
14. Lugauer F, Nickel D, Wetzl J, et al. Robust Spectral Denoising for Water-Fat Separation in Magnetic Resonance Imaging. In: International Conference on Medical Image Computing and Computer-Assisted Intervention. Springer; 2015. p. 667-674.
Figures