0535
New post-processing methods for simultaneous measurement of R2, R2', R2*, QSM, positive and negative susceptibility maps using mGESFIDE acquisition1Department of electrical and computer engineering, Seoul National University, Seoul, Republic of Korea, 2Department of Biomedical Engineering, Hankuk University of Foreign Studies, Gyeonggi-do, Republic of Korea
Synopsis
In this work, we demonstrated that a modified gradient-echo sampling of FID and echo (mGESFIDE) sequence was able to produce multiple contrast images (R2, R2', R2*, local field map, QSM, positive and negative susceptibility maps) in 5 minutes of scan time. We developed a new algorithm for improved R2 and R2' maps by considering RF slice profiles in the excitation and refocusing RF pulses. Additionally, we developed a new method that generated a high-quality local field map by utilizing all echoes of mGESFIDE.
Introduction
Quantitative MR imaging (qMRI) is an important method in exploring tissue composition and properties [1,2]. qMRI, however, is hindered by a long acquisition time in obtaining multiple contrast images. In this work, we demonstrated that a modified gradient-echo sampling of FID and echo (mGESFIDE) sequence [3,4] could obtain multiple contrast images (R2, R2', R2*, local field map, QSM, positive and negative susceptibility maps [5]) in 5 minutes of scan time. In particular, we developed a new algorithm for improved R2 and R2' maps by considering RF slice profiles in the excitation and refocusing RF pulses. Additionally, we developed a new method that generated a high-quality local field map by utilizing all echoes of mGESFIDE.Methods
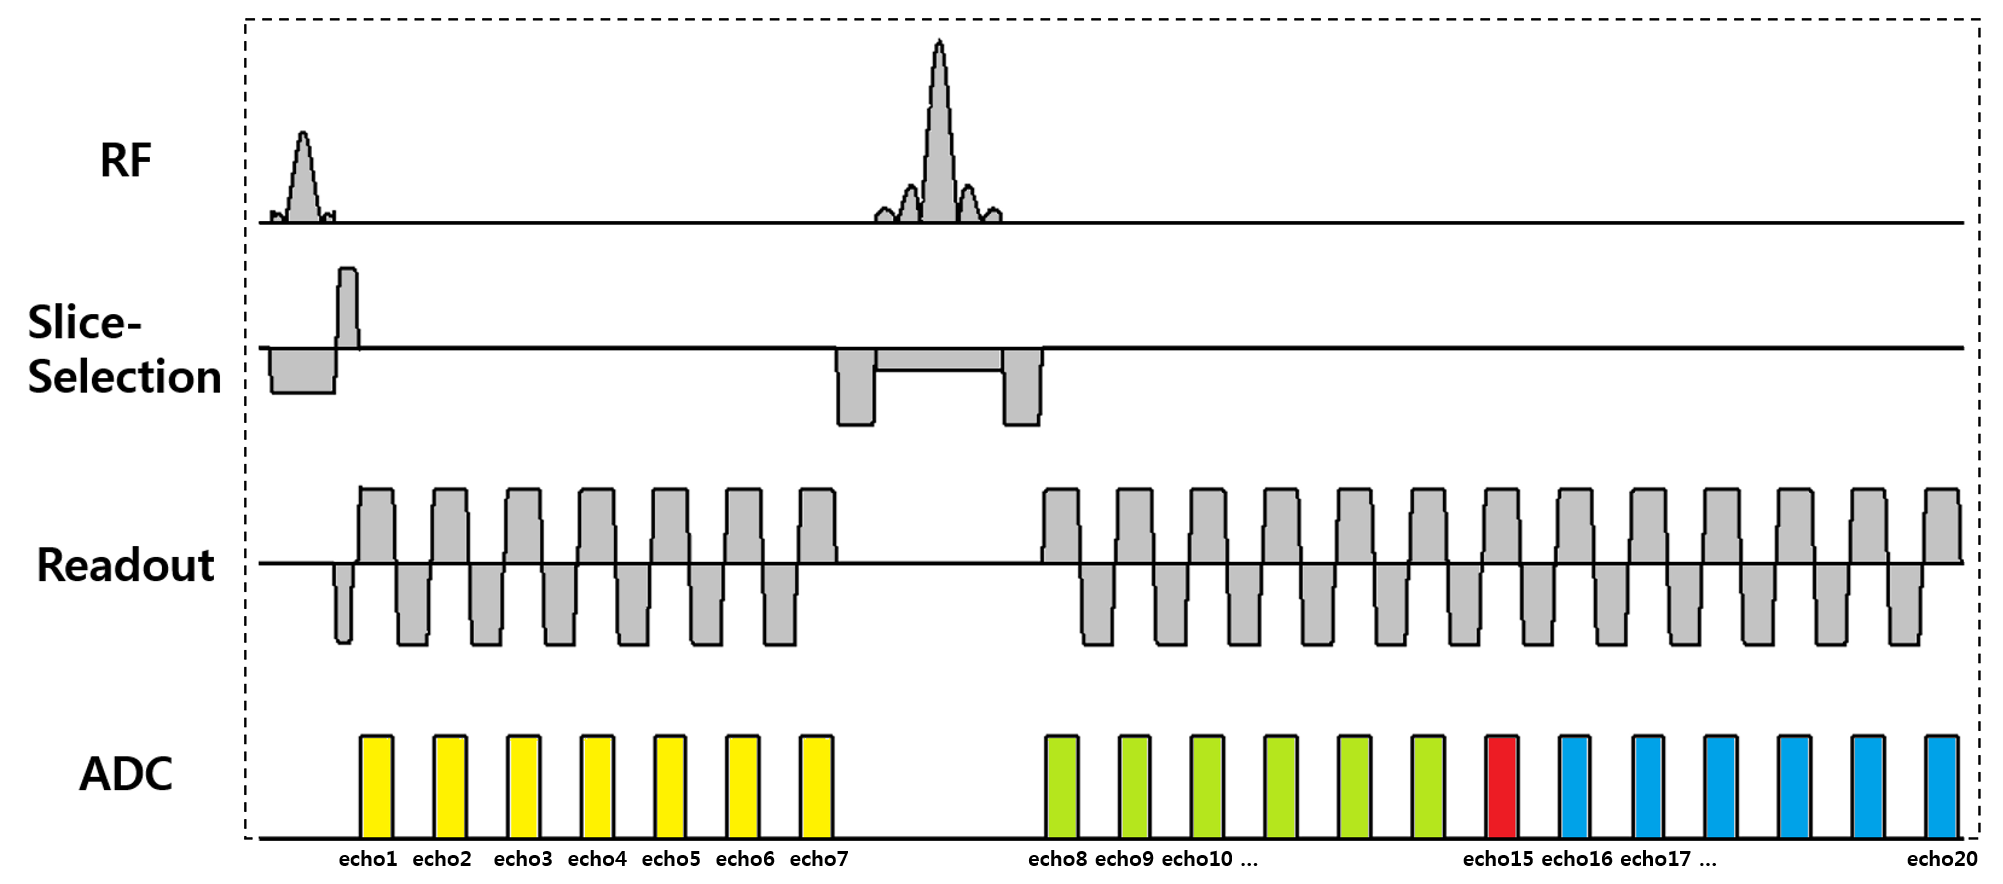
[Pulse sequence] Data was collected at 3T using a 2D mGESFIDE sequence (Fig. 1). Total 20 echoes were acquired before (3:3:21 ms, 7 echoes) and after the refocusing RF pulse (31:3:67 ms, 13 echoes). The scan parameters were as follows: TR = 3000 ms, voxel size = 1x1 mm2, number of slices = 40 and scan time = 5:36 minutes. For comparison, 2D multi-echo SE and GRE were acquired (SE: 10 echoes (10:10:100 ms), TR = 3500 ms; GRE: 7 echoes (3.06:4.59:30.6 ms), TR = 2400 ms; Other parameters were the same). The total scan time for SE and GRE was 14:55 minutes.
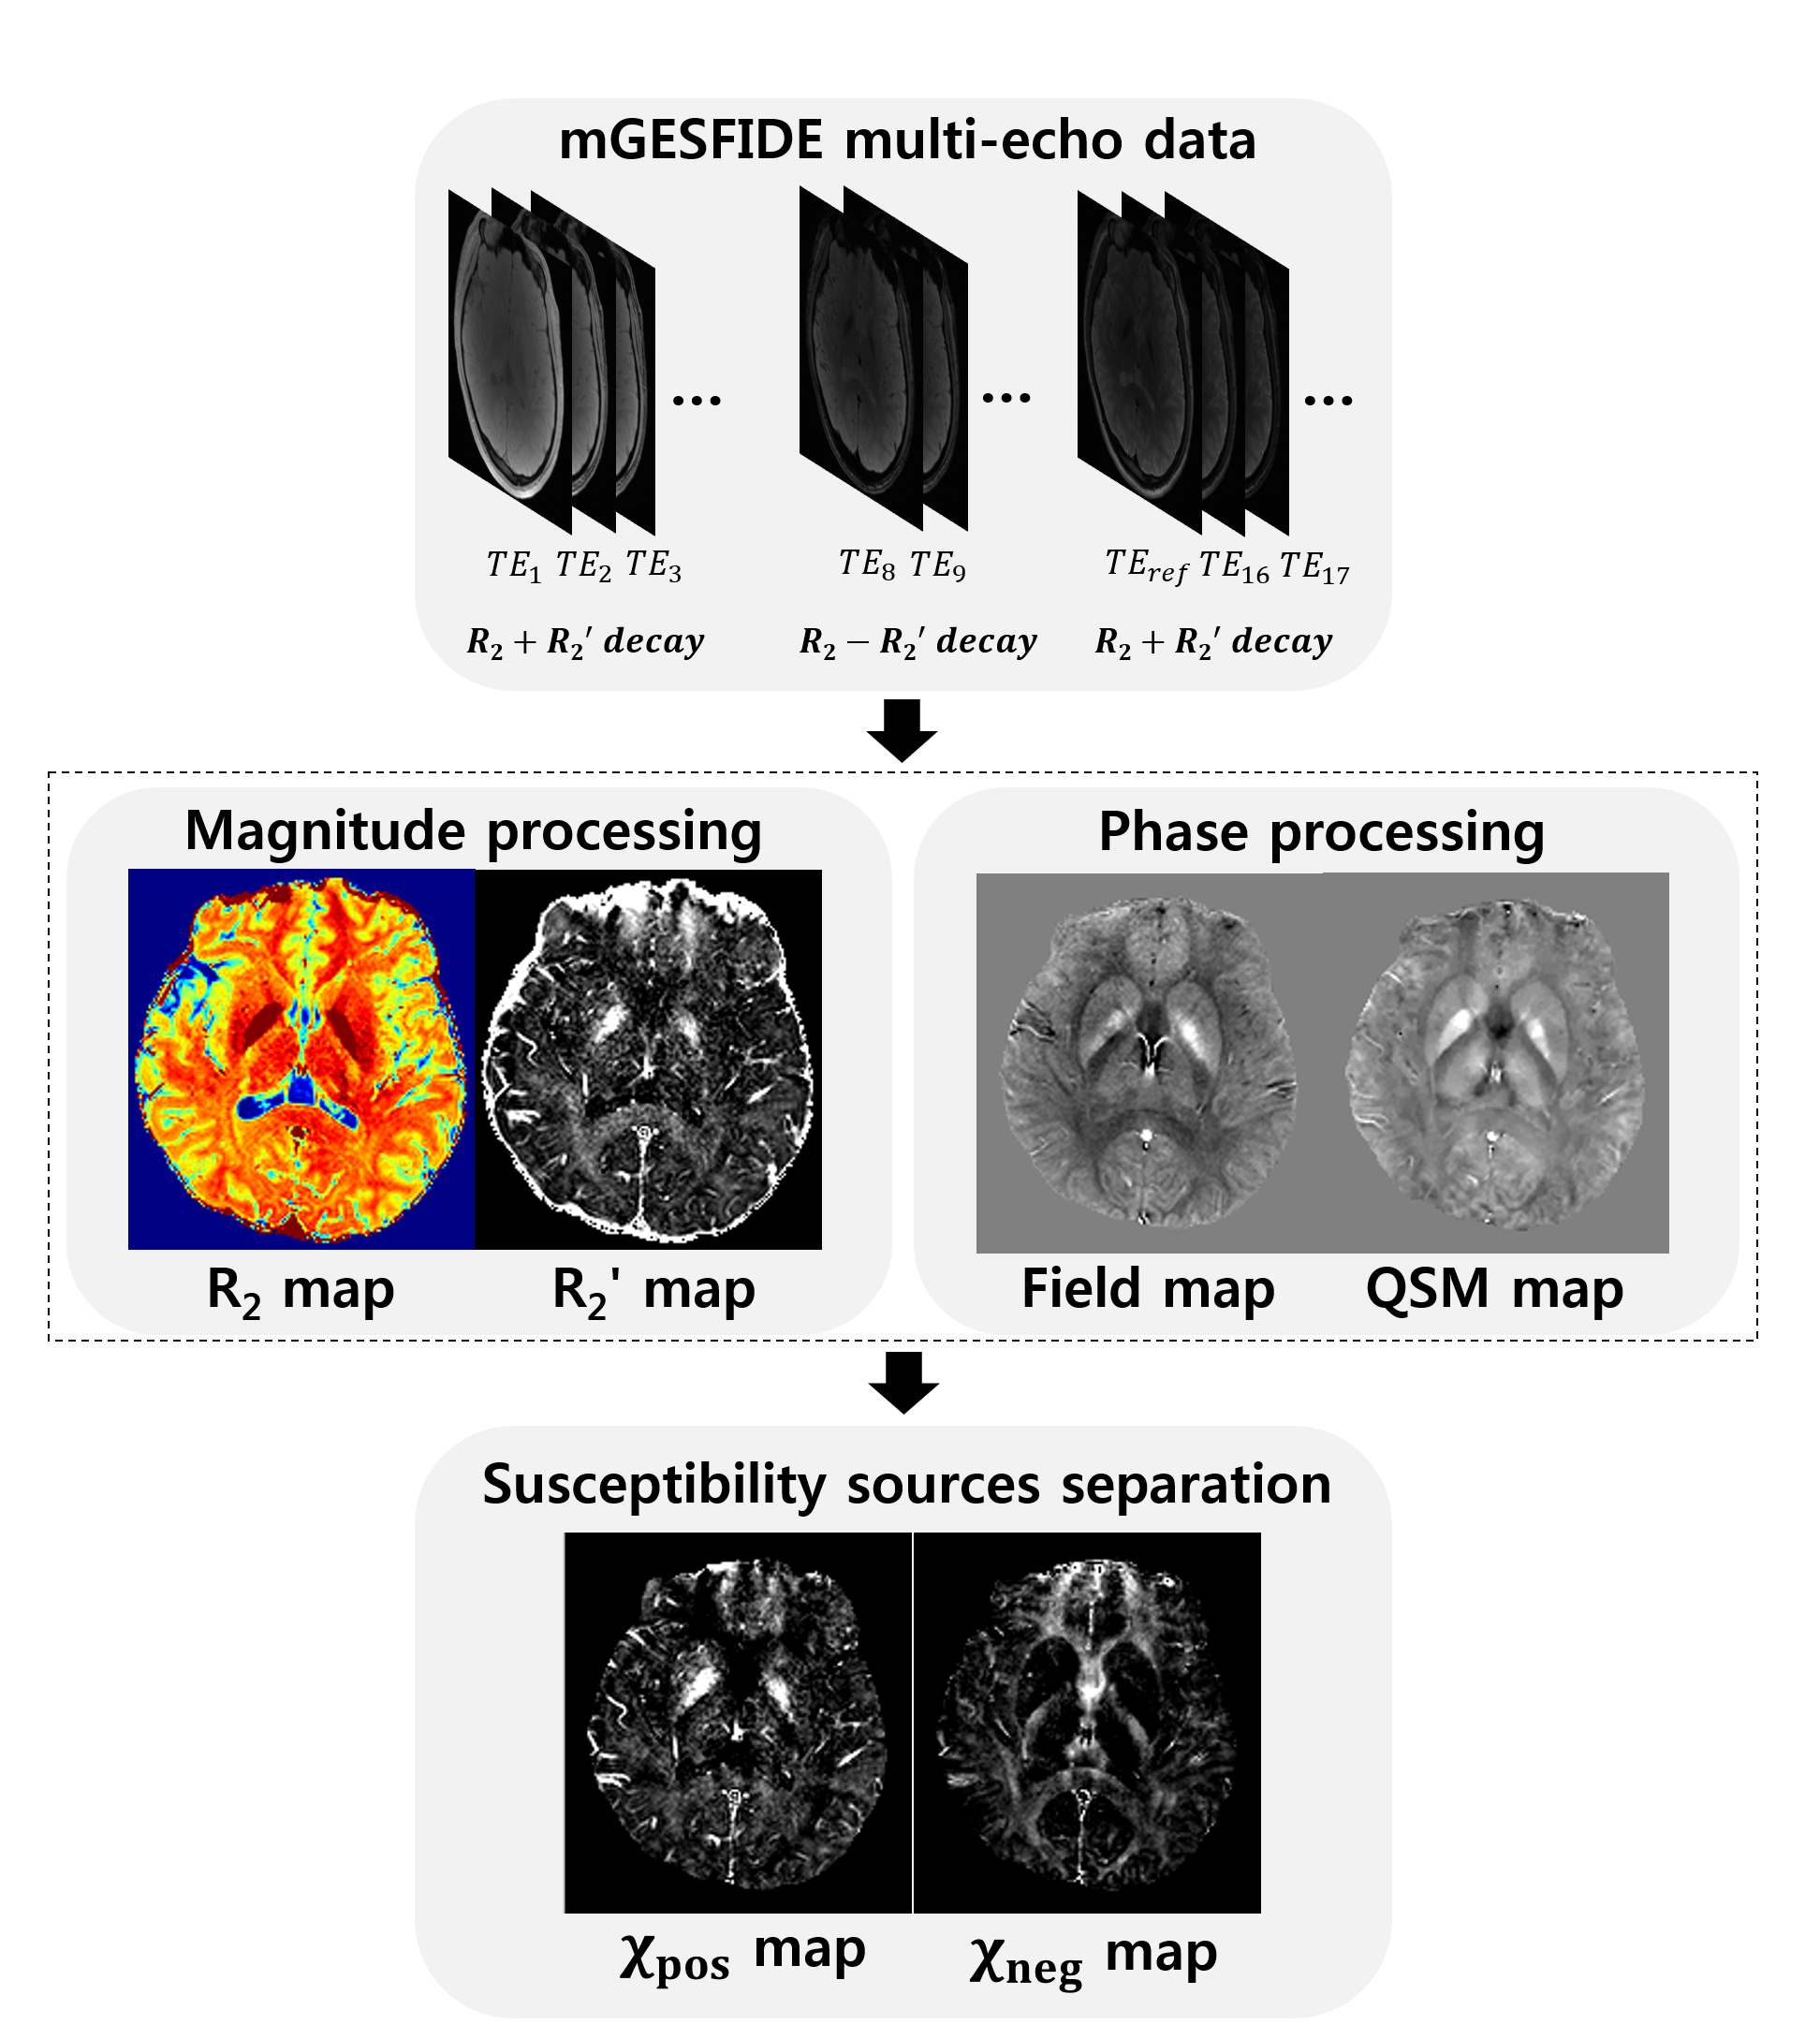
[R2 and R2' estimation] Overall data processing pipeline is summarized in Figure 2. A novel R2 and R2' estimation method incorporated the excitation and refocusing RF slice profiles in the model which was expressed as follows:$$S(TE)=\begin{cases}\sum_zsin\space\alpha(z)\cdot exp(-(R_2 + R_2')\cdot TE) & TE<TE_{ref}/2\\\sum_zsin\space\alpha(z)\cdot(1-cos\space\beta(z))\cdot exp(-R_2\cdot TE)\cdot exp(-R_2'\cdot|TE-TE_{ref}|) & TE>TE_{ref}/2\end{cases}\space\space\space\space\space\space[Eq. 1]$$ where α and β are excitation and refocusing flip angles calculated by RF slice profile sampled with 200 points along the z-direction denoted by z [6], S is a generated signal, TE is echo time, and TEref is refocusing echo time (=52 ms). To estimate R2 and R2', a dictionary was filled with generated signals over a wide range of R2 and R2' values (R2 = 0:0.1:40 Hz and R2' = 0:0.1:30 Hz). This dictionary was searched for the best matching parameters for mGESFIDE data. The results of this dictionary matching method were compared with those from conventional GESFIDE processing which does not incorporate slice profile information [3]. The additional comparison was performed with the results from GRE and SE.
[Local field estimation] For a reliable estimation of the field map in mGESIFIDE, a new method utilizing all echoes of mGESFIDE was developed. The minimization problem is given as follows:$$argmin_{f,\phi_0,\phi_1}\sum_{TE_j<TE_{ref}/2}||S(TE_j)-A(TE_j)\cdot exp(i\cdot(f\cdot TE_j+\phi_{0}))||^2_2+\sum_{TE_k>TE_{ref}/2}||S(TE_k)-A(TE_k)\cdot exp(i\cdot(f\cdot TE_k+\phi_{1}))||^2_2\space\space\space\space\space\space[Eq. 2]$$where f represents the frequency shift of a voxel which is the same before and after the refocusing RF pulse, Φ0 and Φ1 are different phase offsets before and after the refocusing RF pulse, S is the complex signal data, A is the signal magnitude. The cost function was linearized and updated iteratively [7]. From f, local field was estimated [8]. For comparison, complex multi-echo data from GRE were processed for a local field map. QSM maps were generated from the local field maps using MEDI [9].
[Susceptibility source separation] Since our sequence provides both R2' and local field maps, one can perform susceptibility sources separation to generate positive and negative susceptibility source maps (χpos and χneg) as suggested in [5]. The results were compared with the maps generated using R2' and local field maps from the SE and GRE.
Results
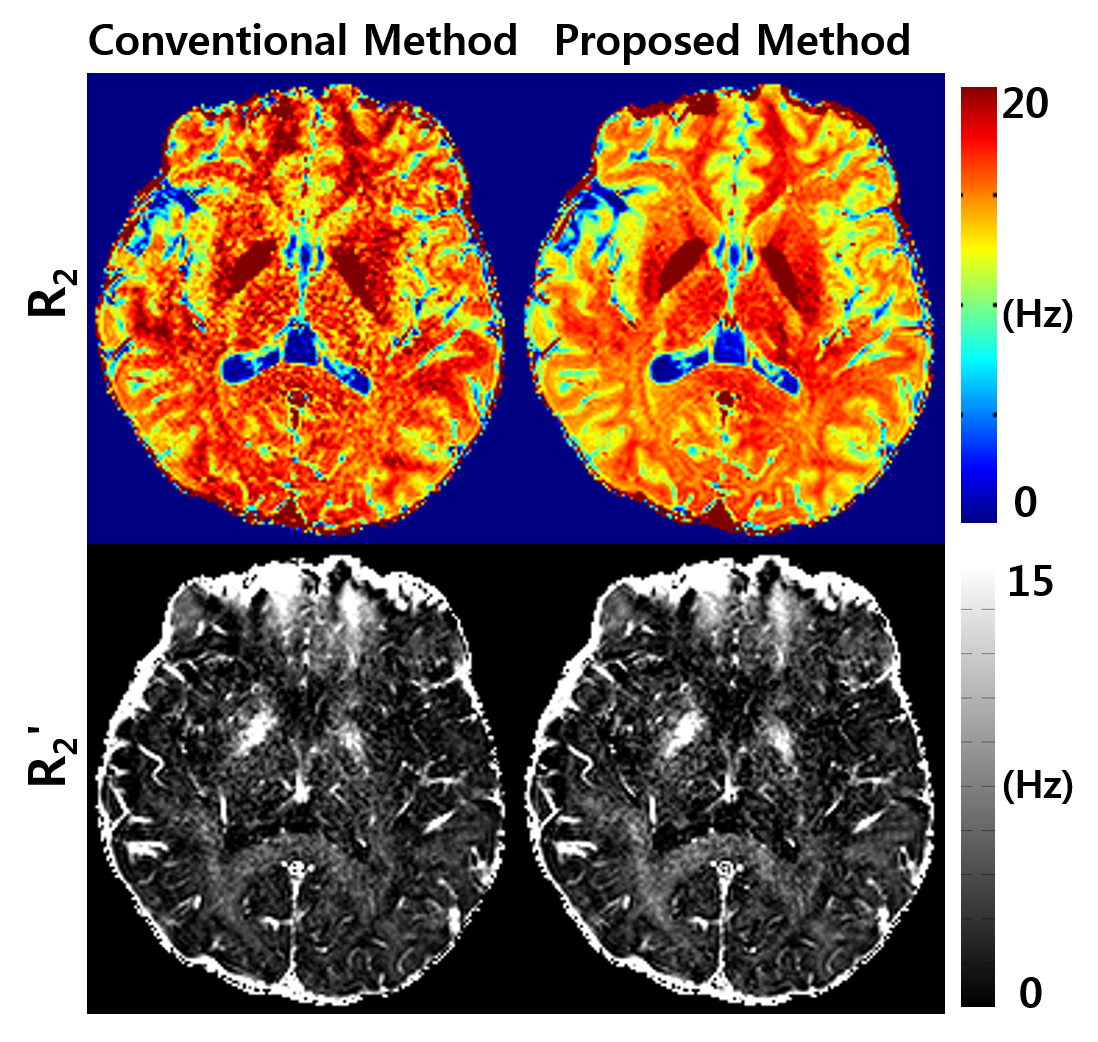
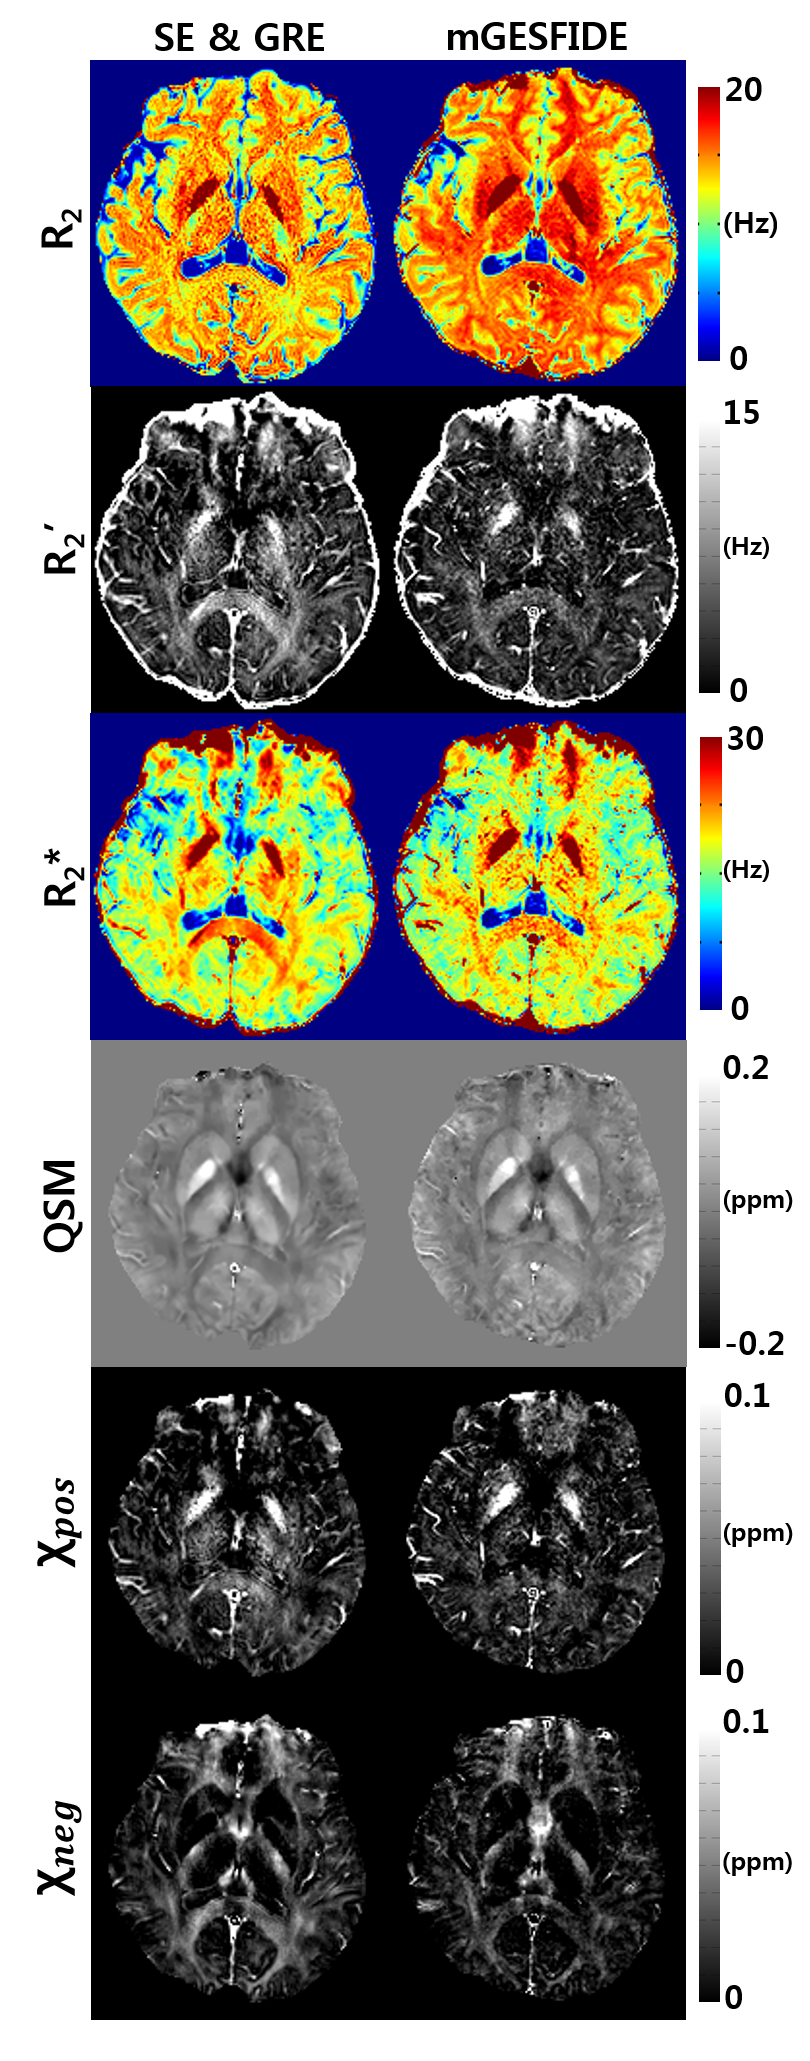
Figure 3 compares R2 and R2' maps from the conventional GESFIDE processing [3] and the proposed method. The maps from the proposed method show higher image quality than the conventional maps. Figure 4 summarizes the R2, R2', R2*, QSM, χpos and χneg maps for a representative slice (left column: GRE and SE results, right column: mGESFIDE results). The QSM results show a high similarity between the two methods. Both χpos and χneg maps show similar contrasts. For example, deep grey matter such as globus pallidus has high intensity in both χpos maps whereas χneg maps show unnoticeable signal in these regions. The R2 map from the proposed method shows higher values than that from SE, which may be explained by diffusion effect [10,11]. As a result, R2' map with lower values was generated in the proposed method.Discussion and Conclusions
In this work, we demonstrated that mGESFIDE produces six image contrasts in 1/3 of the original scan time. The novel post-processing technique improved the quality of R2 and R2' maps, suggesting that the slice profiles need to be included in the model.Acknowledgements
This work was supported by Creative-Pioneering Researchers Programs through Seoul National University (SNU).References
[1] Lorio et al. Neurobiological origin of spurious brain morphological changes: a quantitative MRI study. HBM. 2016.
[2] Petiet et al. Gray and White Matter Demyelination and Remyelination Detected with Multimodal Quantitative MRI Analysis at 11.7 T in a Chronic Mouse Model of Multiple Sclerosis. Front Neurosci. 2016.
[3] Ma et al. Method for Image-Based Measurement of the Reversible and Irreversible Contribution to the Transverse-Relaxation Rate. JMR. 1995.
[4] Ni et al. Comparison of R2’ Measurement Methods in the Normal Brain at 3 Tesla. MRM. 2015.
[5] Lee et al. Separating positive and negative susceptibility sources in QSM. ISMRM. 2017.
[6] Pauly et al. Parameter relations for the Shinnar-Le Roux selective excitation pulse design algorithm (NMR imaging). IEEE transactions on medical imaging 10.1 (1991): 53-65.
[7] Liu et al. Nonlinear Formulation of the Magnetic Field to Source Relationship for Robust Quantitative Susceptibility Mapping. MRM. 2013.
[8] Liu et al. A novel background field removal method for MRI using projection onto dipole fields (PDF). NMR in Biomedicine. 2011.
[9] Liu et al. Morphology Enabled Dipole Inversion (MEDI) from a Single-Angle Acquisition: Comparison with COSMOS in Human Brain Imaging. MRM. 2011.
[10] Jensen et al. Quantitative Model for the Interecho Time Dependence of the CPMG Relaxation Rate in Iron-Rich Gray Matter. MRM. 2001.
[11] Stefanovic et al. Quantitative T2 in the Occipital Lobe: The Role of the CPMG Refocusing Rate. JMRI. 2003.
Figures