0533
On the Sensitivity of Bone Marrow Magnetic Susceptibility and R2* on Trabecular Bone Microstructure1Diagnostic and Interventional Radiology, Technical Univeristy of Munich, Munich, Germany, 2Institute of Medical Engineering, Technical University of Munich, Munich, Germany, 3Philips Research Laboratory, Hamburg, Germany, 4Department of Diagnostic and Interventional Neuroradiology, Technical University of Munich, Munich, Germany
Synopsis
In numerical simulations and initial in vivo results of multi-parametric mapping in the calcaneus, the feasibility of measuring trabecular bone microstructure is explored. The combination of R2* for measuring intra-voxel dephasing and quantitative magnetic susceptibilty to detect trabecular bone density is investigated and indicates feasibility to differentiate trabecular bone networks with isotropic and anisotropic microstructure.
Introduction/Purpose
Trabecular bone imaging remains highly clinically significant in monitoring bone loss and predicting fracture risk in patients with osteoporosis [1]. R2* mapping has been used extensively in the late 90s to measure trabecular bone density by probing the magnetic field inhomogeneity effects induced by the magnetic susceptibility differences between the bone matrix and the surrounding bone marrow [1]. However, R2* mapping has been shown to be affected by the field strength [2], the tissue R2 relaxation times [3], and the trabecular bone microstructure [2,4]. Quantitative susceptibility mapping (QSM) has recently been applied for measuring bone magnetic susceptibility [5,6]. Susceptibility inside trabecularized bone marrow regions is a potential non-invasive imaging biomarker proportional to bone density, measuring a fundamental tissue property independent of field strength and tissue relaxation properties [5,6]. However, it remains unknown how QSM-based susceptibility depends on trabecular bone microstructure. The problem has similarities to recent work in brain QSM [8], where information about the distribution of paramagnetic iron inside single MR voxels was deduced by voxel-wise regression of χ versus R2* in iron-rich brain regions. The susceptibility difference between diamagnetic trabecular bone to bone marrow is opposite to the situation of iron in brain QSM. In theory, QSM in bone marrow is equally sensitive to the absolute amount of bone inside a single MR voxel, while R2* measures intra-voxel dephasing dependent on topological properties of the trabecular network. The purpose of the present work is to characterize the sensitivity of bone marrow magnetic susceptibility and R2* on trabecular bone microstructure using both numerical simulations and in vivo measurements.Methods
Simulation
From thresholded micro CT scans of eight human femoral trabecular bone cubes (Figure 1), microscopic field maps were forward-simulated with a χ-difference of 1 ppm. In the generated corresponding two-gradient-echo signal the bone regions were masked out before down-sampling to a "macroscopic" MR-like resolution, which mimics a non-UTE sequence and introduces effective R2'-relaxation. Mean single-R2* values and mean susceptibility from the $$$\ell_2$$$-regularized closed-form QSM solution inside the bone cubes were computed. The whole simulation was repeated with two different morphological image transformations of the binary bone mask: an isotropic erosion to introduce varying bone volume to total volume ratio (BV/TV) and a directed erosion with additional anisotropic transformation of the femur trabecular bone network. Finally, the slope of the regression line between voxel-wise χ- and R2*-values was determined for each type of erosion.
In vivo Measurements
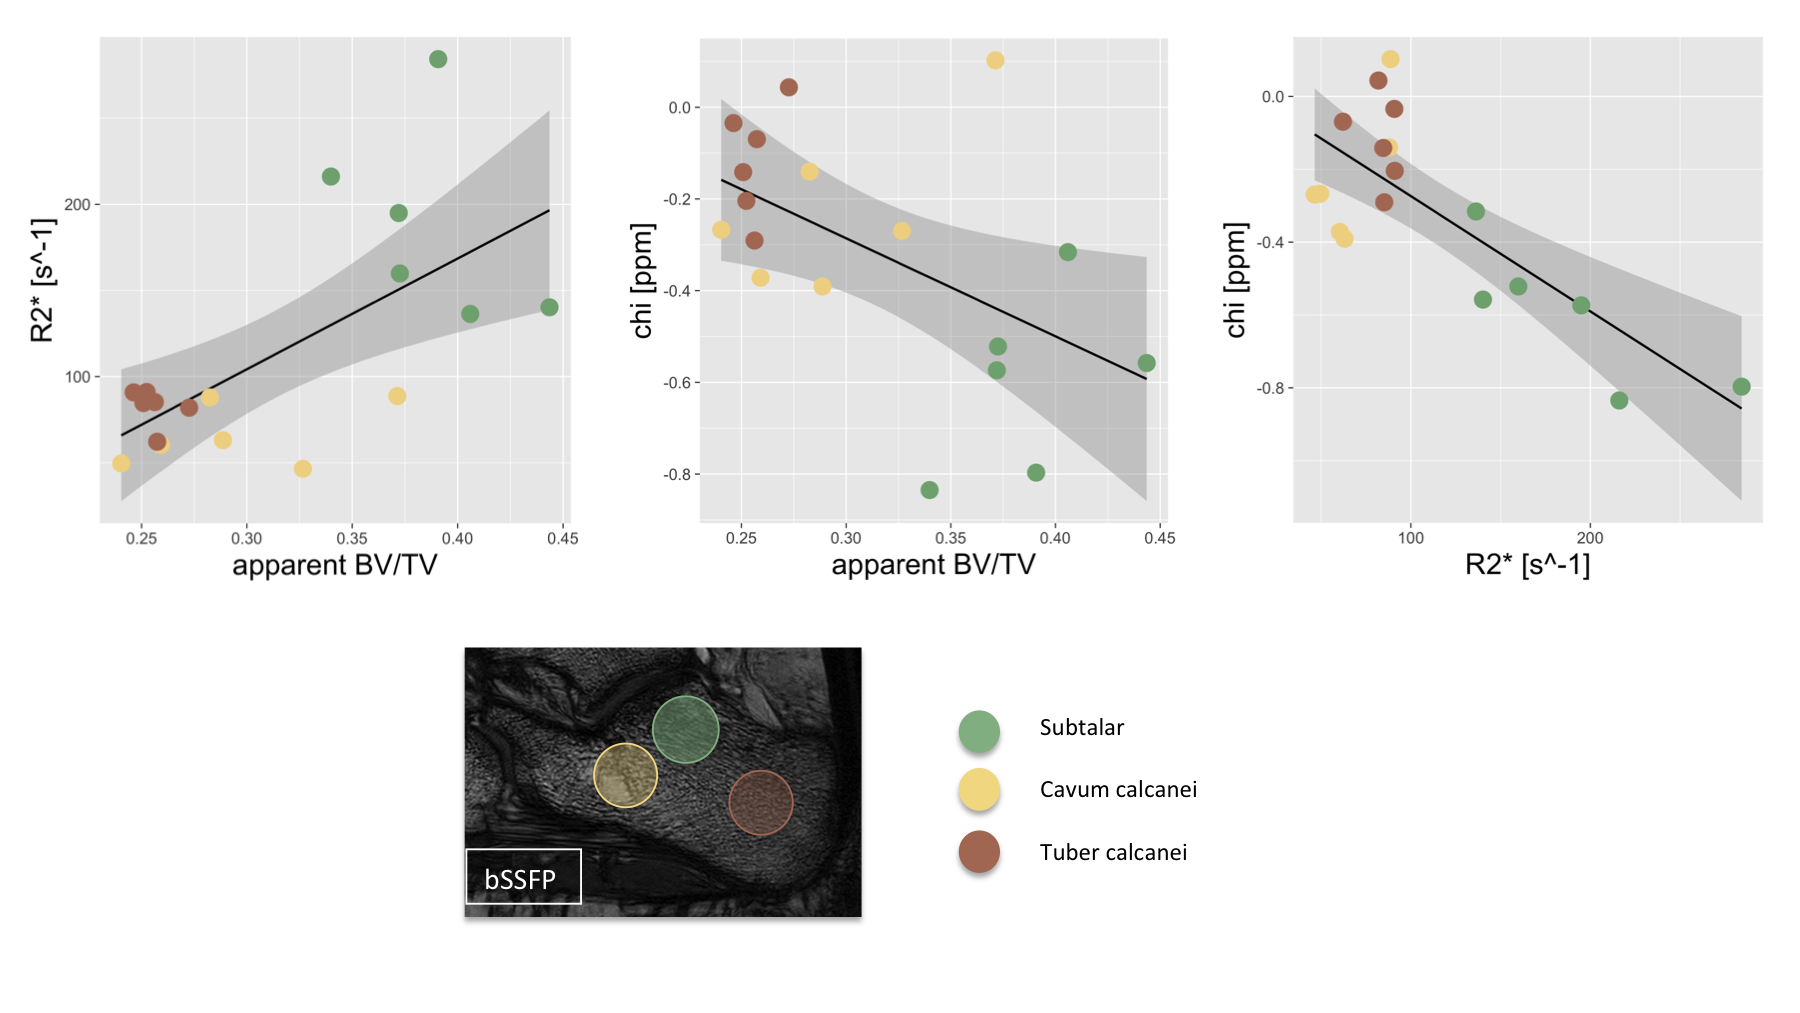
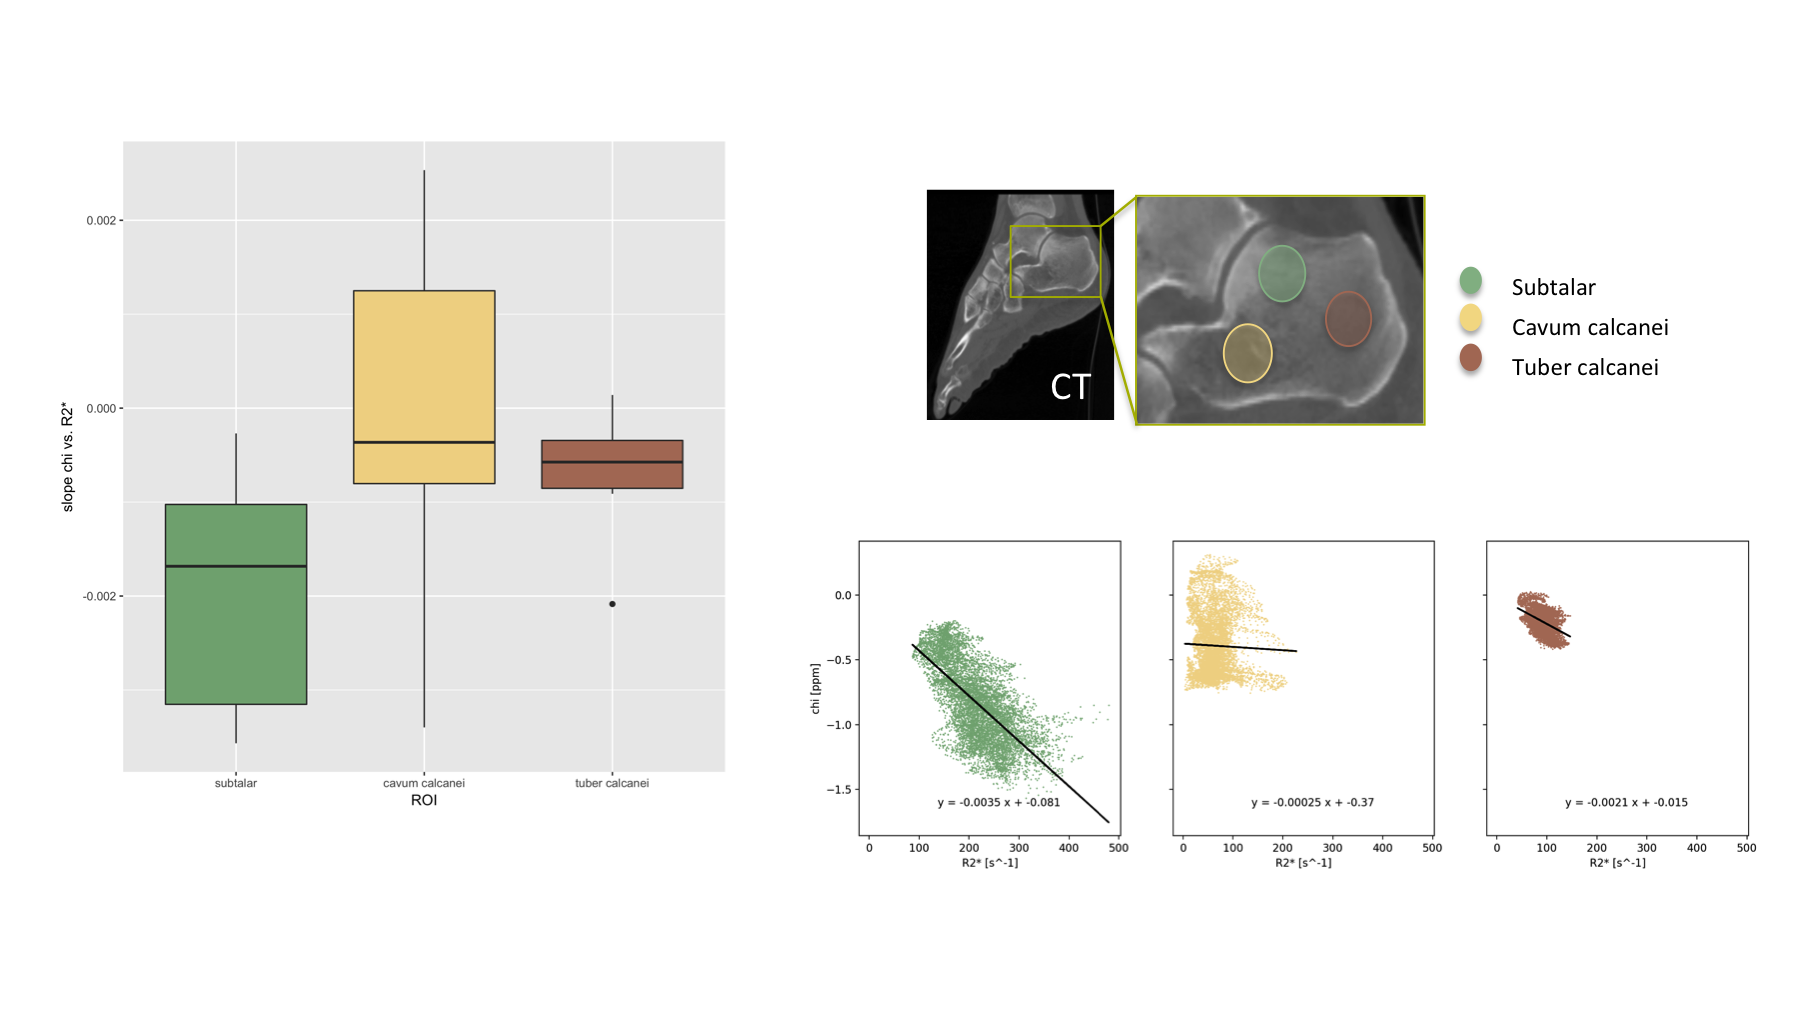
Figure 2 summarizes the invivo measurements. A time-interleaved gradient echo (TIMGRE) sequence [7] was performed to sagittally scan the ankle joint of six healthy volunteers, acquiring a total of 9 echoes in 3 acquisitions with an echo spacing of 0.7 ms and an isotropic resolution of 1.5 mm. Additionally a balanced-SSFP sequence with 2 phase cycles, TE = 3.4 ms and a voxel size of (0.3 × 0.3 × 0.9) mm3 was used to obtain an apparent BV/TV. Complex-based water–fat separation assuming a single R2* was used for field mapping followed by the Laplacian boundary value method for background field removal. $$$\ell_1$$$-MEDI yielded suscpetibility maps of the calcaneus in which three ROIs of known different trabecular density were defined (subtalar, cavum calcanei, tuber calcanei)[3], where the slope of voxel-wise χ versus R2* was determined.
Results
Figure 3 summarizes the simulation results showing how not only the BV/TV range decreases but also the slope of R2* versus BV/TV changes for varying microstructures of the trabeculae, whereas χ versus BV/TV remains equal. Therefore, the slope of χ versus R2* reflects the same change in trabecular microstructure. In vivo the mean R2* and χ versus BV/TV and against each other are plotted for the three different ROIs. The different trabecular density in the subtalar and the other two regions result in different R2* and χ as shown in Figure 4. As shown in Figure 5, trabecularization in the different ROIs is known to be differently organized based on physiological force load, which is reflected by different voxel-wise slopes of χ versus R2*.Discussion/Conclusion
In numerical simulations, morphological transformations reducing trabecular bone density and introducing anisotropy varied the slope of observed susceptibility versus R2* voxel values. Furthermore, the numerical simulations confirmed the sensitivity of R2* to intra-voxel dephasing whereas susceptibility only detected the amount of bone inside a voxel without depending on microstructure. Preliminary results of multi-parametric mapping in the calcaneus indicate that the combination of R2* and susceptibility can be sensitive to the microstructure of trabecular bone in vivo.
Acknowledgements
The present work was supported by the European Research Council (grant agreement No 677661 – ProFatMRI) and Philips Healthcare.References
[1] Wehrli, F. W., Song, H. K., Saha, P. K., & Wright, A. C., Quantitative mri for the assessment of bone structure and function, NMR in Biomedicine, 19(7), 731–764 (2006). http://dx.doi.org/10.1002/nbm.1066
[2] Song, H. K., Wehrli, F. W., & Ma, J., Field strength and angle dependence of trabecular bone marrow transverse relaxation in the calcaneus, Journal of Magnetic Resonance Imaging, 7(2), 382–388 (1997). http://dx.doi.org/10.1002/jmri.1880070222
[3] Wehrli, F. W., Hopkins, J. A., Hwang, S. N., Song, H. K., Snyder, P. J., & Haddad, J. G., Cross-sectional study of osteopenia with quantitative mr imaging and bone densitometry, Radiology, 217(2), 527–538 (2000). http://dx.doi.org/10.1148/radiology.217.2.r00nv20527
[4] Yablonskiy, D. A., Reinus, W. R., Stark, H., & Haacke, E. M., Quantitation of t2′ anisotropic effects on magnetic resonance bone mineral density measurement, Magnetic Resonance in Medicine, 37(2), 214–221 (1997). http://dx.doi.org/10.1002/mrm.1910370213
[5] Dimov, A. V., Liu, Z., Spincemaille, P., Prince, M. R., Du, J., & Wang, Y., Bone quantitative susceptibility mapping using a chemical species-specific r2* signal model with ultrashort and conventional echo data, Magnetic Resonance in Medicine, (), (2017). http://dx.doi.org/10.1002/mrm.26648
[6] Diefenbach et al, Simultaneous R2* and Quantitative Susceptibility Mapping of Trabecularized Yellow Bone Marrow: Initial Results in the Calcaneus, Proc. ISMRM 2017, #850
[7] Ruschke, S., Eggers, H., Kooijman, H., Diefenbach, M. N., Baum, T., Haase, A., Rummeny, E. J., Hu, H. H., Karampinos, D. C., Correction of phase errors in quantitative water-fat imaging using a monopolar time-interleaved multi-echo gradient echo sequence, Magnetic Resonance in Medicine, nil(nil), (2016). http://dx.doi.org/10.1002/mrm.26485
[8] Taege et al., Assessing the cellular distribution of iron in deep gray
matter based on R2* and Quantitative Susceptibility Mapping (QSM) -
Application to healthy controls and patients with Multiple Sclerosis
(MS), Proc. ISMRM 2017, #1207
Figures
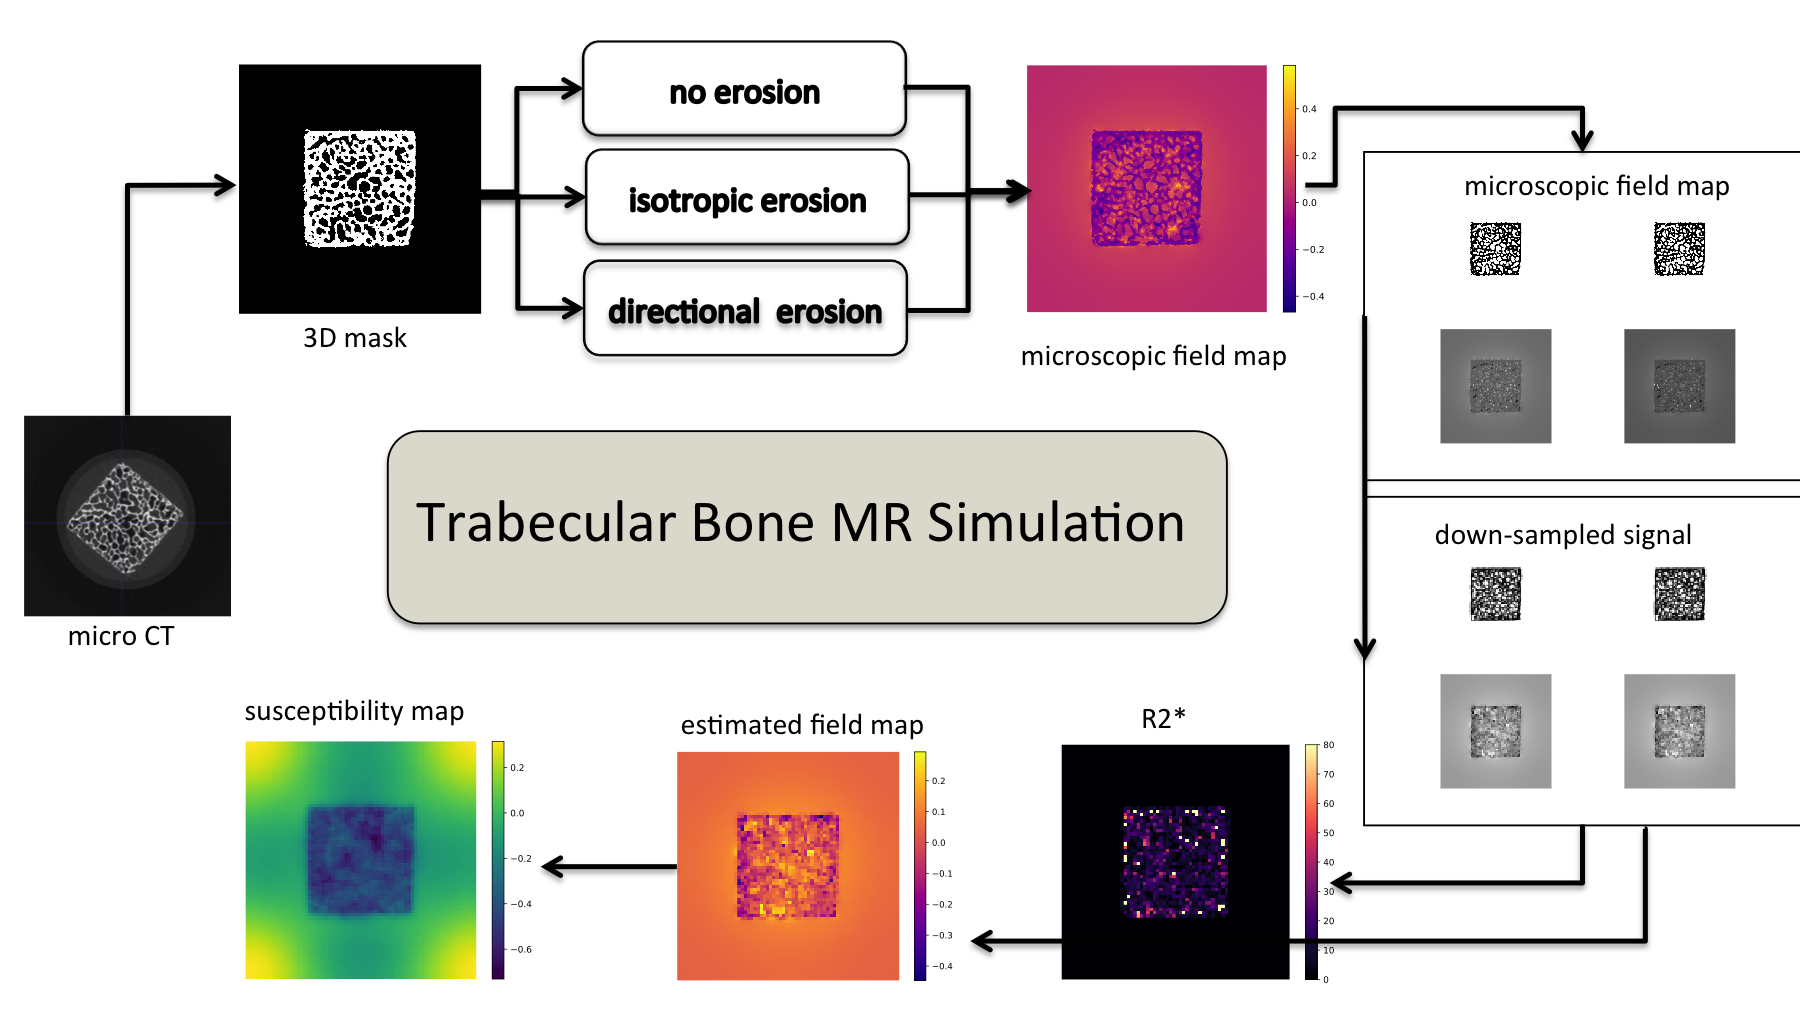
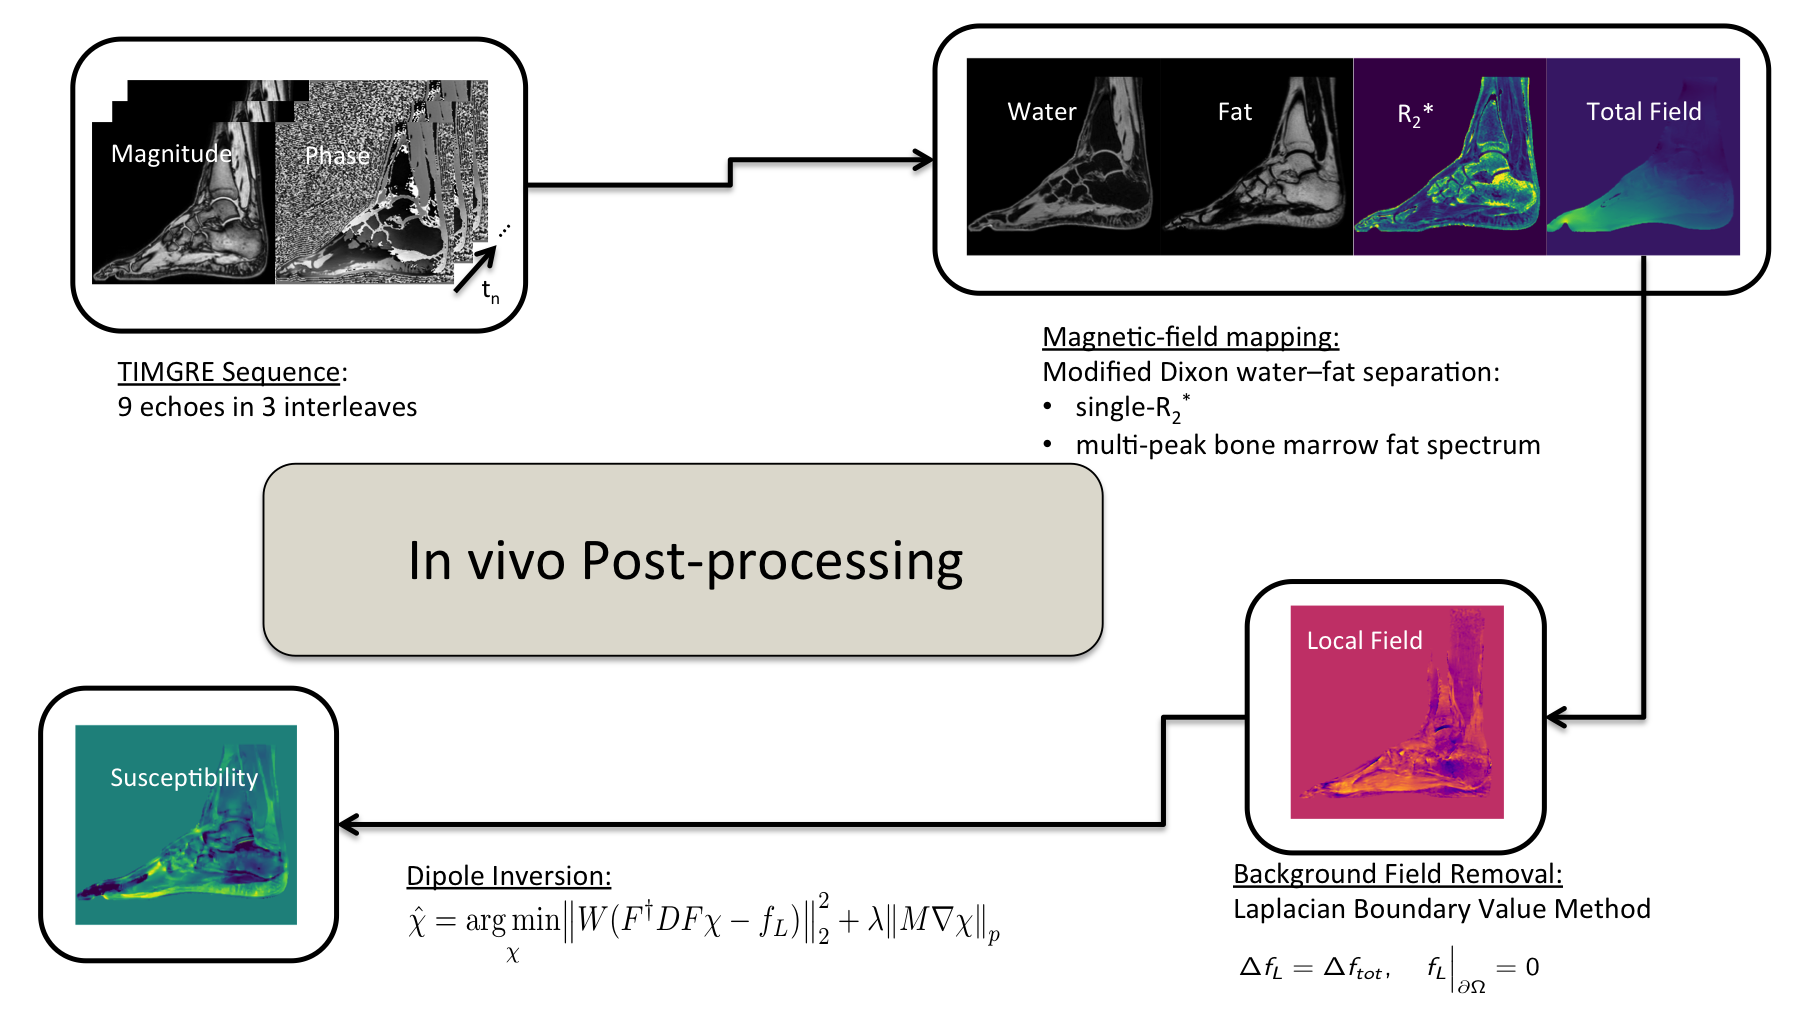
Figure 2: Flow chart illustrating in vivo quantitative susceptibility mapping post-processing. With time-interleaved multi-gradient echo data, field mapping is performed with T2*-IDEAL followed by LBV for background field removal. l1-MEDI yielded susceptibility maps.
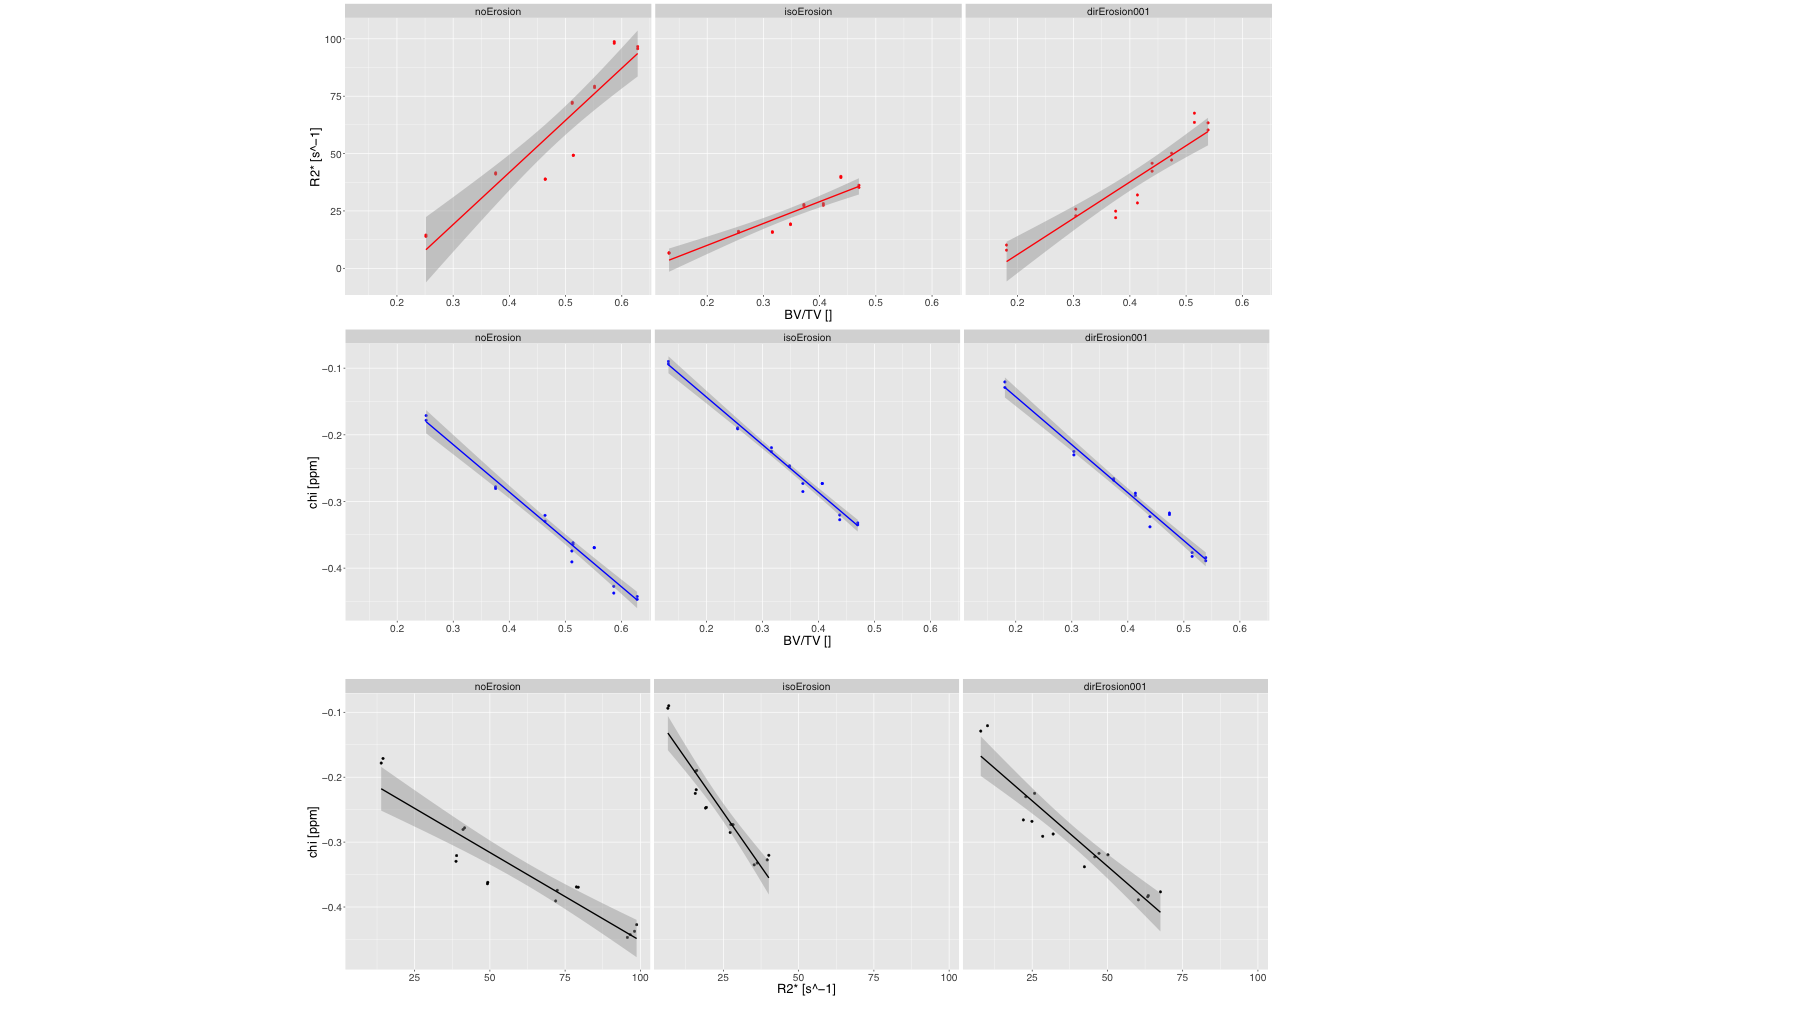
Figure 3: Correlation plots of mean parameters inside ROIs in simulated trabecular bone cube R2* and QSM maps. Top row: R2* vs BV/TV. Middle row: χ versus BV/TV. Bottom row: χ versus R2*.