0529
Neonate functional brain networks and distinctive intra-network connectivity1Department of Radiology, Children's Hospital of Philadelphia, Philadelphia, PA, United States, 2Department of Radiology, Perelman School of Medicine, University of Pennsylvania, Philadelphia, PA, United States, 3Department of Bioengineering, School of Engineering and Applied Science, University of Pennsylvania, Philadelphia, PA, United States, 4Department of Biomedical Engineering, School of Medicine, Tsinghua University, Beijing, China
Synopsis
Little is known on the network organization in the neonatal brain. Here, we used a novel parcellation method, called regularized-Ncut (RNcut), to parcellate the neonate brain into functional networks with resting-state fMRI. RNcut effectively delineates the neonatal functional networks including the primary sensorimotor and higher-order networks. Based on RNcut parcellation of functional networks, intra-network connectivity was quantified. Distinctive intra-network connectivity was revealed for the first time. We found that the primary sensorimotor network has the highest intra-network connectivity while
Target audience
Pediatric neuroradiologists and neurologists.Purpose
Little is known about network organization in the neonatal brain. In this study, we aimed to reveal neonate functional networks using a regularized-Ncut (RNcut) parcellation method based on resting-state fMRI (rs-fMRI). The RNcut was based on the normalized cut algorithm integrated with a smoothing term and a small patches removal term. We first established RNcut as an effective and efficient parcellation method of choice for delineating neonate brain functional networks. Based on RNcut parcellation of functional networks, intra-network connectivity was quantified.Methods
Subjects and data acquisition: 19 term neonates were recruited (aged from 37PMW to 41.7 PMW). The data were acquired on a Philips 3T Achieva MR scanner. The neonates were scanned during their natural sleep without sedation. For rs-fMRI, a total of 210 whole brain EPI volumes were acquired using the following parameters: TR = 1500 ms, TE = 27 ms, in-plane imaging resolution = 2.4 ×2.4 mm2, in-plane field of view (FOV) =168 × 168 mm2, slice thickness = 3 mm with no gap, slice number = 30. Rs-fMRI preprocessing: The rs-fMRI data of 19 term infants was used after discarding the subjects with head motions exceeding the set threshold. The individual T2-weighted images were then nonlinearly registered to a 37-PMW brain template [1]. A custom-made template was generated through averaging the resultant normalized T2-weighted images of all subjects. Individual T2-weighted images were nonlinearly registered to the custom-made template. Subsequently, we did the spatial smoothing, detrending, temporal filtering, and regression of several nuisance variables. Parcellation of the neonatal functional networks: After the rs-fMRI preprocessing, the RNcut was used to parcellate the neonate brain to yield 17 functional networks. We also tested three other parcellation methods including ICA [2], NNMF [3] and Ncut [4] to parcellate the cerebral cortex of the neonate brain. To evaluate the performance of different methods, we used Silhouette Index (SI) [5] and number of patches in each network. Intra-network connectivity estimation: Based on the parcellated functional networks generated with RNcut, the intra-network connectivity of each voxel was calculated as the averaged Pearson coefficient of the correlation between this voxel and all other voxels in the same network. Bar plots of intra-network connectivity measurements were also generated for each parcellated network.Results
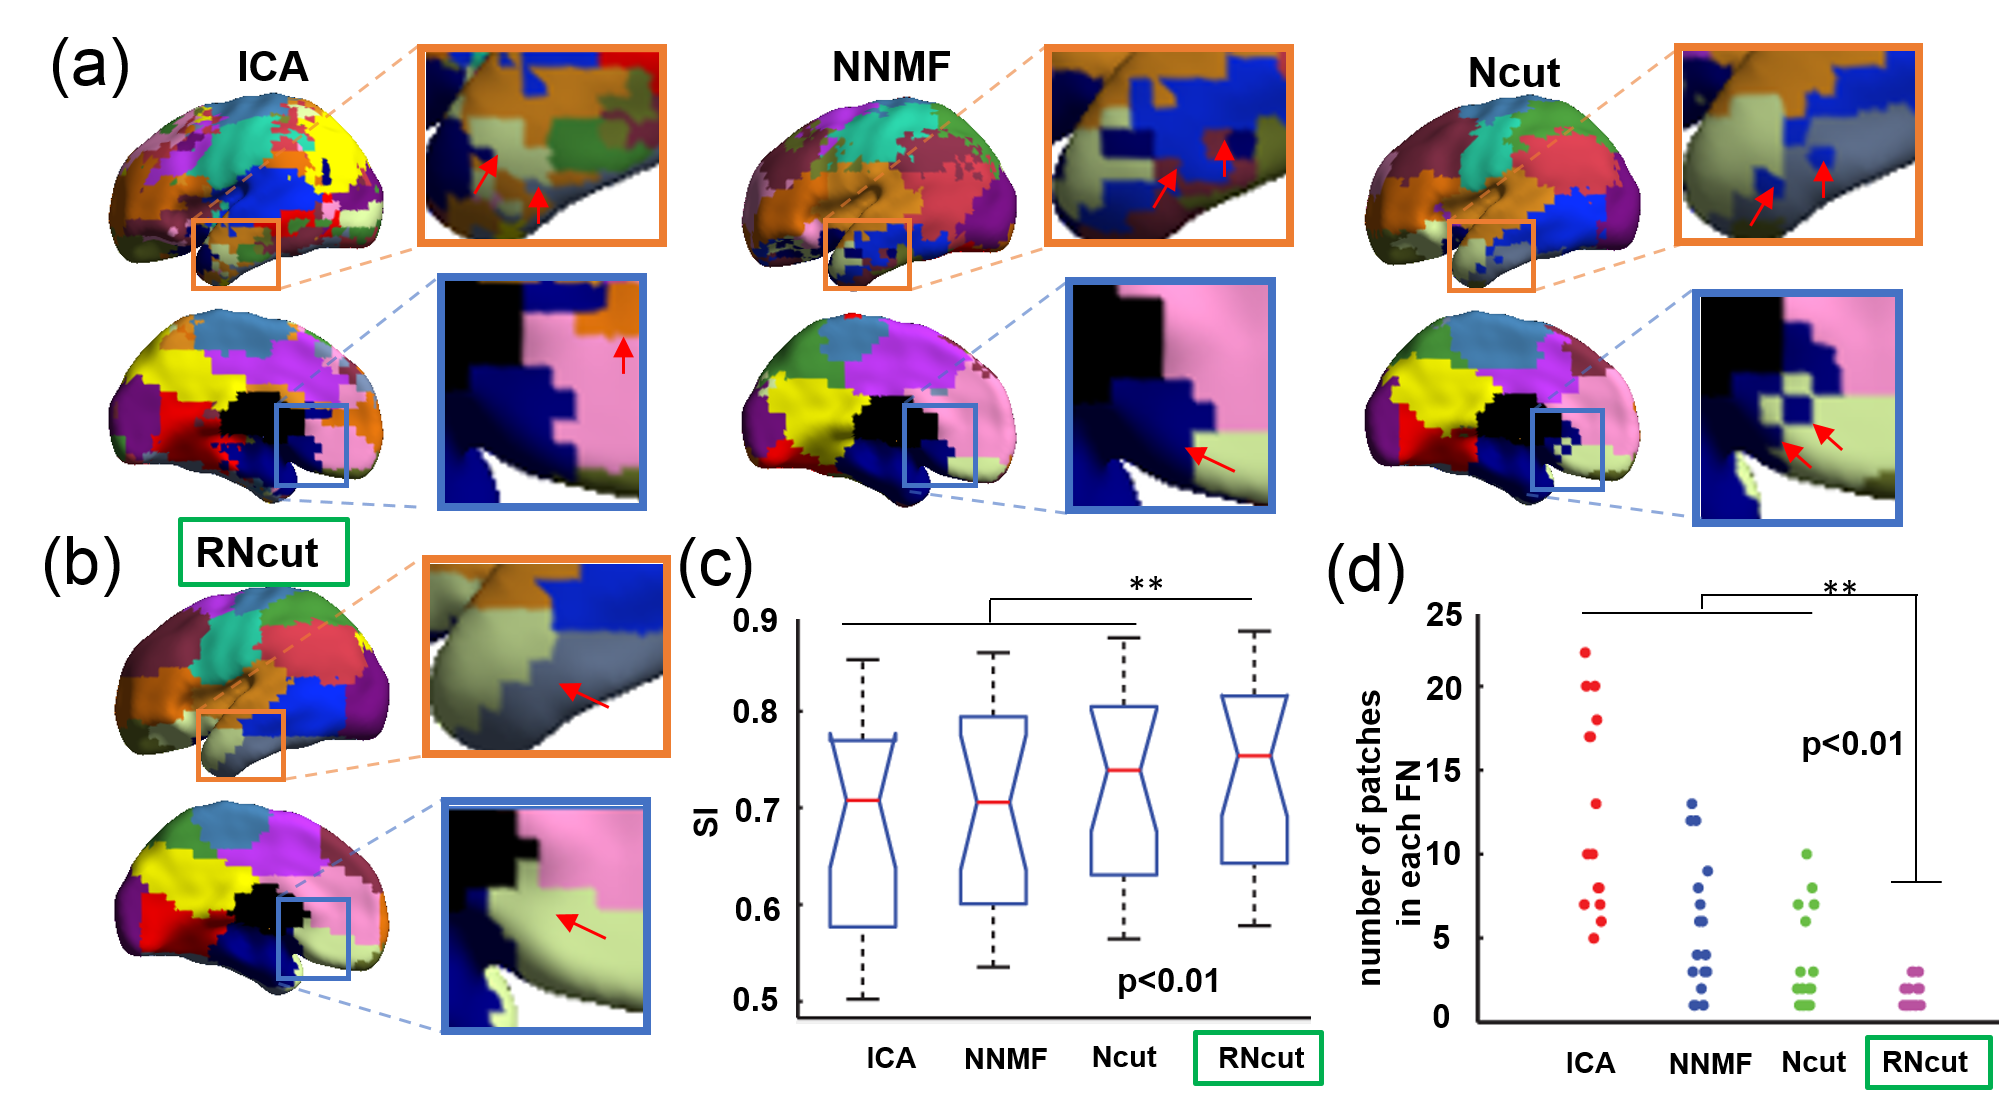
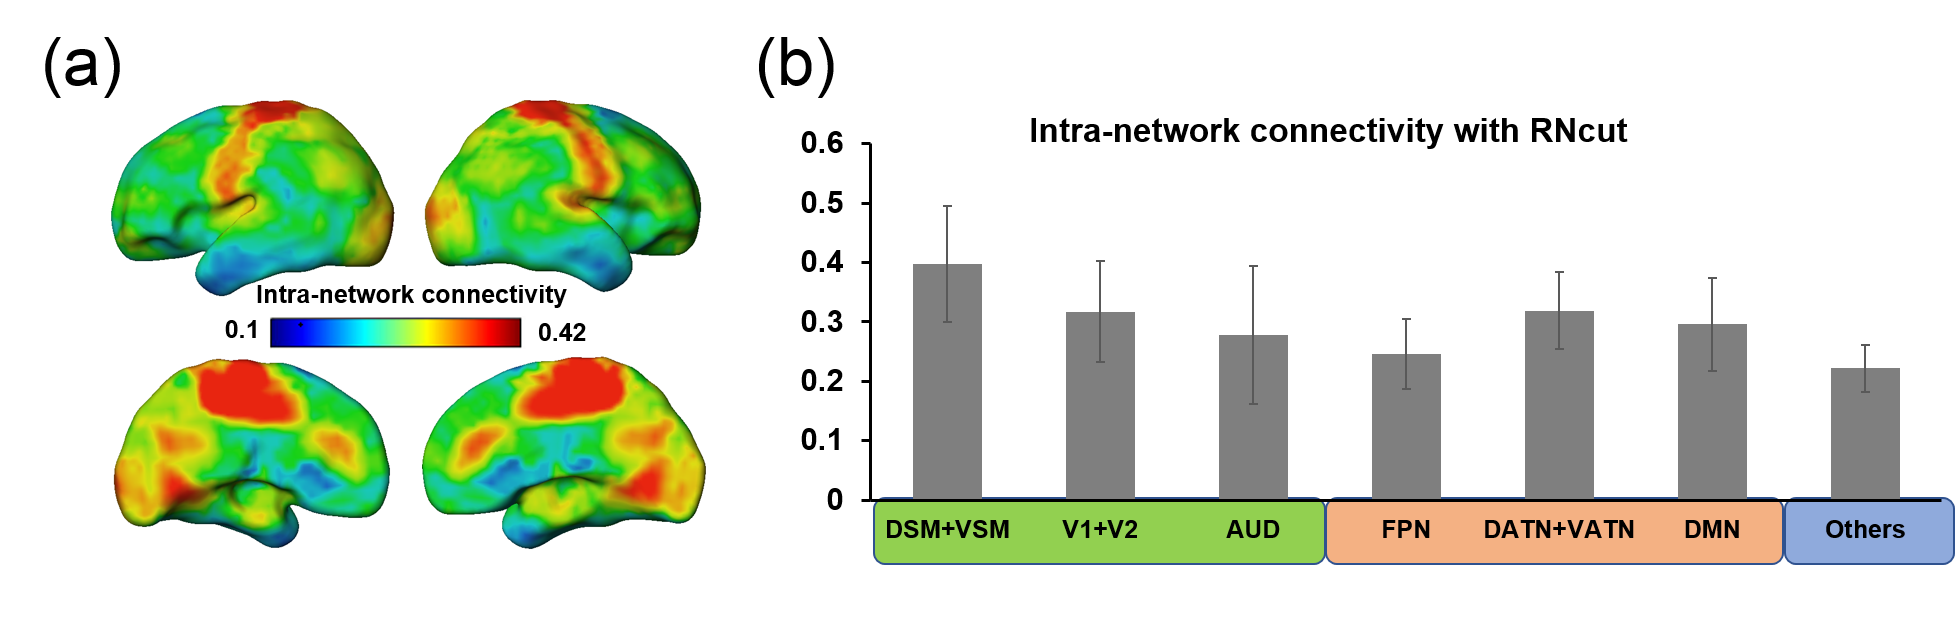
Fig 1a and Fig 1b show the parcellated 17 networks using competing methods ICA, NNMF, and Ncut, and RNcut, respectively. It can be observed that several isolated noisy patches exist in the parcellated networks generated with ICA, NNMF and Ncut methods (Fig 1a, marked by red arrows). The functional networks generated with RNcut include much fewer noisy patches (Fig 1b). Fig 1c shows that the highest SI value was achieved with RNcut. Fig 1d demonstrates that a smaller number of networks were identified by RNcut, indicating that less small patches were created. The intra-network connectivity map generated with RNct is demonstrated in Fig 2a. Fig 2b shows the measured intra-network connectivity in different networks generated with RNcut. Higher intra-network connectivity was found in primary sensorimotor network. Relatively high intra-network connectivity was found in the dorsal attention network (DATN), ventral attention network (VATN) and default mode network (DMN). In contrast, lower intra-network connectivity was found in fronto-parietal network (FPN).Discussion and Conclusions
We established a novel parcellation method, RNcut, which performed better than other widely used parcellation methods for revealing the neonate brain functional networks. The experimental results demonstrated that RNcut yielded the functional networks with higher SI value and less noisy patches. Based on parcellated functional networks generated with RNcut, distinctive intra-network connectivity of the neonate brain was revealed for the first time. The highest intra-network connectivity was found in the primary sensorimotor network while lowest intra-network connectivity was found in higher-order fronto-parietal network. The distinctive intra-network connectivity pattern underlies heterogeneous emergence of brain functional systems during early development.Acknowledgements
This study is funded by NIH MH092535, MH092535-S1, HD086984 and EB022573.References
[1] Serag A, et al., 2012. Construction of a consistent high-definition spatio-temporal atlas of the developing brain using adaptive kernel regression. Neuroimage, 59(3), 2255-2265.
[2] Calhoun VD, et al.,2001. A method for making group inferences from functional MRI data using independent component analysis. Human brain mapping,14(3),140-151.
[3] Anderson A, et al., 2014. Non-negative matrix factorization of multimodal MRI, fMRI and phenotypic data reveals differential changes in default mode subnetworks in ADHD. NeuroImage, 102(1), 207-219.
[4] Shi J., et al., 2000. Normalized cuts and image segmentation. IEEE Transactions on pattern analysis and machine intelligence, 22(8), 888-905.
[5] Craddock RC, et al., 2012. A whole brain fMRI atlas generated via spatially constrained spectral clustering. Human Brain Mapping, 33(8), 1914-1928.
Figures