0528
Profiling myelin maturation with quantitative susceptibility mapping (QSM) in pediatric brainsLijia Zhang1 and Allen Song1
1Brain Imaging and Analysis Center, Duke University, Durham, NC, United States
Synopsis
Quantitative susceptibility mapping (QSM) has been increasingly used to access brain development, especially white matter myelination. In this study, diffusion tensor imaging (DTI) has been used to delineate the corpus callosum in the pediatric brains, followed by tract-based QSM analysis to accurately derive the baseline susceptibility across subjects. The baseline susceptibility is then used to evaluate white matter and myelin development.
Target Audience
Clinicians and researchers interested in myelin development in human brainsPurpose
Quantitative susceptibility mapping (QSM) has seen increased utility in assessing brain development. Leveraging its unique sensitivity to myelination, the purpose of this study is to evaluate whether QSM has the ability to assess the age-related myelination effect during brain development in pediatric brains. In particular, diffusion tensor imaging (DTI) was first used to delineate major fiber bundles (e.g. corpus callosum), followed by QSM analysis to accurately derive baseline susceptibility measures ($$$\chi_0$$$) across brains in children. The baseline susceptibility measures were then compared across subjects to evaluate myelin maturation during brain development.Methods
DTI data were obtained (25 directions, b =1000 + 3b0, TE=70.5 ms, TR=12000 ms, 2 mm3 isotropic resolution). QSM images were acquired and derived from a 3D multi-echo FSPGR sequence (TR=50 ms, flip angle = 20 degrees, 1 mm3 isotropic resolution, FOV = 192*192*120 mm3). The T1, DTI and QSM were coregistered and the corpus callosum ROI was extracted by warping the JHU-DTI-MNI “Eve” atlas1 into each subject’s DTI space via Large Deformation Diffeomorphic Metric Mapping (LDDMM)2. Aided by DTI and the principal eigenvector of the diffusion tensor, the angle-dependence of magnetic susceptibility measures along the corpus callosum was assessed using equation $$$\chi=\chi_a\cdot sin^2(\alpha)+\chi_0$$$ [Eqn. 1], and magnetic susceptibility anisotropy ($$$\chi_a$$$) and baseline susceptibility ($$$\chi_0$$$) quantified3-4. To evaluate QSM measures across the brain in different age groups, analyses were carried out in seven pediatric patients (ages 1-7). To profile the asymmetric brain development and myelination at different ages, the corpus callosum was further parcellated into three regions, genu, midbody, and splenium5. Statistical analyses were performed using Wilcoxon signed rank test.Results
Shown in Fig. 1 is an example of DTI parcellation of corpus callosum, with angle-dependent QSM overlaid onto the fibers. The apparent magnetic susceptibility ($$$\chi$$$) in all voxels along the fiber bundle was then fitted using Eqn. 1, using the available fiber angles derived from the DTI, as shown in Fig. 2. The baseline magnetic susceptibility was then derived for various segments of the corpus callosum. The posterior region of the corpus callosum was found to be more diamagnetic (i.e. more myelination) than the more anterior regions (genu and midbody) (Fig 3). Specifically, the splenium is more diamagnetic than the midbody (p=0.02) and the midbody is more diamagnetic than the genu (p=0.04), consistent with the general knowledge that posterior brain is myelinated earlier than the anterior part in pediatric subjects. Further, the anterior-posterior difference in susceptibility of corpus callosum was analyzed across age to investigate the age effect. It was found that this difference peaks at 2-3 years of age, suggesting the largest difference in myelin growth between the anterior and posterior brain regions, which coincides with the growth spurt for the cerebral cortex at age 2-36.Discussion
We have developed a DTI-guided QSM method that can accurately determine the baseline magnetic susceptibility in major fiber tracts, which can then be used to evaluate white matter myelin maturation during brain development. It is anticipated that this quantitative technique may find broad utility to help characterize white matter development and to assess various white-matter related brain disorders.Acknowledgements
The study is supported in part by NIH grant R01 NS 075017.References
- Oishi, K et al. Atlas-based whole brain white matter analysis using large deformation diffeomorphic metric mapping: application to normal elderly and Alzheimer's disease participants. Neuroimage. 2009; 46:486-499.
- Faria AV et al. Quantitative analysis of brain pathology based on MRI and brain atlases-applications for cerebral palsy. Neuroimage. 2011; 54:1854-61.
- Li, Wei, et al. Magnetic susceptibility anisotropy of human brain in vivo and its molecular underpinnings. Neuroimage 59.3 (2012): 2088-2097.
- Argyridis, Ioannis, et al. Quantitative magnetic susceptibility of the developing mouse brain reveals microstructural changes in the white matter. Neuroimage 88 (2014): 134-142.
- Hofer, Sabine, et al. Single-shot T1 mapping of the corpus callosum: a rapid characterization of fiber bundle anatomy. Frontiers in neuroanatomy 9 (2015).
- Matsuzawa, Junko, et al. Age-related volumetric changes of brain gray and white matter in healthy infants and children. Cerebral cortex 11.4 (2001): 335-342.
Figures
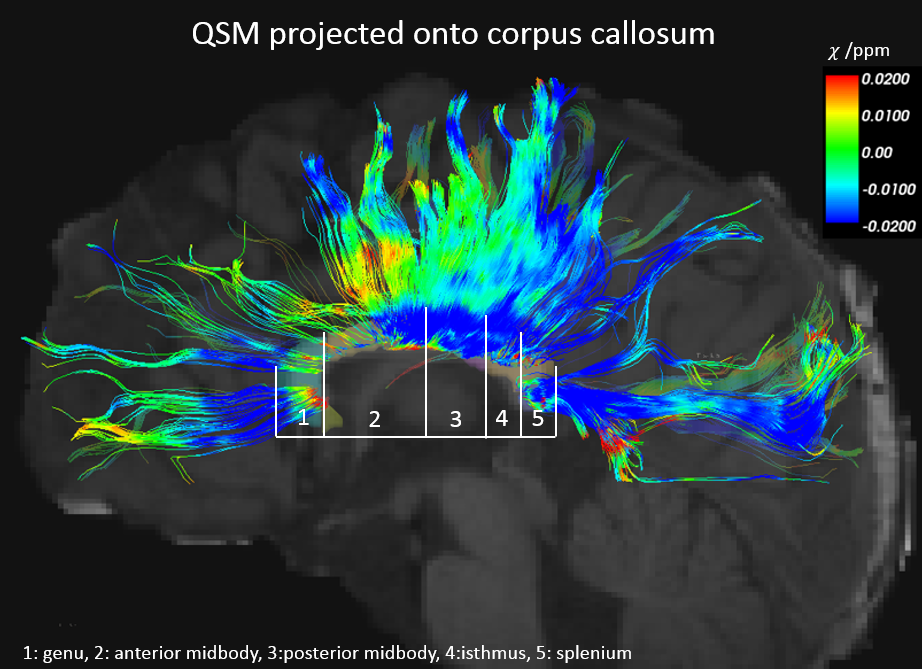
Fig 1. Corpus
callosum parcellation and angle-dependent susceptibility overlayed onto the
fibers.

Fig 2. Track-based MSA fitting results
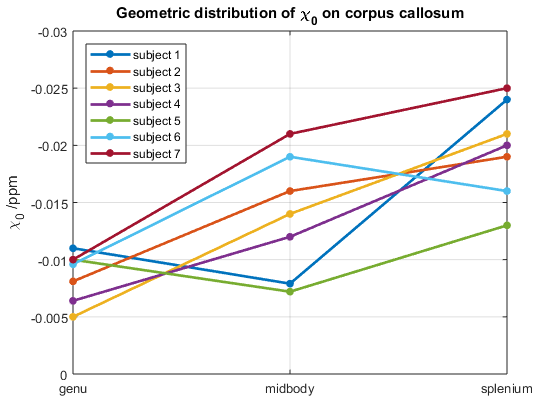
Fig 3. $$$\chi_0$$$ geometric
distribution on corpus callosum
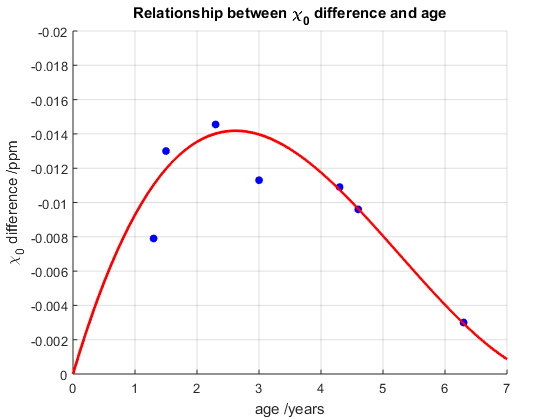
Fig 4. Posterior-anterior $$$\chi_0$$$ difference v.s. age