0527
Patterns of subcortical gray matter and white matter myelination from 4.5 months to 1 year-old: an observational study comparing the whole brain T1w/T2w ratio myelin mapping technique and an autopsy infant myelin-staining study1Developmental Imaging, Murdoch Children's Research Institute, Melbourne, Australia, 2Neuroscience Research, Murdoch Children's Research Institute, Melbourne, Australia, 3Neurosurgery, The Royal Children's Hospital, Melbourne, Australia, 4Medical Imaging, The Royal Children's Hospital, Melbourne, Australia, 5Paediatrics, University of Melbourne, Melbourne, Australia, 6Radiology, University of Melbourne, Melbourne, Australia, 7Epilepsy, Florey Institute of Neuroscience and Mental Health, Melbourne, Australia, 8Neurology, The Royal Children's Hospital, Melbourne, Australia, 9Victorian Infant Brain Study (VIBeS), Murdoch Children's Research Institute, Melbourne, Australia, 10Medicine, Monash University, Melbourne, Australia
Synopsis
The whole brain T1w/T2w ratio technique enables in vivo quantitative myelin mapping using clinically acquired MRI sequences, which is potentially useful when investigating developmental myelination trajectories. Post-mortem infant myelin-staining studies provide useful references. This study characterizes myelination trajectories of 27 subcortical brain regions in typically developing 4.5 months to 1 year-old children using the T1w/T2w ratio technique and compared the patterns with those demonstrated by an autopsy infant myelin-staining study. Similar myelination trajectory patterns were observed in the structures that commenced myelination before birth. This highlights the T1w/T2w ratio as potential myelin imaging biomarker for these structures during this period.
Introduction
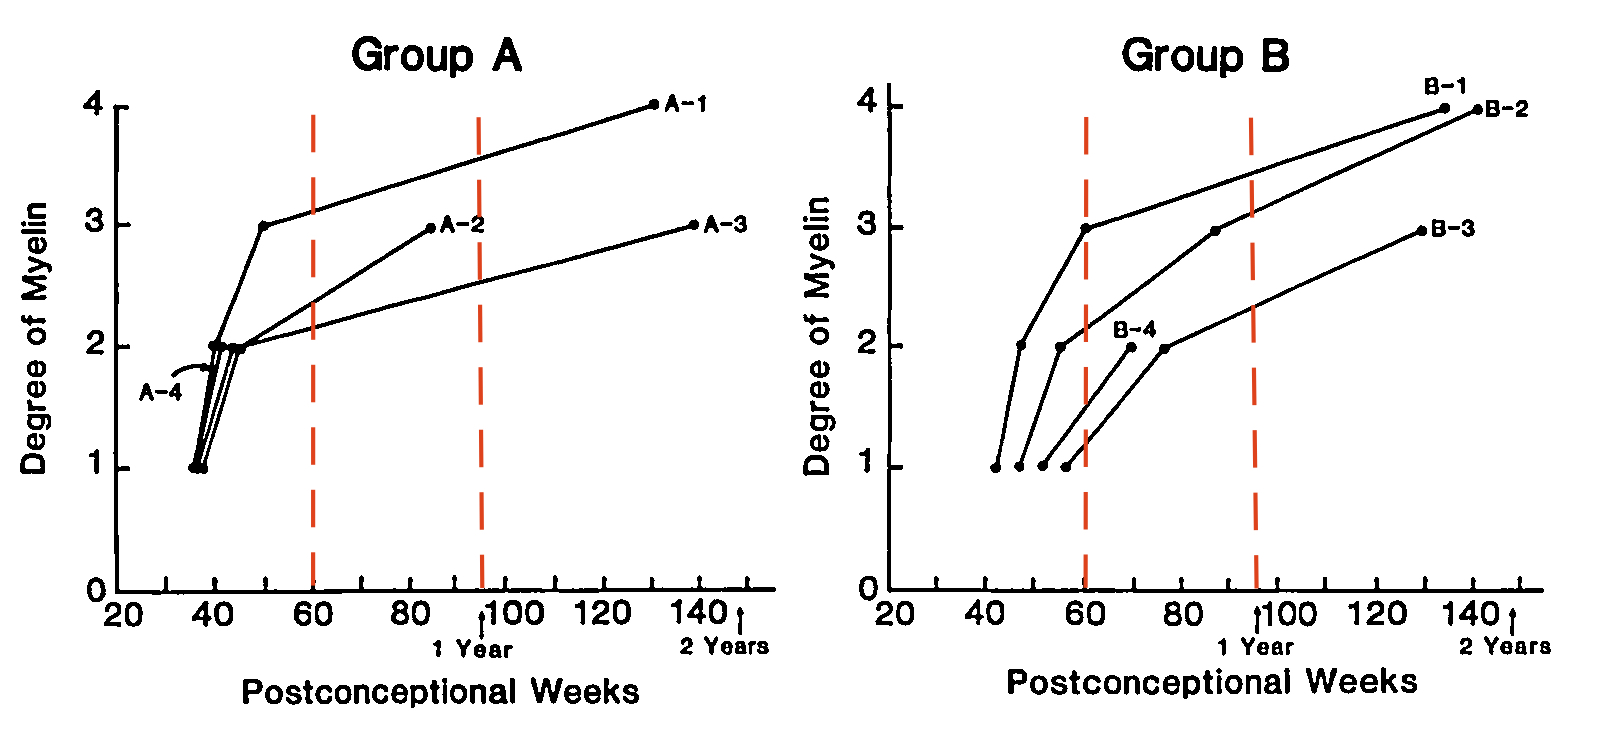
Detailed knowledge about normal brain myelination and its trajectory is critical for understanding both typical and atypical brain development. Post-mortem infant myelin-staining studies demonstrate variability in the timing of myelination within and across axonal systems during early development (Figure 1).1-3 Magnetic resonance imaging (MRI) is the imaging method of choice for in vivo, non-invasive assessment of myelin development. The recently proposed whole brain T1- and T2-weighted (T1w/T2w) ratio technique enables in vivo quantitative myelin mapping using clinically acquired MRI sequences, making it potentially well suited for clinical use.4, 5 This MRI technique has not yet been applied to investigation developmental myelination trajectories. We aim to characterize myelination trajectories in typically developing 4.5 months to 1-year old children using the T1w/T2w ratio technique. We aim to reproduce patterns of different subcortical gray (GM) and white matter (WM) myelination trajectories as demonstrated by an autopsy infant myelin-staining study.2Methods
Participants and MRI data: A subset of the public accessible T1w and T2w age-specific group averaged data from the Neurodevelopmental MRI database were used to carry out the study analysis (http://jerlab.psych.sc.edu/NeurodevelopmentalMRIDatabase/) (49 single-center, cross-sectional, non-sedating MRI scans from 49 typically developing participants; between 4.5 month to 1 year-old; 24 males). All infants were screened for perinatal factors that may affect brain development, and scanned within 30 days after the nominal age.
Autopsy data: One hundred and sixty-two infants with diverse diseases were autopsied from 1972 to 1984 at Boston Children’s Hospital. Myelination was assessed by Brody et al. in 62 subcortical WM and GM regions. The intensity of myelination was graded on an ordinal scale of 0-4 using the inferior cerebellar peduncle as an internal standard. The 62 anatomical sites were sorted into groups with similar time-related myelin patterns, based upon the presence (subgroups A1-4) or absence (subgroups B1-4) of myelin at birth (Figure 1).2
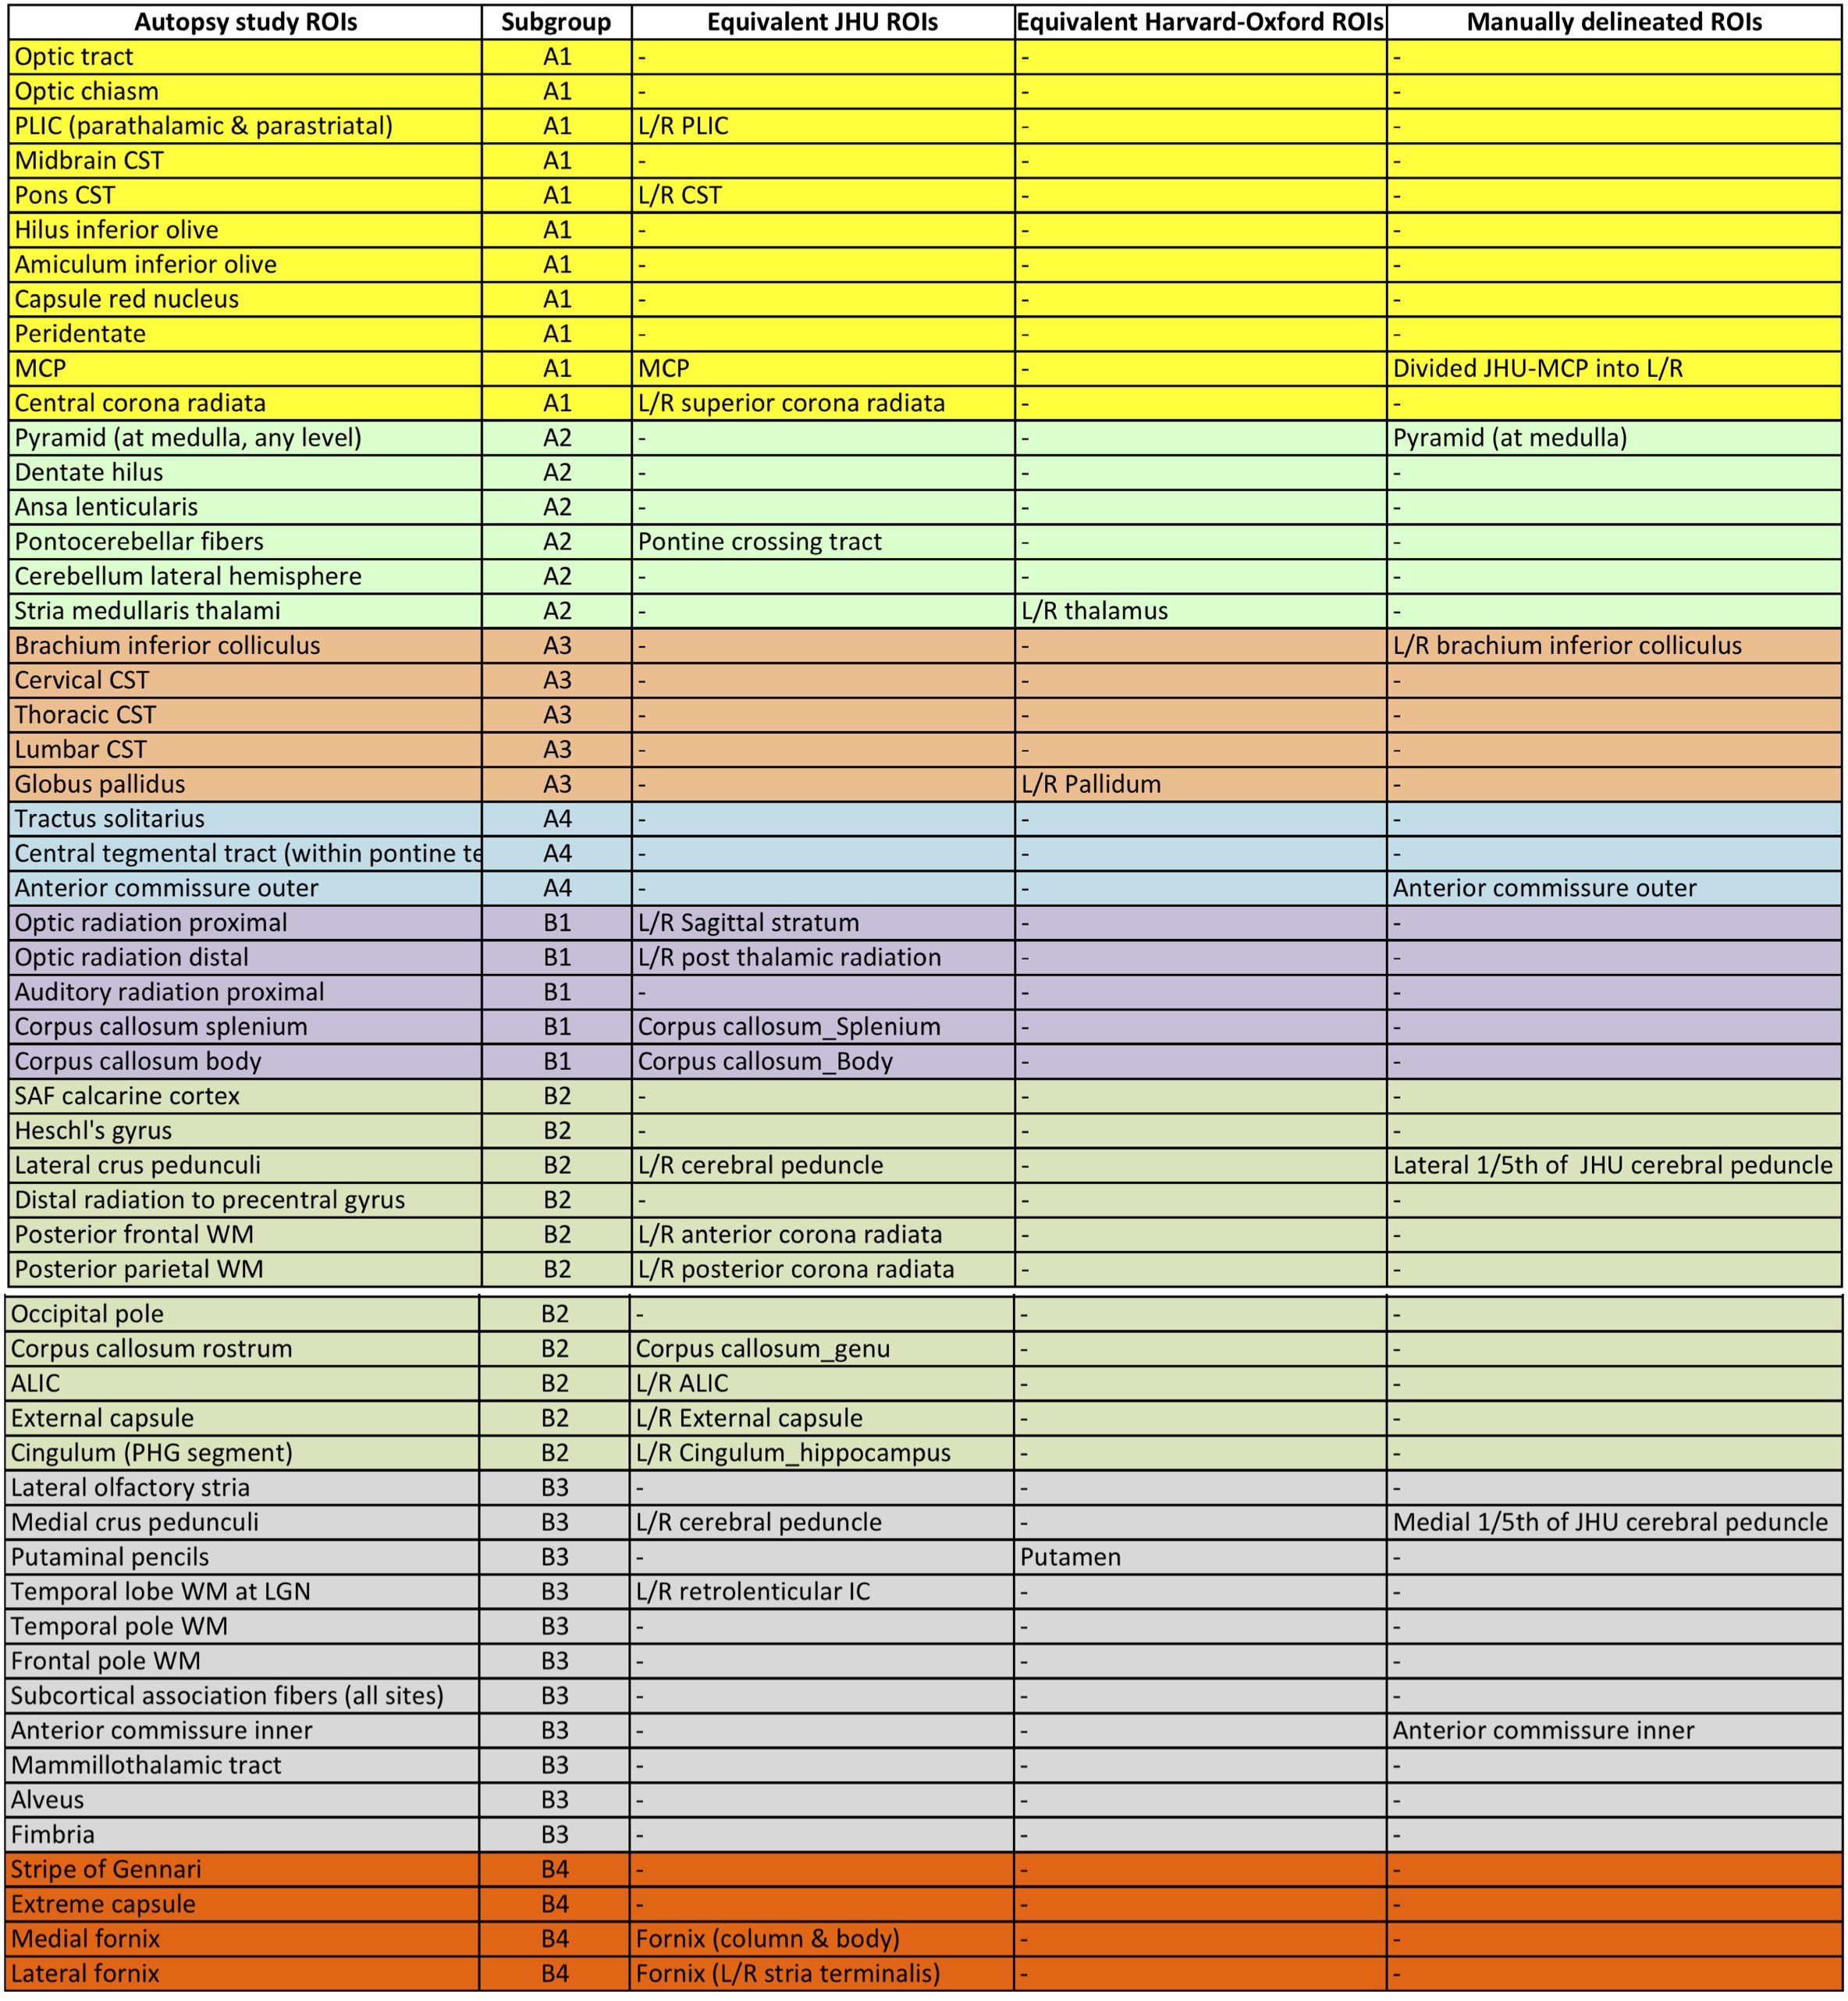
MRI data processing: The T1w/T2w ratio maps were calculated using bias-corrected T1w and T2w images. The ratio map intensities were calibrated against intensities from two extra-cerebral structures- CSF and the scalp fat layer- segmented from native space. This permitted standardization of intensity histogram, allowing for across subject comparisons. The ratio maps were non-linearly warped into standard template space. The anatomical ROIs from the Johns Hopkins University (JHU ICBM-DTI-81) and Harvard-Oxford subcortical templates equivalent to those described in the autopsy study were selected and sub-grouped accordingly. Seven additional ROIs were manually delineated, giving a total of 27 regions (Figure 2).
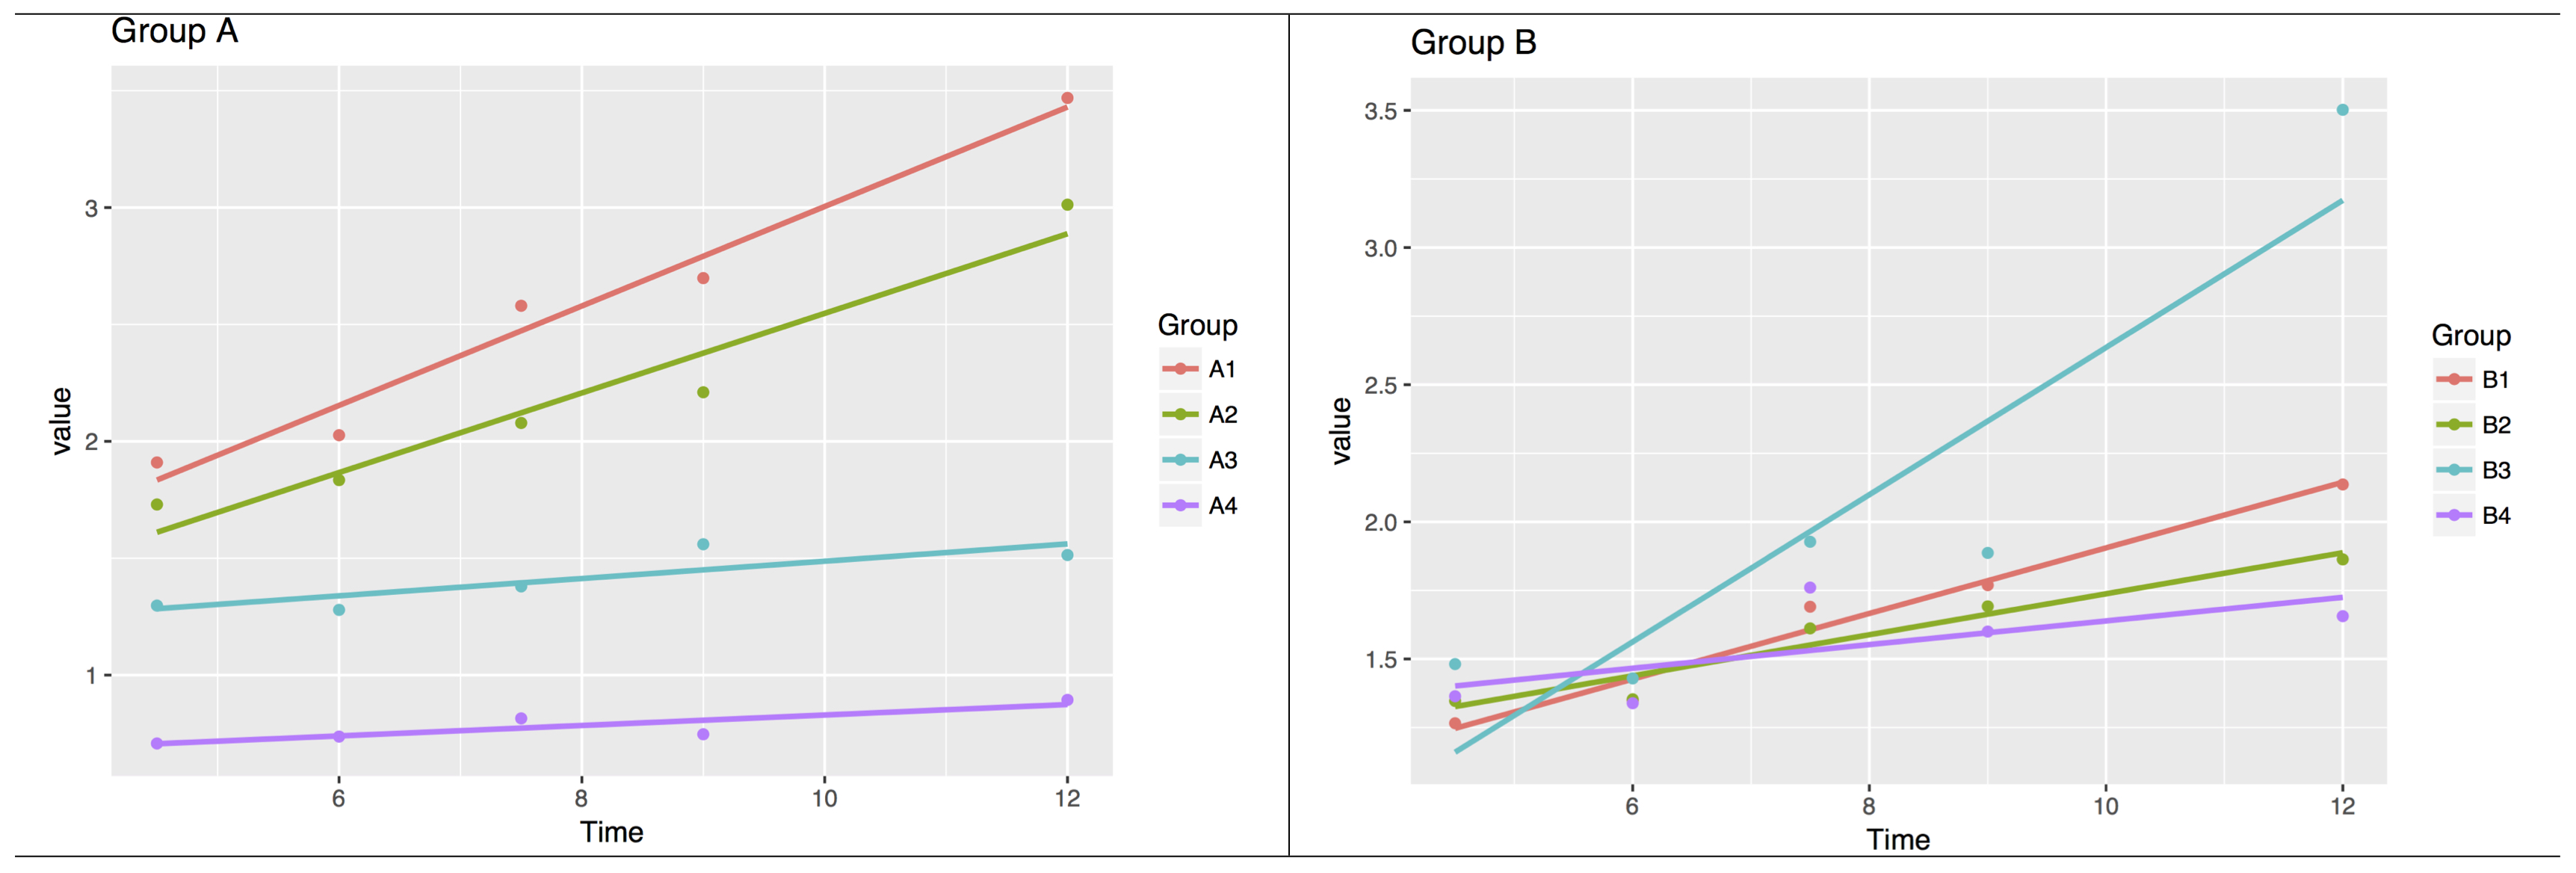
Analysis: The T1w/T2w ratio means from all ROIs within each subgroup were calculated and used to plot the myelin trajectory over time. The plots were visually compared with those from the autopsy study. Linear regression with contribution weighted by region area was used to test whether myelination was increasing with time.
Results
Figure 3 summarizes the main study findings. All subgroups demonstrated increased T1w/T2w ratio over time (p<0.00001 for subgroups A1-4; p<0.01 for subgroups B1-4). Compared with the autopsy study, we observed similar myelination trajectories in the subgroups A1-3, but not in the subgroups B1-4. Comparison for subgroup A4 was not possible given its trajectory could not be determined in the autopsy study during this period.Discussion
We attributed the variability observed in the subgroups B1-4 trajectories to data quality (i.e. group-averaged data), the size and anatomical specificity of the ROIs and compatibility against those defined in the autopsy studies. The autopsy study findings represent population medians and lack variance information. Future studies addressing these potential data and processing shortcomings are required to further substantiate the imaging and autopsy comparisons.
The whole brain T1w/T2w ratio technique has the advantage of utilizing clinically acquired MRI sequences. Our study highlights the potential of its application to assess myelination status of an individual and establish population-based normative myelination standards during this age range.
Conclusion
The whole brain T1w/T2w ratio technique produces plausible imaging biomarkers of maturing myelin in those subcortical WM and GM structures commencing myelination before birth.Acknowledgements
We thank Dr. Christopher Adamson, PhD, for technical support. This research was conducted within the Developmental Imaging and Neuroscience Research groups, Murdoch Children's Research Institute, the Department of Neurosurgery, Royal Children's Hospital, at the Melbourne Children's MRI centre, Melbourne, Victoria. It was supported by the Royal Children's Hospital Foundation (RCH 1000 to Dr. Yang), Australia's National Health and Medical Research Council (Postgraduate Scholarship 1039160 to Dr. Yang), Murdoch Children's Research Institute, The University of Melbourne Department of Paediatrics, and the Victorian Government's Operational Infrastructure Support Program.References
1. Brody BA, Kinney HC, Kloman AS, Gilles FH. Sequence of central nervous system myelination in human infancy. I. An autopsy study of myelination. J Neuropathol Exp Neurol. 1987;46:283-301
2. Kinney HC, Brody BA, Kloman AS, Gilles FH. Sequence of central nervous system myelination in human infancy. Ii. Patterns of myelination in autopsied infants. J Neuropathol Exp Neurol. 1988;47:217-234
3. Yakovlev P, Lecours A. The myelogenetic cycles of regional maturation of the brain. In: Minkowski A, ed. Regional development of the brain in early life. Oxford: Blackwell; 1967:3-70.
4. Ganzetti M, Wenderoth N, Mantini D. Whole brain myelin mapping using t1- and t2-weighted mr imaging data. Front Hum Neurosci. 2014;8:671
5. Glasser MF, Van Essen DC. Mapping human cortical areas in vivo based on myelin content as revealed by t1- and t2-weighted mri. J Neurosci. 2011;31:11597-11616
Figures