0526
MR Fingerprinting enables quantitative measures of brain tissue relaxation times and myelin water fraction in early brain development1Radiology, University of North Carolina at Chapel Hill, Chapel Hill, NC, United States, 2Chang Gung University College of Medicine, Kaohsiung, Taiwan
Synopsis
In this study, a high-resolution MR Fingerprinting technique was developed for rapid and simultaneous quantification of T1, T2 and myelin water fraction in pediatric neuroimaging. The method was applied to five subjects from 3 months to 52 months old and high quality quantitative maps were obtained from all subjects without evident motion artifacts. Our preliminary results also show a trend of decrease in T1/T2 and increase of myelin water fraction with age, which are consistent with finding in literature.
Introduction
Investigating brain development in early childhood is critical not only for understanding the trajectory of healthy neurodevelopment, but also to provide guidance for treatment interventions1. Quantitative MRI measurement such as T1/T2 relaxation times and myelin water imaging has shown great promise in investigating brain development2,3. However, robust measurement of these tissue properties in young pediatric age groups (<5 years old) is extremely challenging due to lengthy acquisition times and motion sensitivity. Recently, a new quantitative MR imaging technique, named MR Fingerprinting (MRF), has been developed which can provide rapid and simultaneous quantification of multiple tissue properties4. The goal of this study was to develop a robust MRF technique for accurate and high-resolution assessment of multiple tissue properties (T1, T2 and myelin water fraction (MWF)) for pediatric neuroimaging.Methods
Five typically developing pediatric subjects (M:F, 3:2; mean age, 31±21 months) were included in this study and imaging was performed on a Siemens 3T Prisma scanner using a 32-channel head coil. To ensure accurate quantification of fine structures in brain tissues, a 2D MRF method was developed with a high spatial resolution of 1x1x3 mm3. For each 2D acquisition, ~1700 highly undersampled images (reduction factor, 48) were acquired4 and the total acquisition time was ~19 sec. For each subject, a total of five axial slices were acquired which were prescribed in parallel to the anterior/posterior commissure line. All of the children over 36 months old were scanned during awake, while the younger children were scanned during sleep without sedation.
After the experiments, quantitative T1 and T2 relaxation times were first extracted from the MRF measurements using pattern matching. A dictionary-based partial-volume analysis was further performed to quantify myelin content as described before5. The MWF was calculated as the percentage of myelin water as compared to the total water amount in each voxel. ROI analysis was then performed by a neuro-radiologist with 5 years of experience.
The accuracy of MWF obtained using MRF was further compared to that obtained using a multi-echo spin-echo sequence. This experiment was performed with one adult subject using the proposed MRF protocol. To implement the reference method, variable crusher gradients and nonselective composite 180° pulses were used to minimize the effects of B0 and B1 field inhomogeneities6. The total acquisition time for each 2D slice was about 17 min. The myelin water fraction was extracted from the acquired T2 decay curves using a regularized non-negative least squares algorithm6.
Results
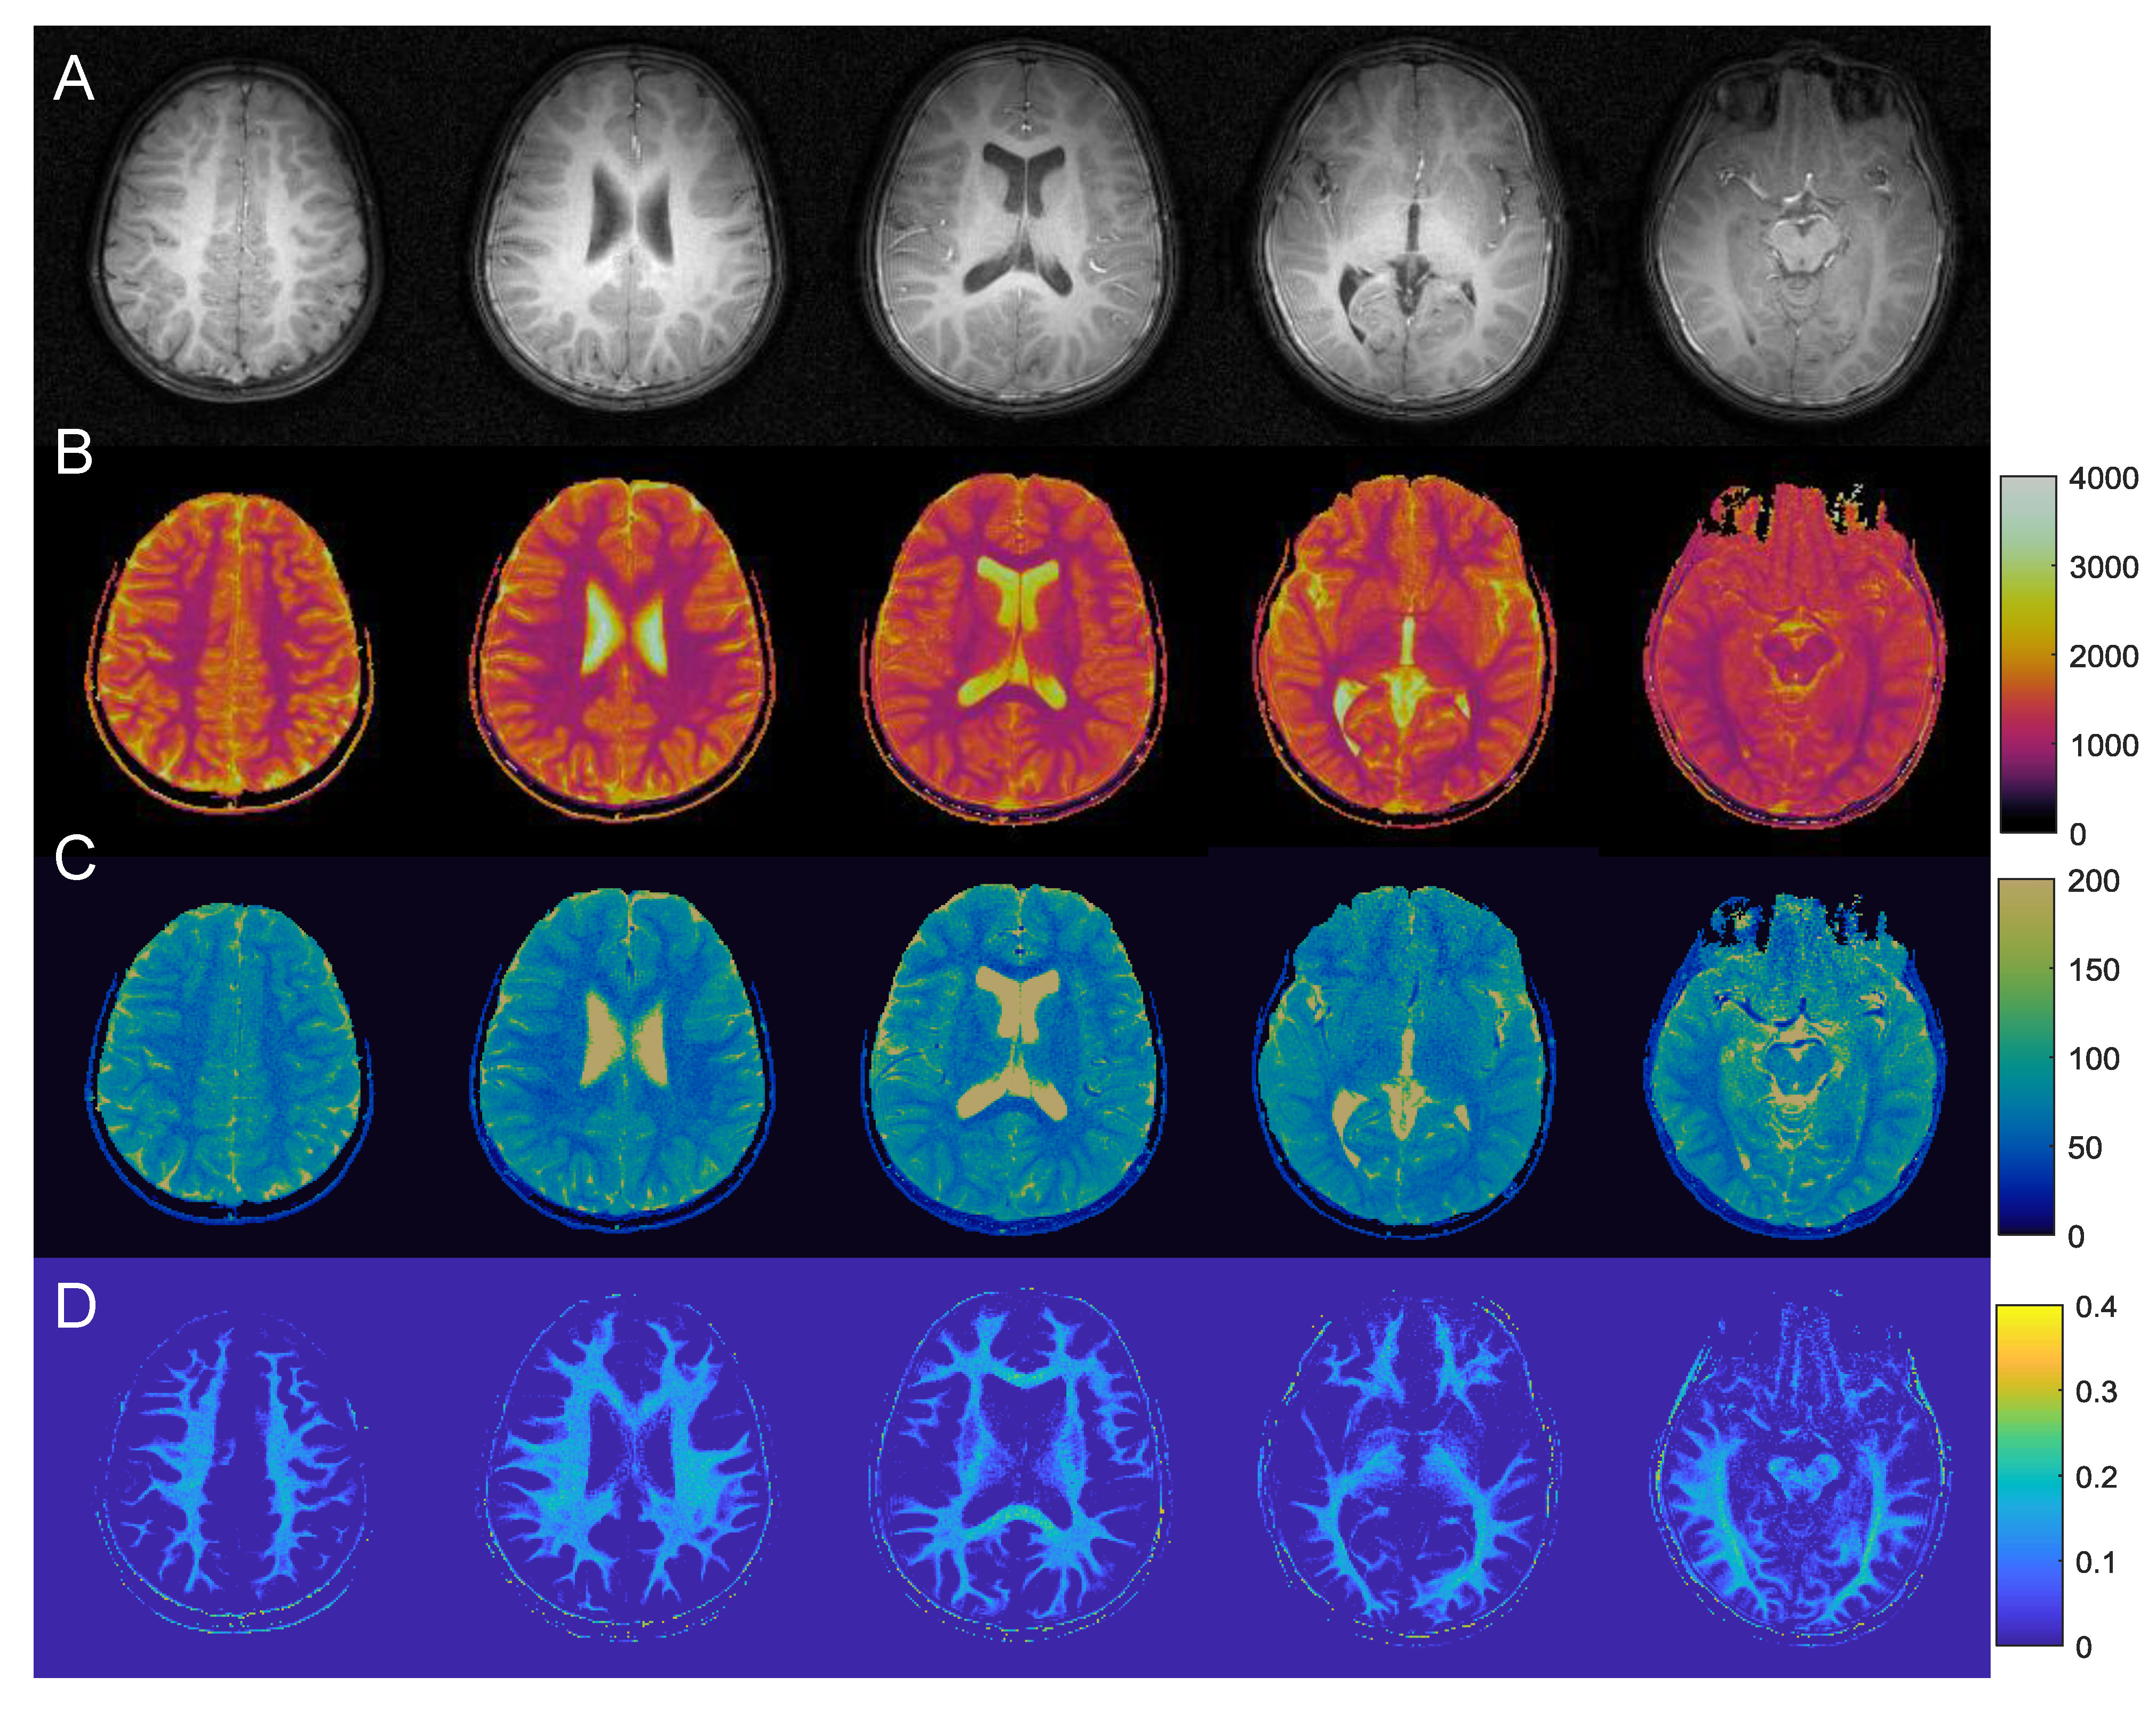
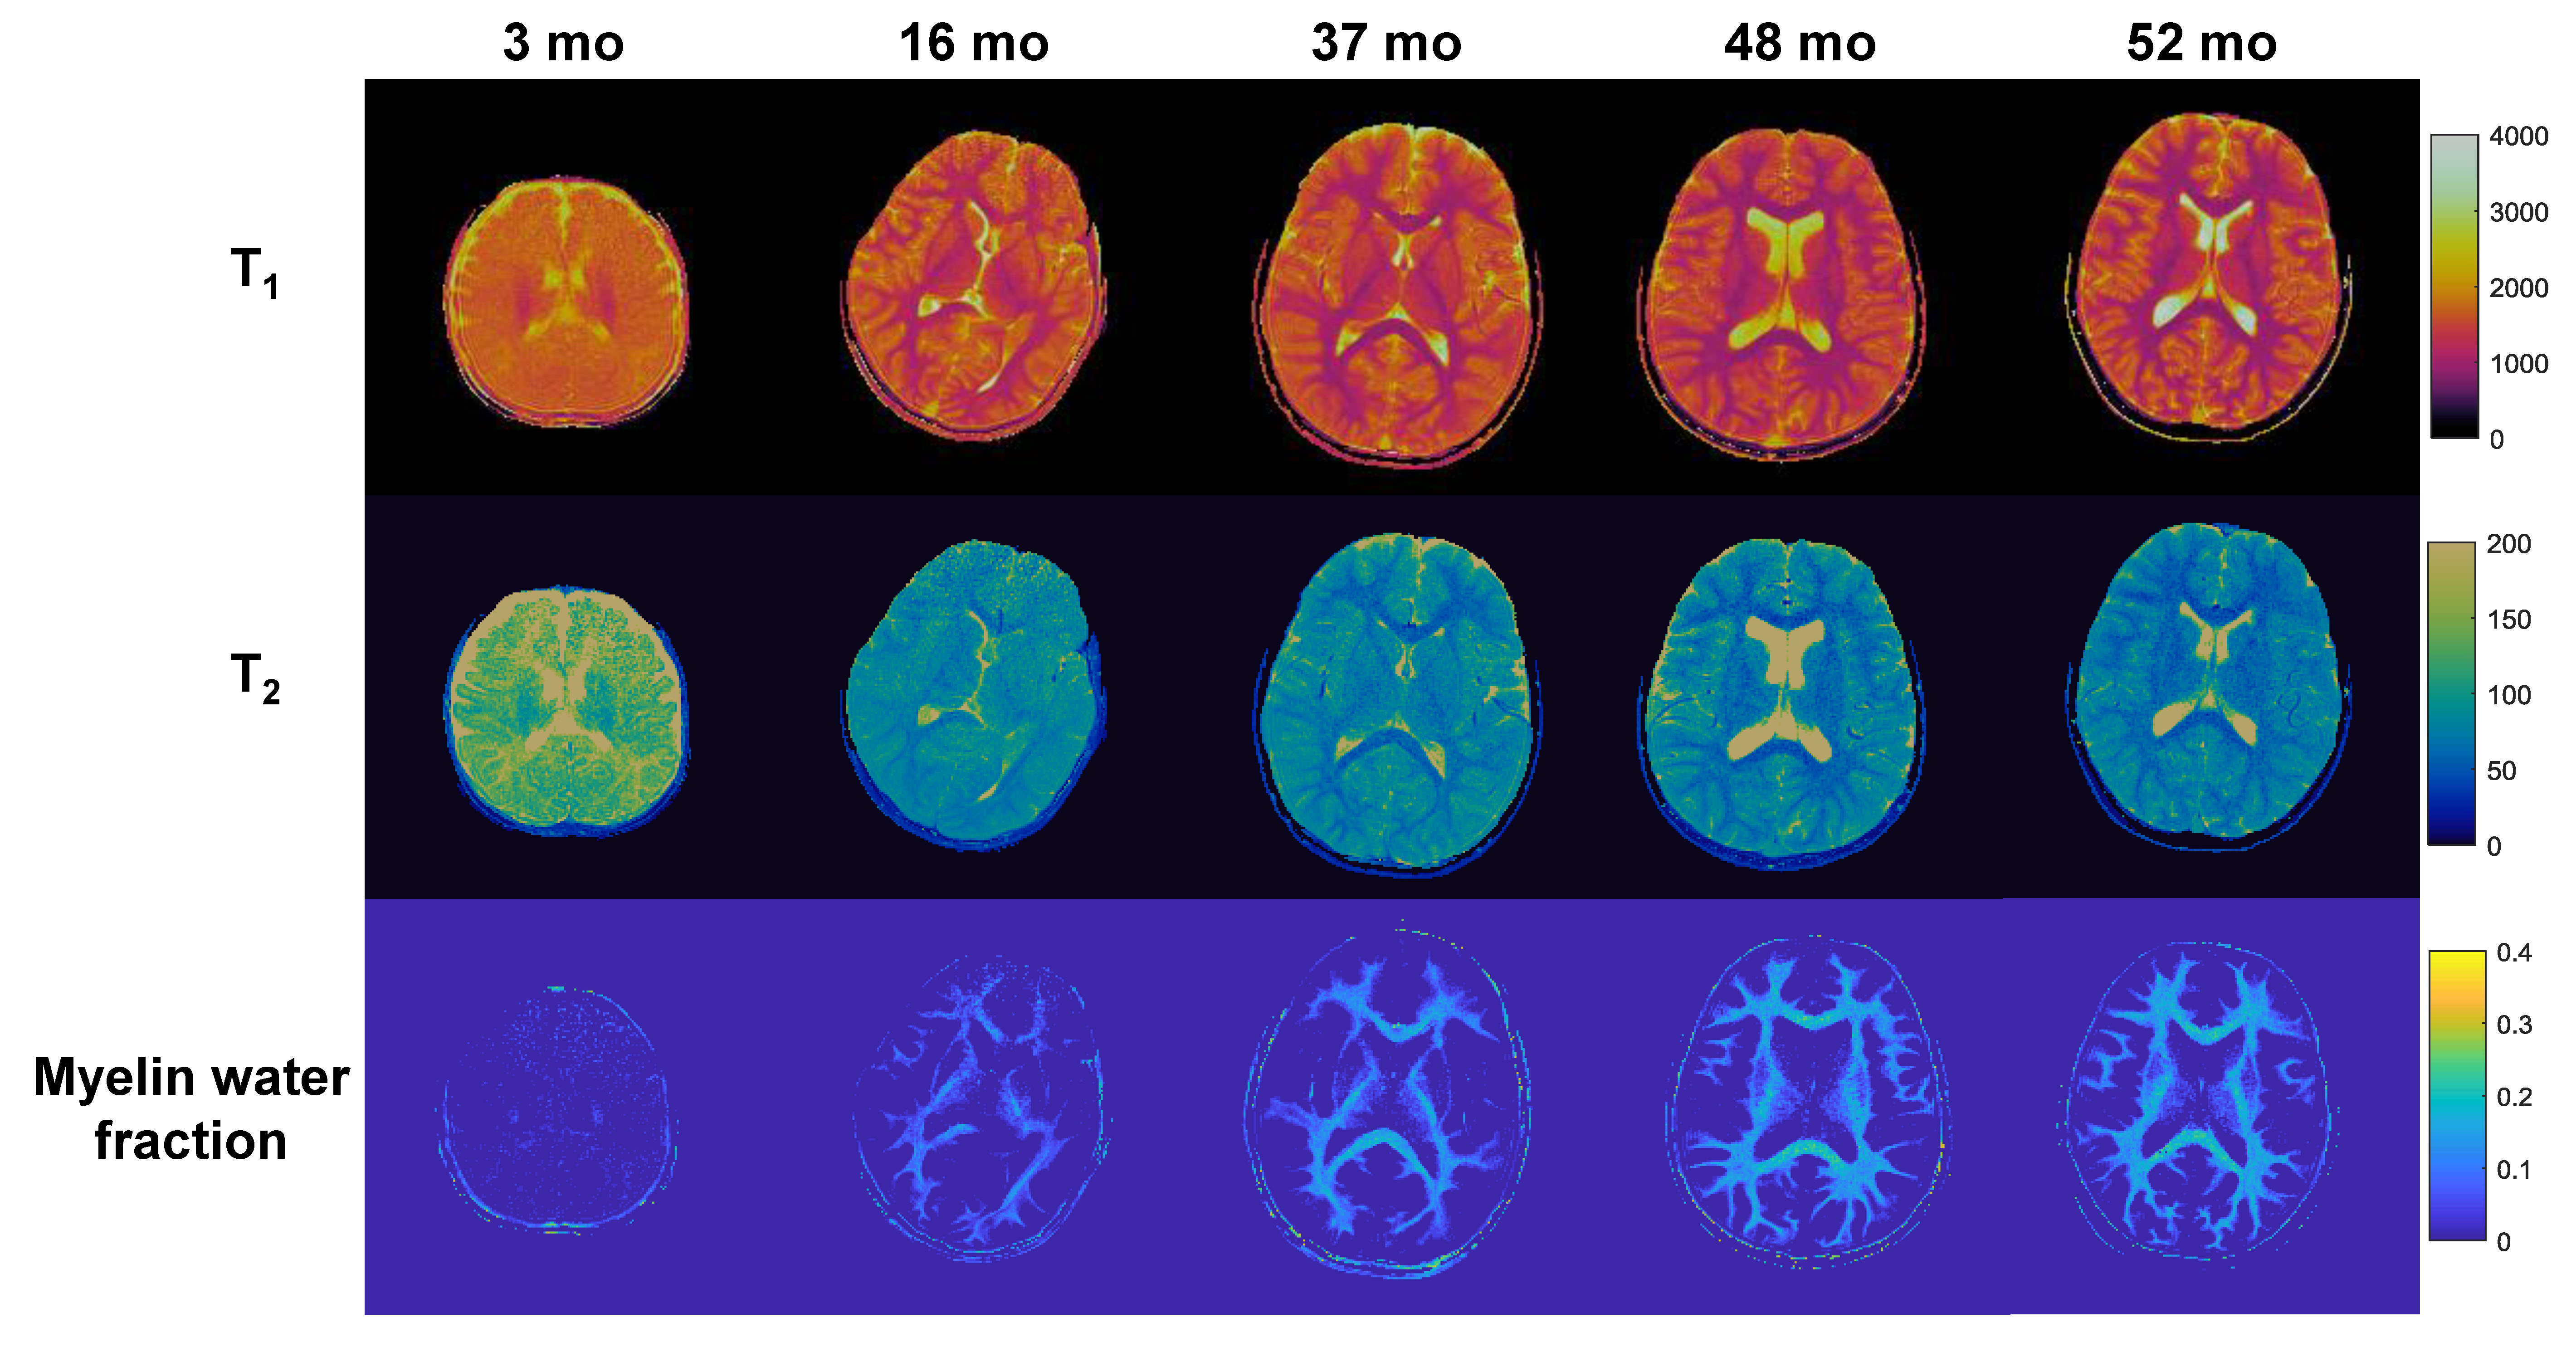
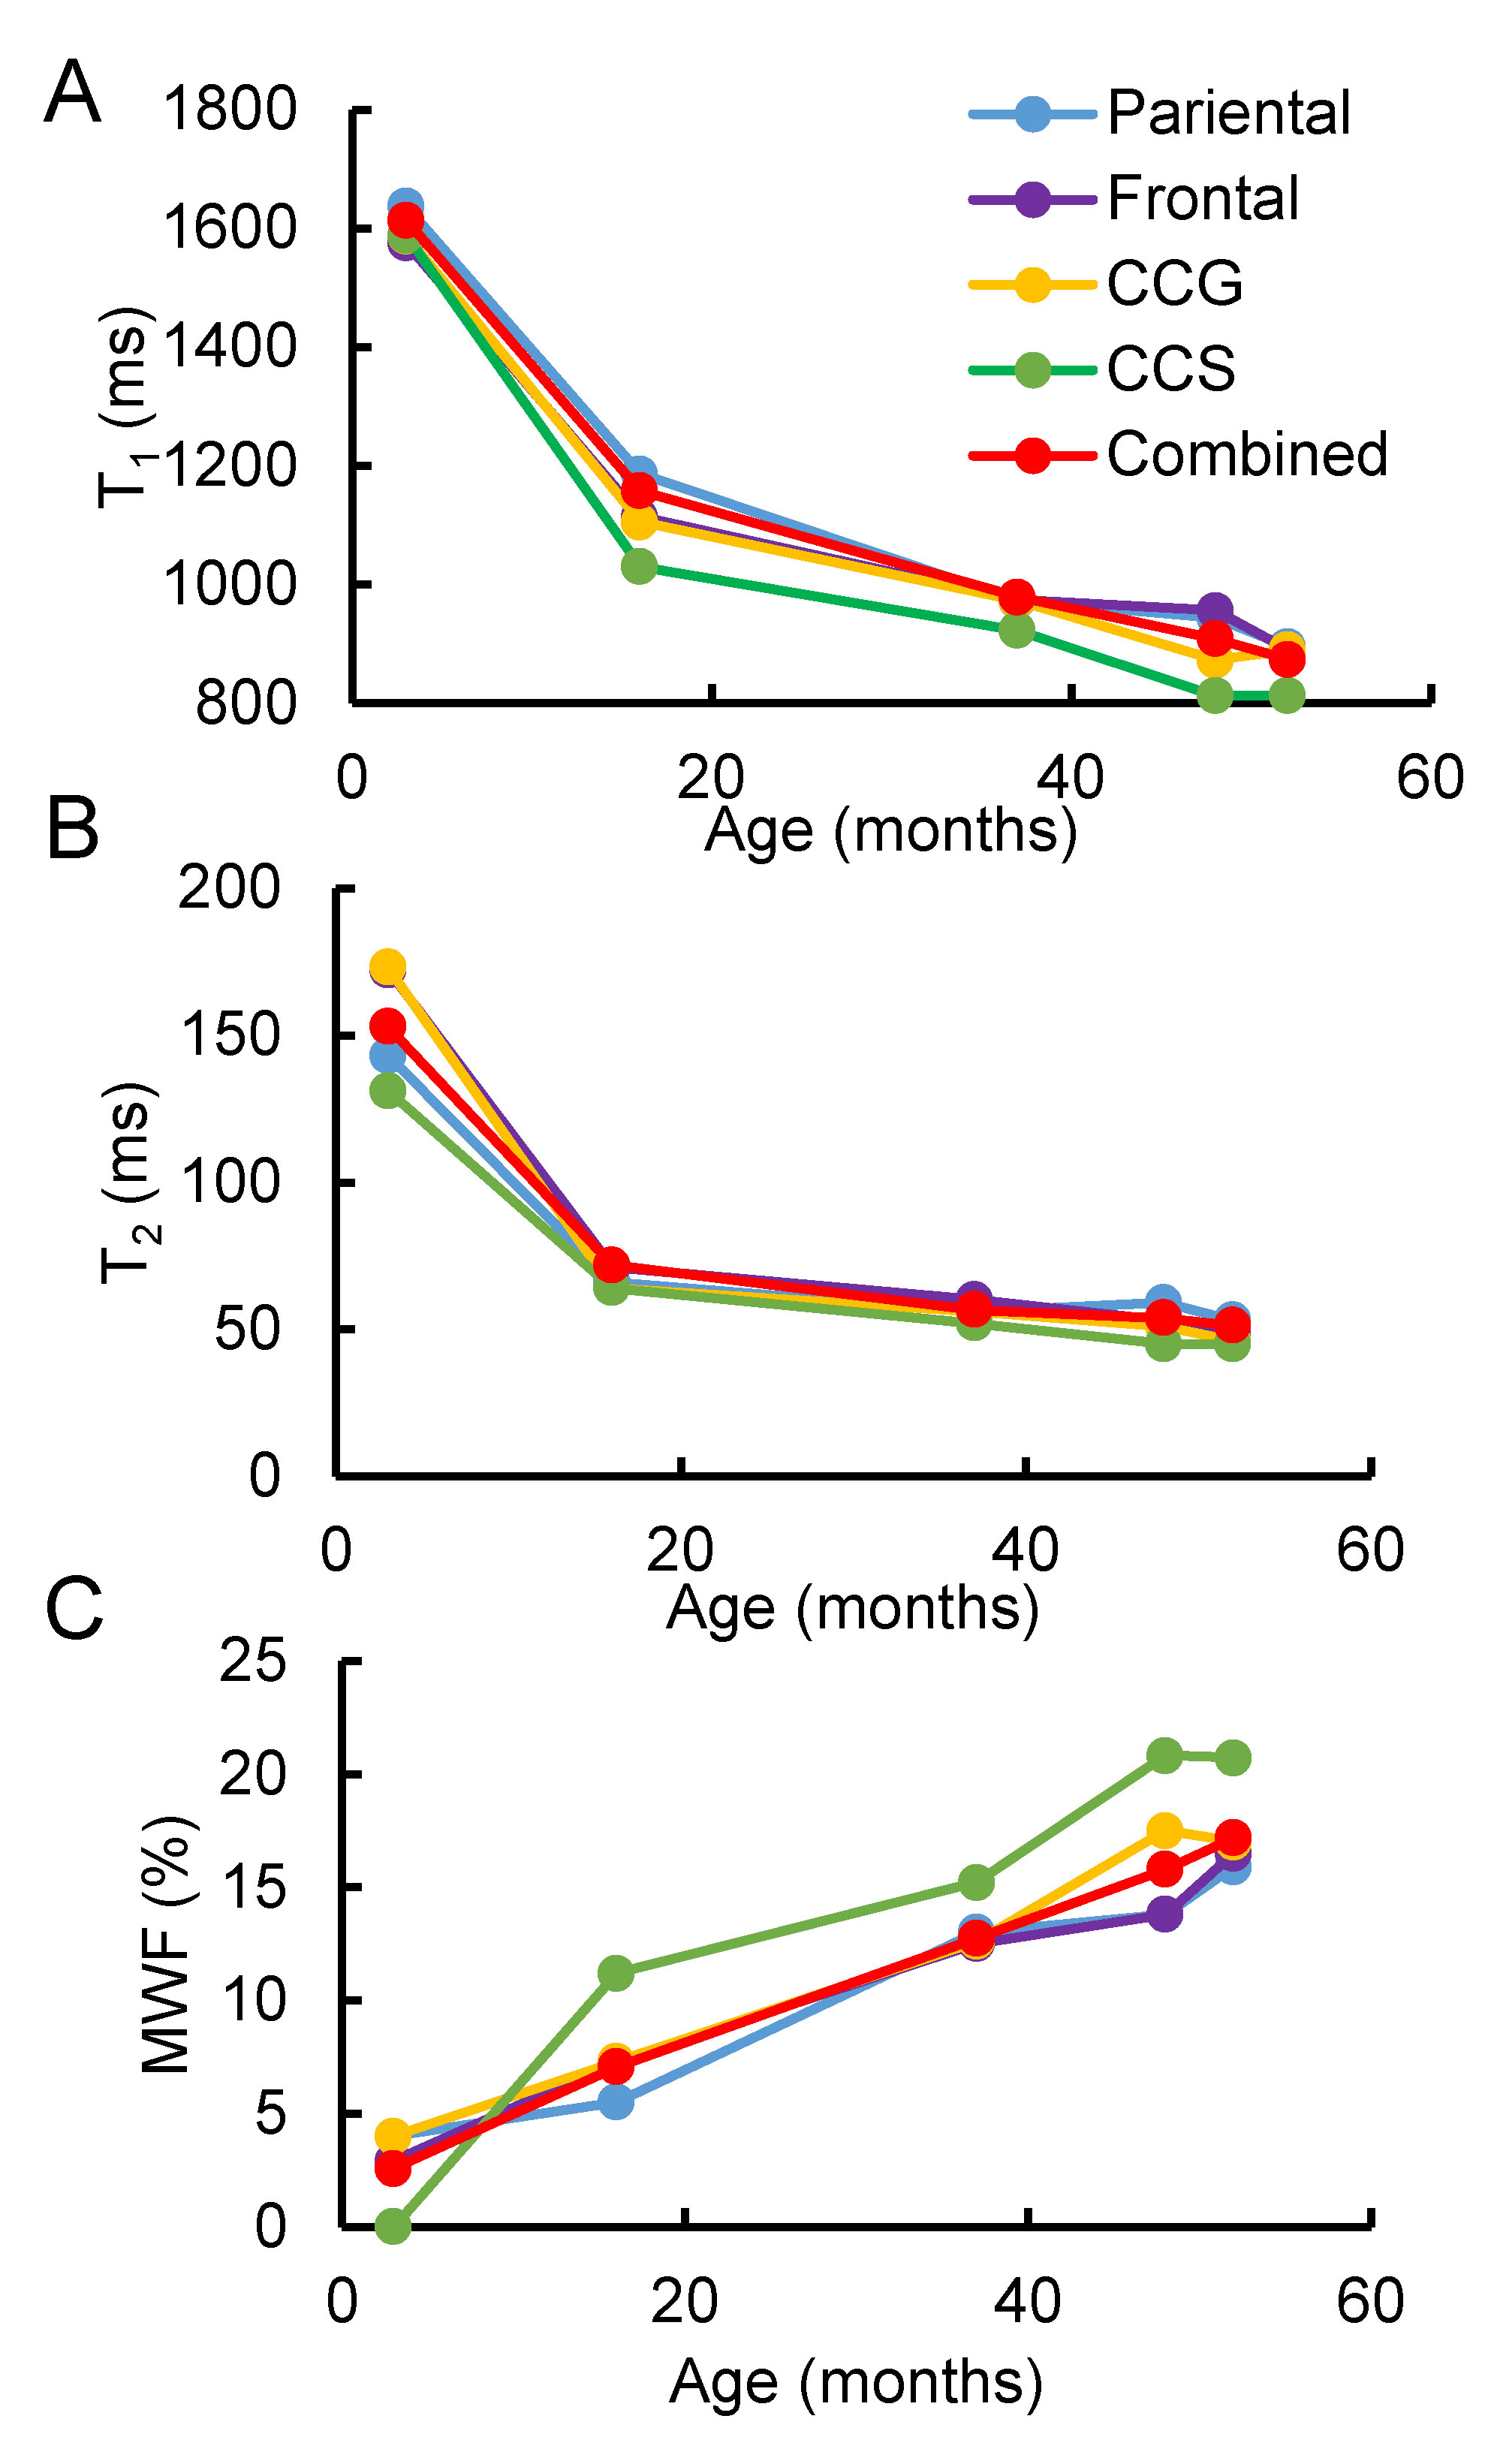
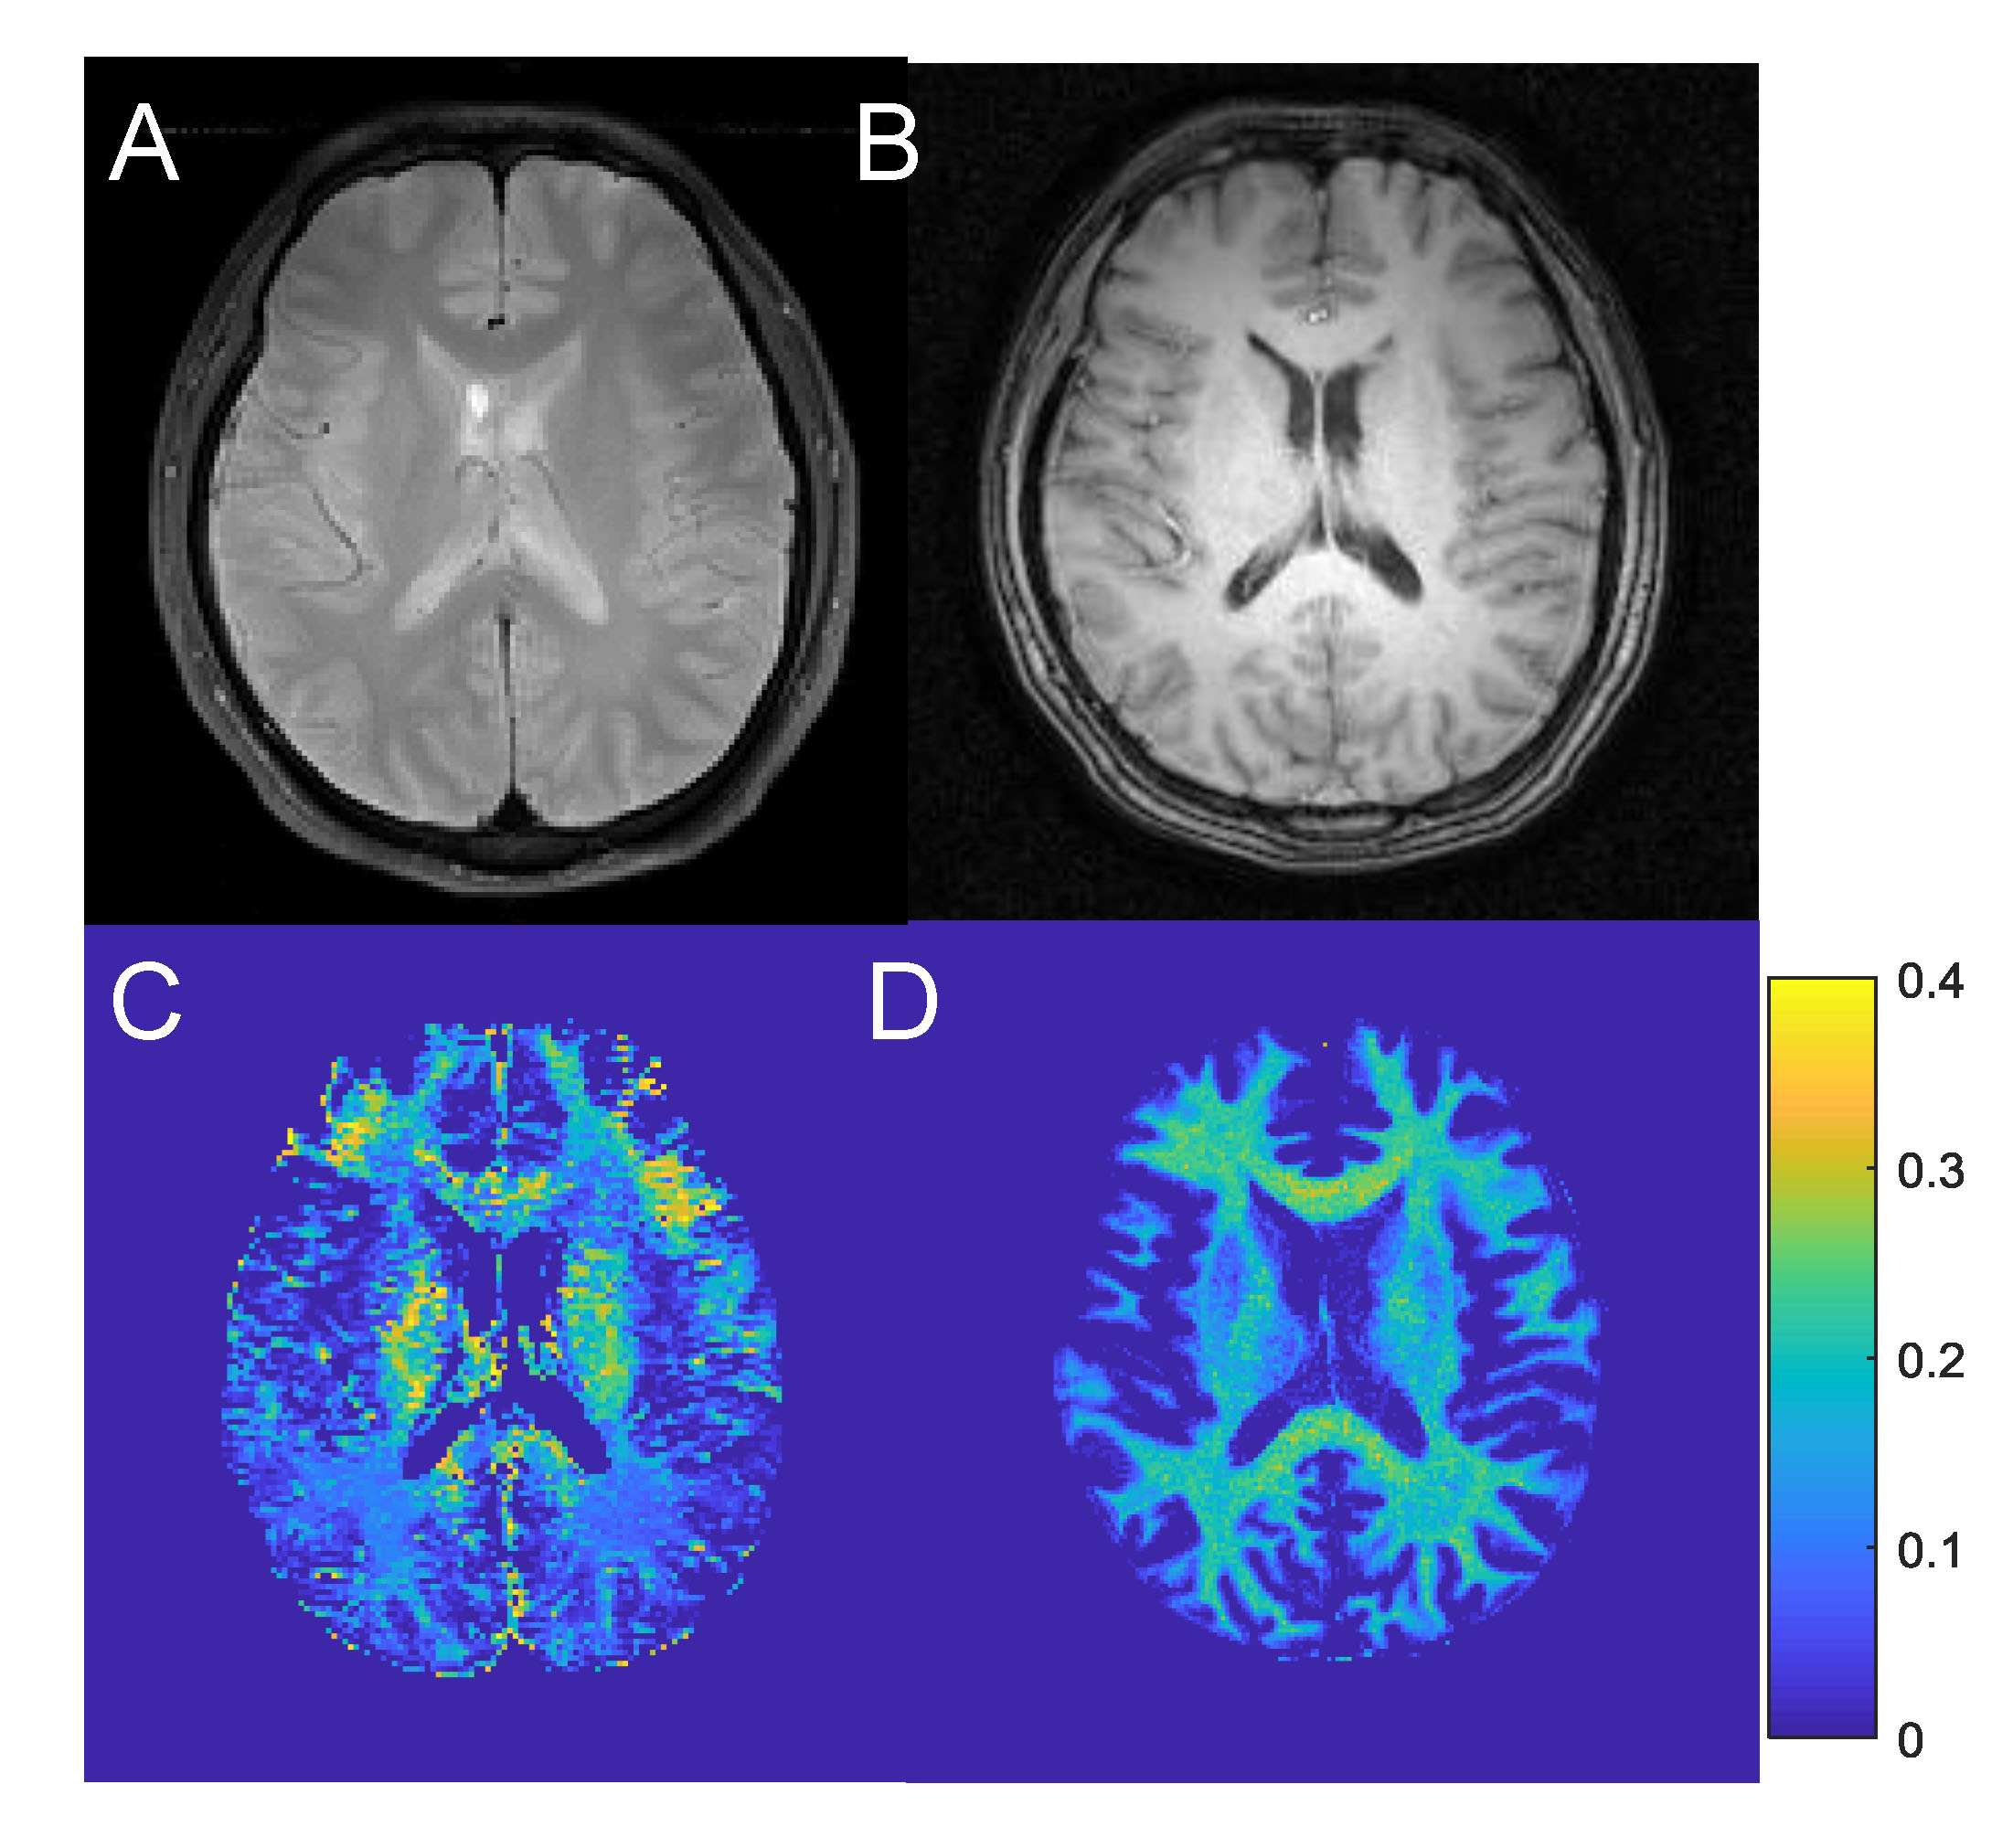
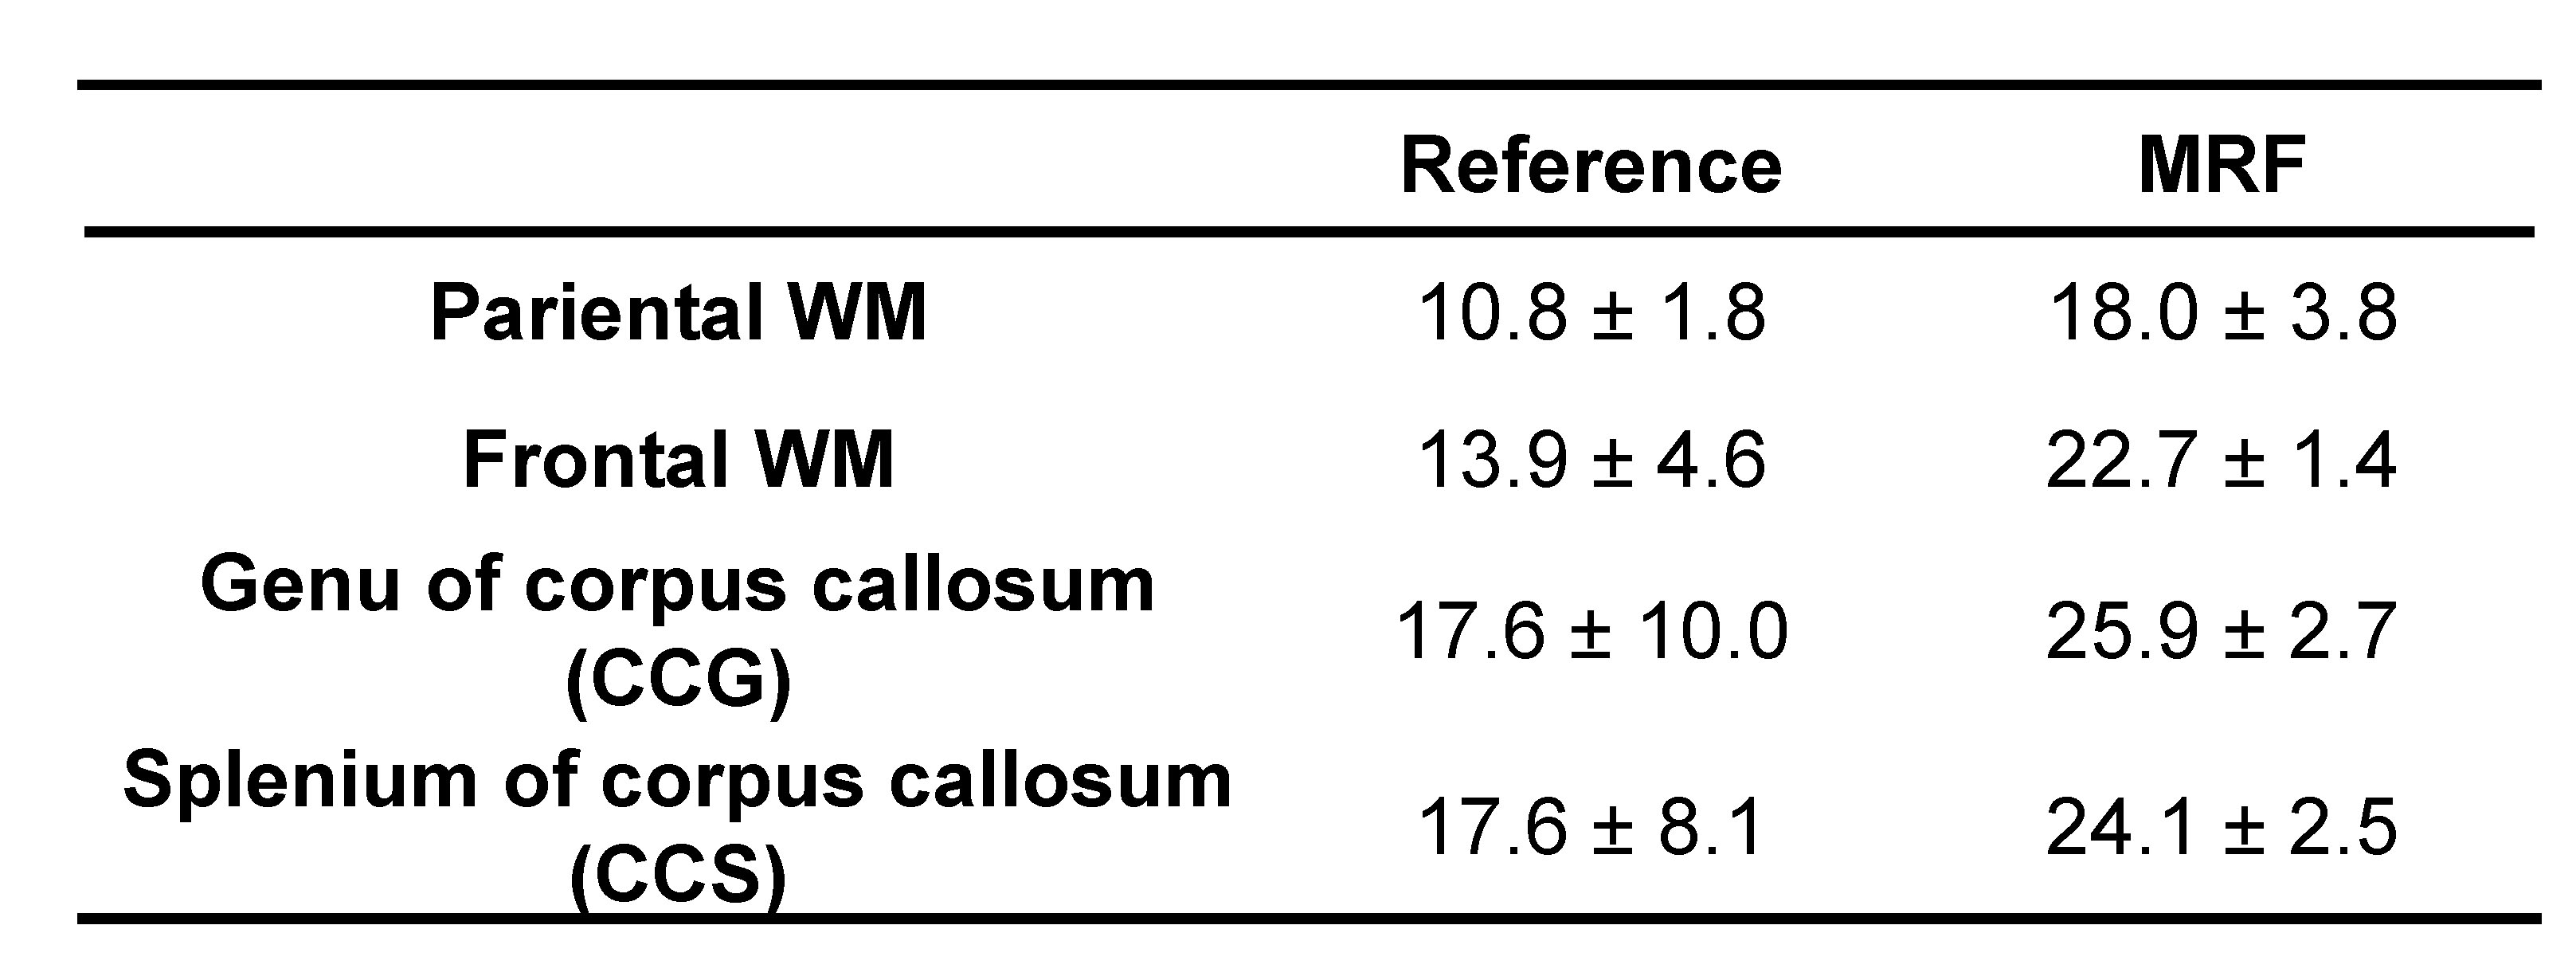
Fig.1 shows representative results obtained from a 48-month subject at five slice locations. No motion artifact was noticed in these images and the quantitative results for all tissue properties are consistent across different locations. Fig. 2 shows the quantitative maps from all five pediatric subjects from a similar location. The quality of maps is consistent across all the subjects from 3 months to 52 months old. Higher T1 and T2 were noticed with the 3-month subject as compared to others. A trend of increase in the MWF was also observed with age, which is consistent with the literature3. A ROI analysis was performed at different regions of brain and the results are presented in Fig. 3. Fig. 4 shows the MWF maps obtained from the same subject using the MRF technique and the multi-echo spin-echo method. Note the improved image quality of the MWF maps using the MRF approach. The values at different locations are provided in Table 1. While MRF can provide high-quality MWF maps, higher values were noticed as compared to those obtained with the reference method.Discussion and Conclusion
In this study, a rapid 2D MRF method with a spatial resolution of 1x1x3 mm3 was proposed, which can provide high-quality quantitative maps (T1, T2, and MWF) in a single acquisition of 19 sec. Although our results are preliminary and sample size is small, continuing enrollment of subjects is ongoing as a part of the Baby Connectome Project. All the findings in the study are consistent with the literature2,3. While pediatric MRI is often failed due to motion-related artifacts, no such artifacts were observed in the current study, which is partly due to the robustness of the MRF technique to motions. As the first attempt to validate MWF measurement from MRF, higher values were noticed in comparison to the multi-echo spin-echo method. The difference could be due to the assumptions of the relaxation values used in MRF partial volume analysis, or the accuracy of the multi-echo method which is highly dependent on SNR. Future studies will focus on improving SNR for the reference method and comparing to other methods such as MRFx7.Acknowledgements
No acknowledgement found.References
1. Lenroot R and Giedd J. Neuroscience and Biobehavioral Reviews, 2006;30:718-729.
2. Leppert LR et al., JMRI, 2009;29:258-267.
3. Deoni S, et al., J NeuroScience, 2011;31:784-791.
4. Dan M, et al. Nature, 2013; 187–192.
5. Deshmane A, et al., Int. Soc. Magn. Reson. Med. 2015;71.
6. Alonso-Ortiz E, et al., MRM, 2015;73:70-81.
7. Hamilton JI, et al. Int. Soc. Magn. Reson. Med. 2016;431.
Figures