0525
Quantitative assessment of pediatric brain myelination in a clinical setting using macromolecular proton fraction1Radiology, University of Washington, Seattle, WA, United States, 2Research Institute of Biology and Biophysics, Tomsk State University, Tomsk, Russian Federation, 3Radiology, First Children's Hospital, Tomsk, Russian Federation
Synopsis
The fast macromolecular proton fraction (MPF) mapping method has been implemented as a part of a clinical pediatric MRI protocol for a 1.5T MRI scanner. 3D MPF maps were obtained from 31 pediatric patients aged from 2 weeks to 7 years without abnormal brain findings. MPF maps allowed robust quantitation of age-related changes in the myelin content. Temporal trajectories of regional brain myelination were analyzed using the general logistic model that enabled the formal description of distinctions in the onset and speed of myelination across a range of white and gray matter structures.
Introduction
Myelin content in the human brain rapidly increases over the first three years of life and provides a primary biological indicator of the brain development. Abnormal myelination frequently occurs as a sequela of various peri-natal brain injuries and may provide a pathological mechanism for delayed neurodevelopment and certain neuropsychiatric conditions1. Radiological assessment of myelination in the pediatric brain is typically based on visual patterns of tissue contrast on MR images corresponding to a particular age2. No clinically suitable methods have been proposed to date for objective quantitative characterization of the pediatric brain myelination.
Fast macromolecular proton fraction (MPF) mapping3,4 is a recently emerged quantitative MRI technology enabling quantitative assessment of the myelin content. The method has been histologically validated5,6 and demonstrated a promise as a clinically targeted tool for quantitative assessment of demyelination in multiple sclerosis7 and traumatic brain injury8. The goals of this study were to adopt the fast MPF mapping method to a routine clinical MRI setting and asses its capability to quantitatively characterize myelin development in the normal pediatric brain.
Materials and Methods
Participants: Recruitment has been carried out upon parental consent at a clinical pediatric MRI facility from the population of children who underwent clinical MRI examinations. An MPF mapping protocol has been executed as an addition to the standard clinical MRI protocol in subjects satisfying the inclusion criteria according to the judgment of a pediatric radiologist. Inclusion criteria were: 1) the absence of brain abnormalities on clinical brain MRI, 2) visually normal myelination patterns corresponding to the age, and 3) the absence of history of preterm birth, perinatal injury, congenital abnormality, head trauma, metabolic disease, or any major neurological condition. Data were obtained from 31 children (age range from 2 weeks to 7 years).
MRI acquisition: A 1.5T clinical MRI scanner (Toshiba Vantage Titan) was used for data acquisition with unmodified manufacturer’s software. A fast whole-brain 3D MPF mapping protocol was implemented with spatial resolution of 1.15х1.15х1.3 mm3 and included the following sequences: magnetization-transfer-weighted spoiled gradient echo (GRE) with TR/TE=20.5/5.5 ms, flip angle (FA) = 8°, and off-resonance saturation by the Gaussian pulse with duration of 1.5 ms, effective FA=200°, and offset frequency 2000 Hz; T1-weighted GRE with TR/TE=16/5.5 ms, and FA=18°; and proton-density-weighted GRE with TR/TE=16/5.5 ms, and FA=3°. All sequences were executed with single signal acquisition and parallel imaging with acceleration factors of 1.5 and 1.2 for in-plane and slice phase-encoding directions, respectively. The total scan time was 12 minutes.
Image processing and analysis: MPF maps were reconstructed using the single-point synthetic reference algorithm4. Regions-of-interest were placed manually in selected white matter (WM) and gray matter (GM) structures listed in the Results section using ImageJ software.
Statistical analysis: To describe age-related MPF changes in ROIs, non-linear regression with the general logistic model was used in the form:
MPF=(MPFmin-MPFmax)/(1+(t/t0)p)+MPFmax,
where MPFmin and MPFmax are the asymptotic minimal and maximal values, t is the age, t0 is the inflection point (time point corresponding to half-way between MPFmin and MPFmax), and p is the steepness coefficient.
Results
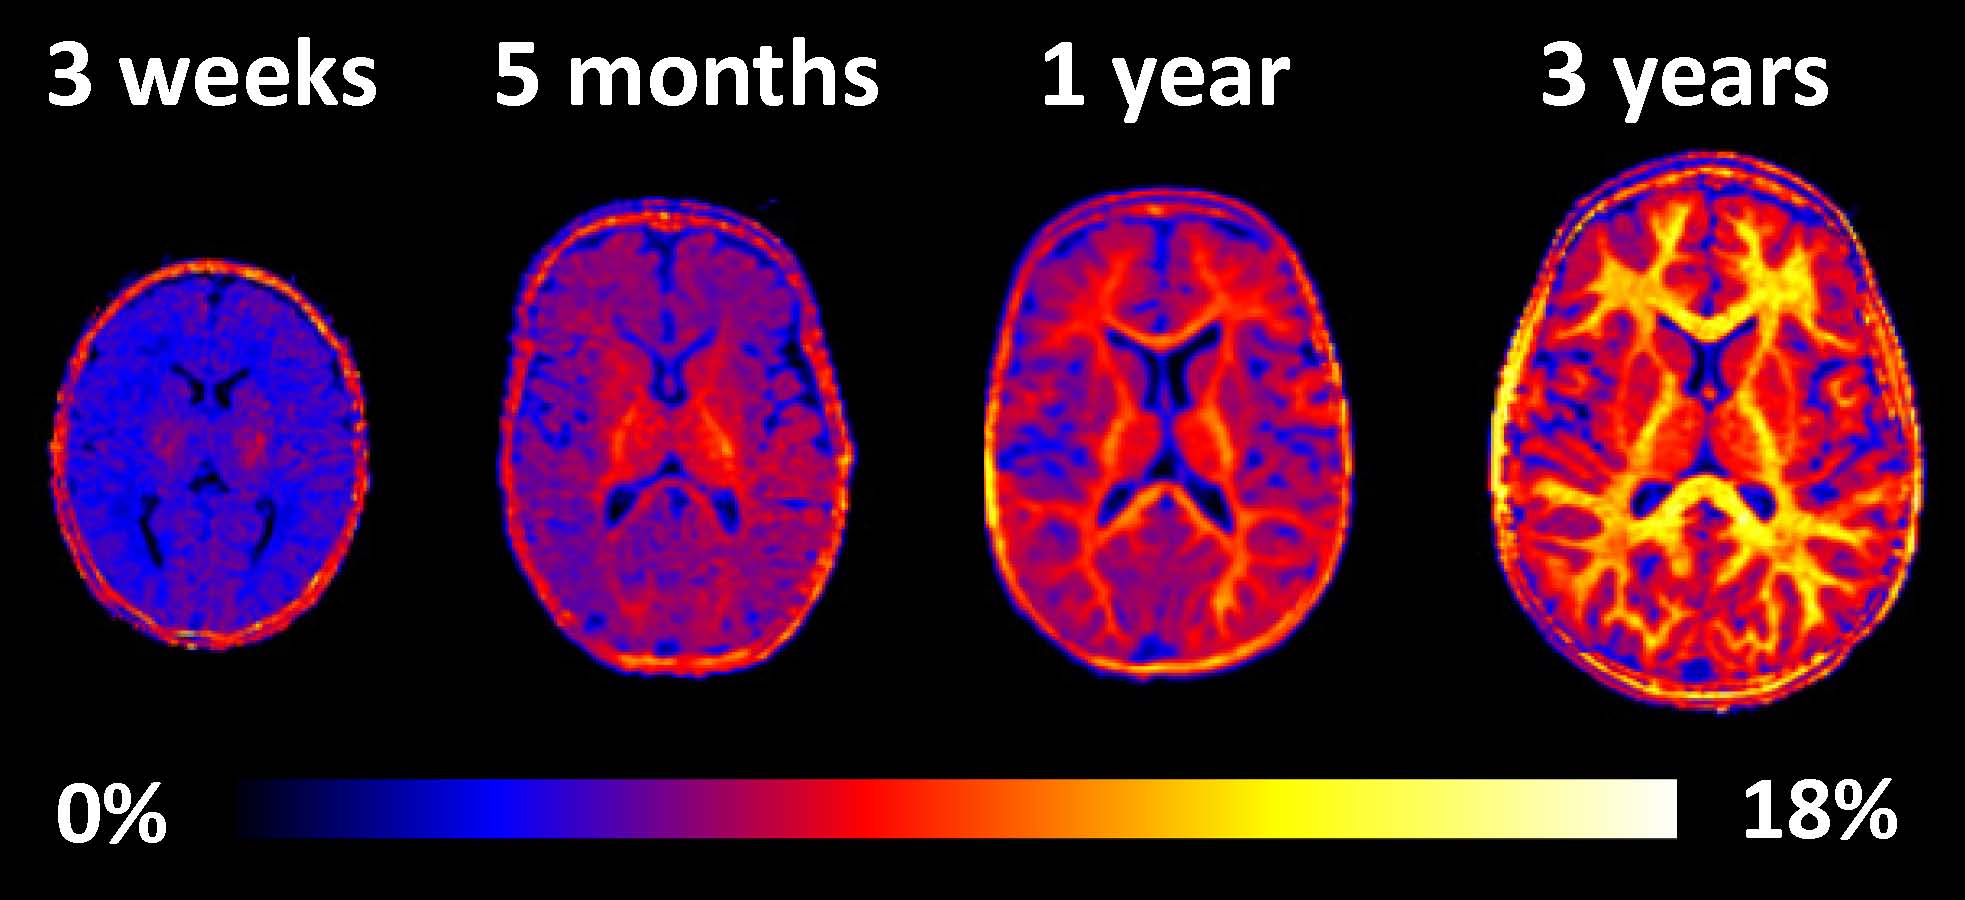
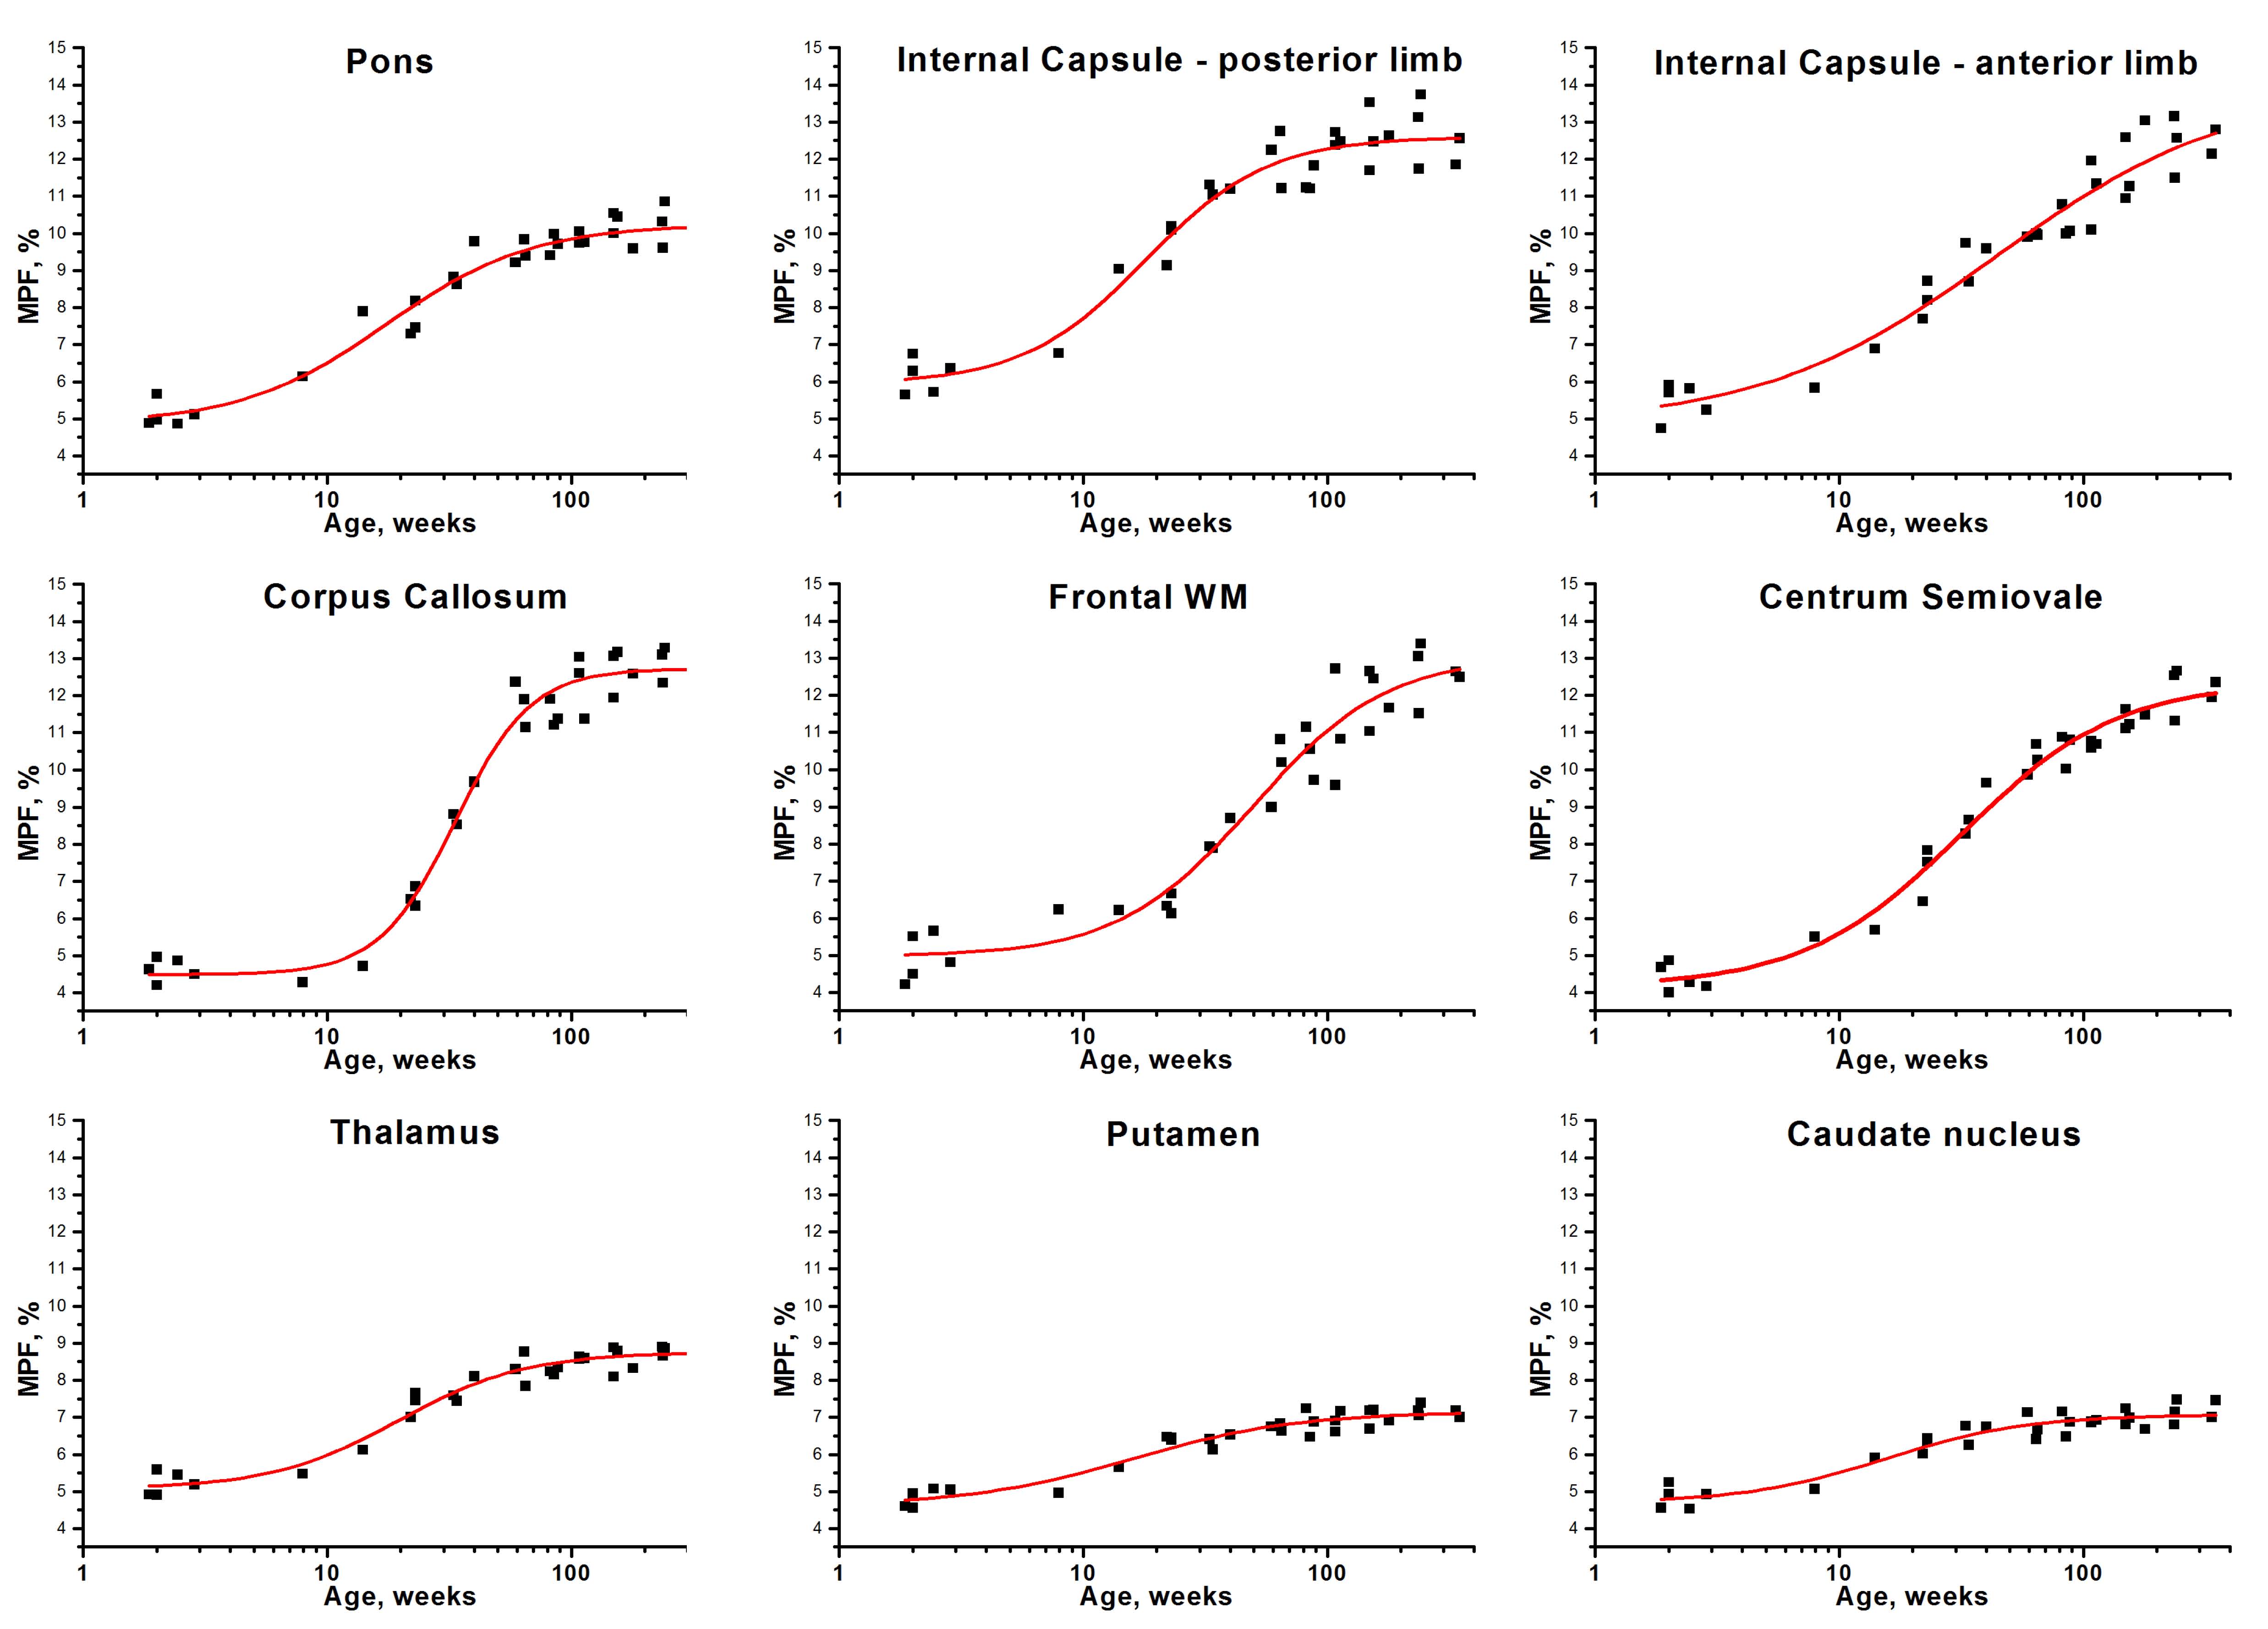
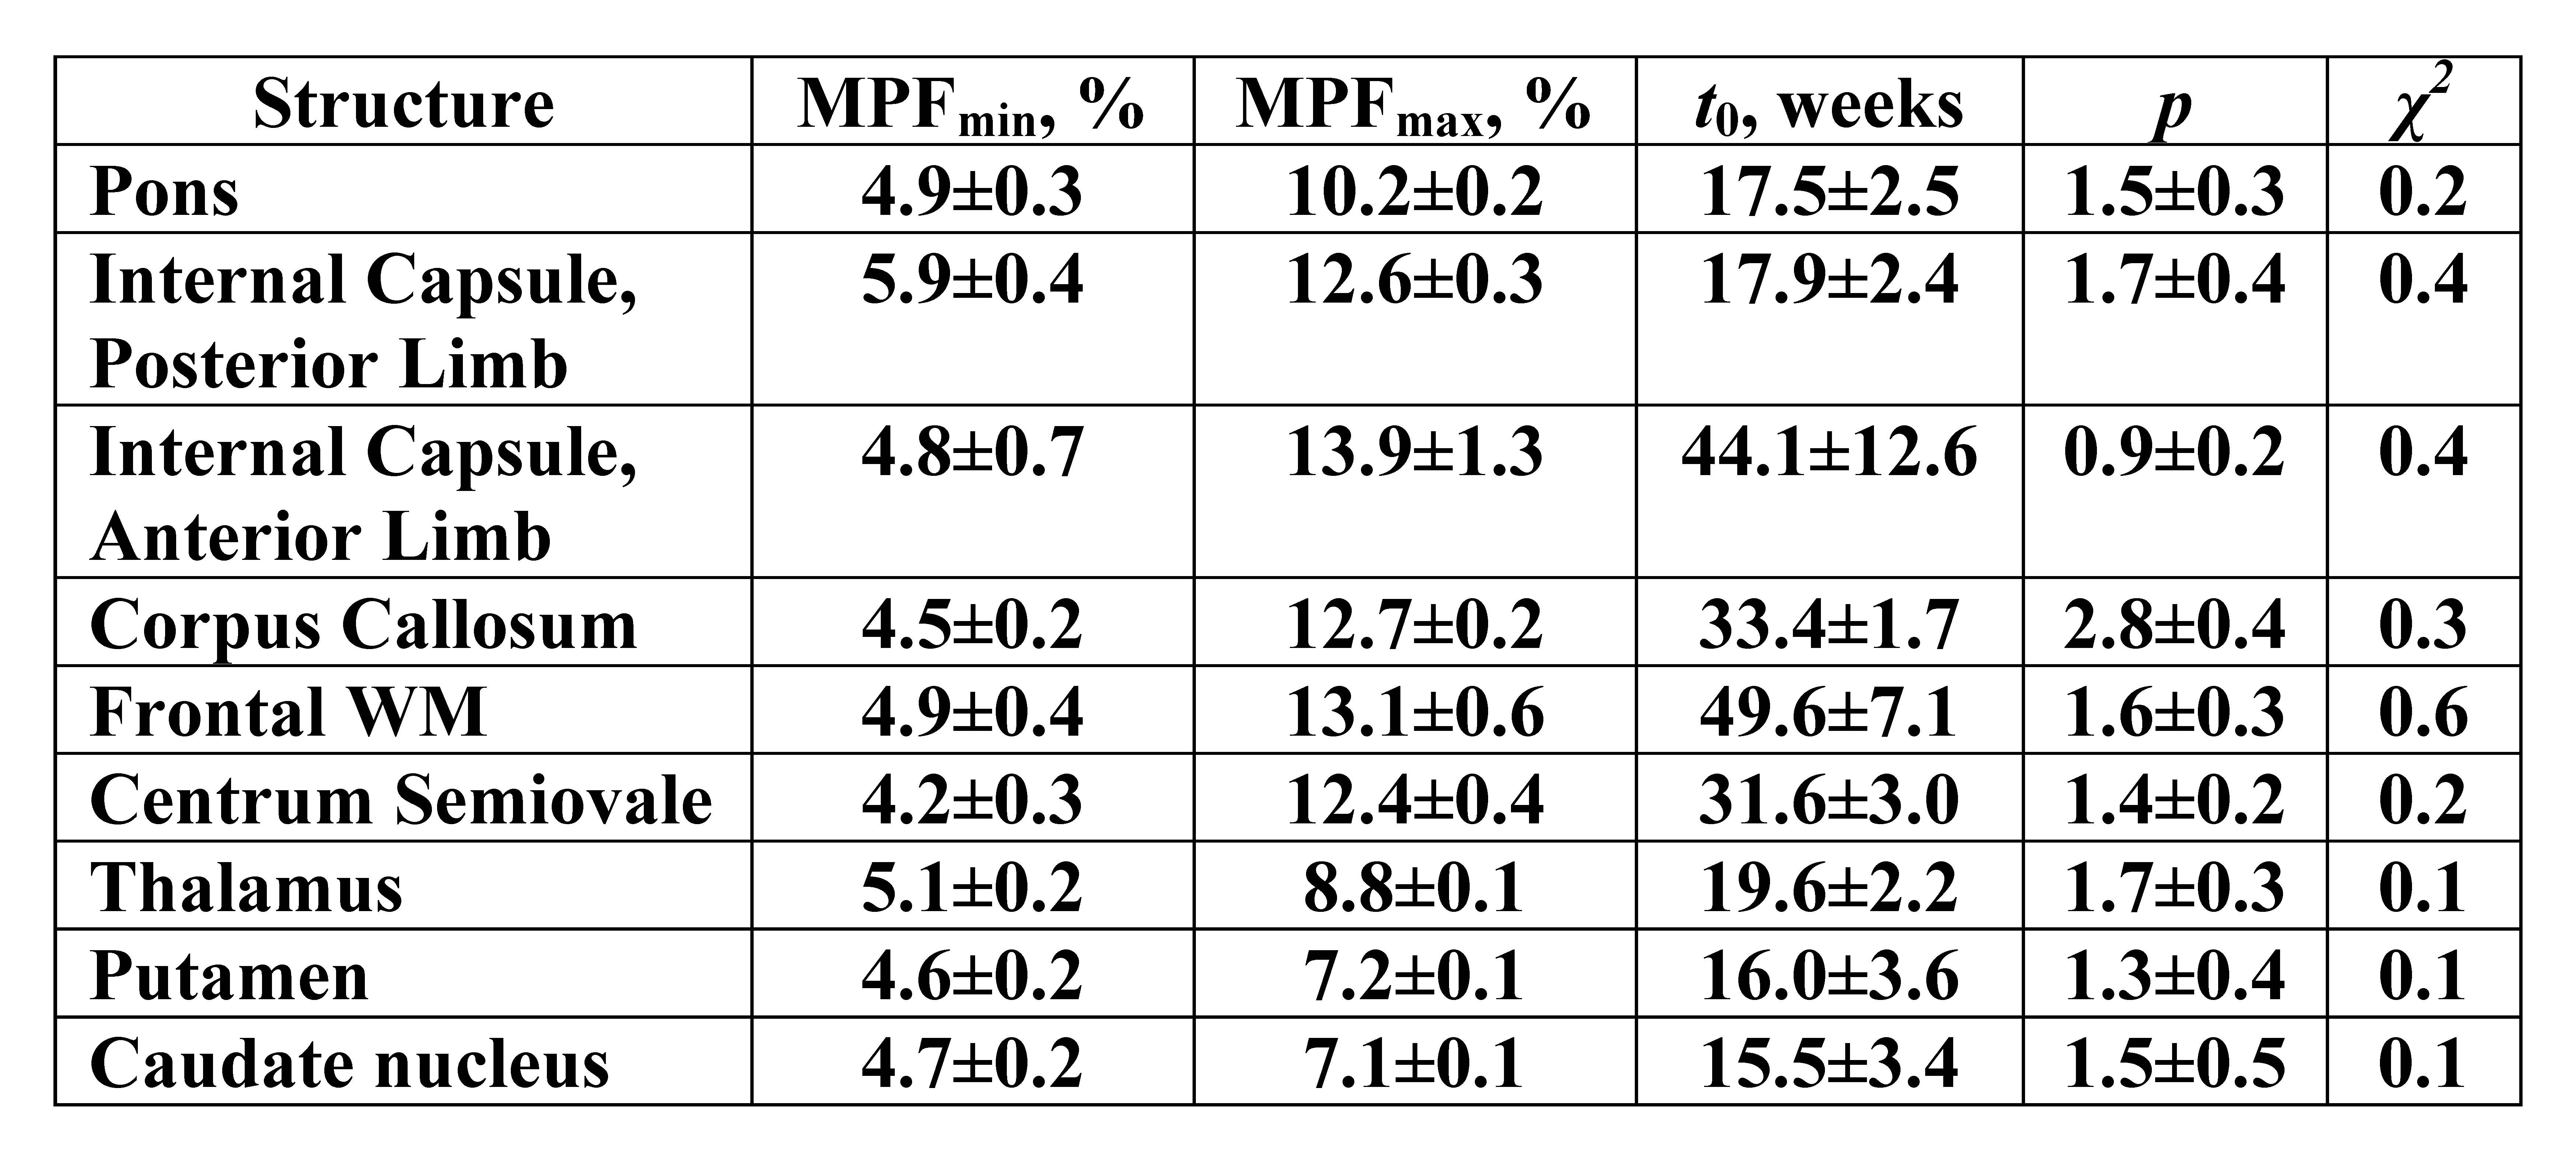
Example MPF maps of the pediatric brain (Fig. 1) demonstrated a visible age-related increase in the myelin content, most prominent during the first year of life. The general logistic model provided an adequate approach to mathematically describe MPF changes during the brain development (Fig. 2). ROI fit revealed substantial distinctions in the myelination onset and rate across brain structures (Fig. 2, Table 1). Notably, MPF reliably captured temporal trajectories of myelination in both WM and GM. Myelination begins from the baseline MPFmin values around 4-5% and continues until reaching nearly adult7,8 values of MPFmax around 7-8% in GM and 12-13% in WM. The earliest myelination (t0=15-20 weeks) was observed in WM and deep GM structures with known prenatal myelination onset9,10 including the pons, posterior limb of internal capsule, thalamus, putamen, and caudate nucleus. In contrast, the anterior limb of internal capsule and frontal WM were characterized by the latest myelination with t0=40-50 weeks. There are also substantial distinctions in the myelination rate, as seen from the steepness of the logistic curves. For example, the corpus callosum undergoes relatively late but rapid myelination, whereas myelination is much more prolonged in frontal WM and the anterior limb of internal capsule (Fig. 2, Table 1).Conclusions
Fast MPF mapping provides a simple clinically usable approach to quantitatively assess myelin development in the pediatric brain. Robust implementation on a clinical MRI scanner, minimal number of source images (only three), and fast reconstruction (few minutes) potentially allow the routine use of this technology in clinical settings.Acknowledgements
Ministry of Education and Science of the Russian Federation: State Assignment Project No. 18.2583.2017/4.6;
Russian Science Foundation: Project No.14-45-00040.
References
1. Rees S, Inder T. Fetal and neonatal origins of altered brain development. Early Hum Dev 2005;81:753-761.
2. Barkovich AJ. Concepts of myelin and myelination in neuroradiology. AJNR Am J Neuroradiol 2000;21:1099-1109.
3. Yarnykh
VL. Fast macromolecular proton fraction mapping from a single off-resonance
magnetization transfer measurement. Magn Reson Med 2012;68:166–178.
4. Yarnykh VL. Time-efficient, high-resolution, whole brain three-dimensional macromolecular proton fraction mapping. Magn Reson Med 2016;75:2100–2106.
5. Underhill HR, Rostomily RC, Mikheev AM, Yuan C, Yarnykh VL. Fast bound pool fraction imaging of the in vivo rat brain: Association with myelin content and validation in the C6 glioma model. Neuroimage 2011; 54: 2052–2065.
6. Khodanovich MYu, Sorokina IV, Glazacheva VYu, et al. Histological validation of fast macromolecular proton fraction mapping as a quantitative myelin imaging method in the cuprizone demyelination model. Sci Rep 2017;7:46686.
7. Yarnykh VL, Bowen JD, Samsonov A, et al. Fast whole-brain three-dimensional macromolecular proton fraction mapping in multiple sclerosis. Radiology 2015;274:210–220.
8. Petrie EC, Cross DJ, Yarnykh VL, et al. Neuroimaging, behavioral, and psychological sequelae of repetitive combined blast/impact mild traumatic brain injury in Iraq and Afghanistan war veterans. J Neurotrauma 2014;31:425–436.
9. Yakovlev PI, Lecours AR. The myelogenetic cycles of regional maturation of the brain. In: Minkowski A, ed. Regional development of the brain in early life. Oxford: Blackwell 1967;3-70.
10. Kinney HC, Brody BA, Kloman AS, Gilles FH. Sequence of central nervous system myelination in human infancy. II. Patterns of myelination in autopsied infants. J Neuropathol Exp Neurol 1988 ;47:217-234.
Figures