0519
Assessment of hepatic fibrosis and steatosis in pediatric non-alcoholic fatty liver disease using multifrequency MR elastography1Radiology, Charité - Universitätsmedizin Berlin, Berlin, Germany, 22Center for Chronically Sick Children, Charité - Universitätsmedizin Berlin, Berlin, Germany, 3Medical Informatics, Charité - Universitätsmedizin Berlin, Berlin, Germany
Synopsis
Multifrequency MR elastography MRE was applied to detect fibrosis and steatosis, two pathological features associated with pediatric non-alcoholic fatty liver disease (NAFLD). Shear wave speed (c) obtained from MRE is a measure of tissue stiffness and can differentiate moderate from advanced fibrosis. Penetration rate (a) as another MRE parameter is able to detect moderate steatosis and is negatively correlated with hepatic fat fraction. Both MRE derived mechanical parameters c and a are independently responsive to fibrosis and steatosis and could be used in the future as imaging markers for the noninvasive assessment of prediatric NAFLD.
Introduction
Non-alcoholic fatty liver disease (NAFLD) is the most frequent chronic liver disease in children today. Despite its invasiveness, liver biopsy is still the gold standard for the diagnosis of NAFLD. Magnetic resonance elastography (MRE) is a noninvasive imaging technique (1) used to probe the biomechanical properties of soft tissues in vivo and it has demonstrated great value in diagnosing liver fibrosis.Methods
51 overweight or obese patients (age range 14±2 years, 10 females, average BMI: 33.8 kg/m2) who exhibited prolonged elevation of serum alanine aminotransferase (ALT) and/or aspartate aminotransferase (AST) (>50 U/l for at least 3 months) were recruited. Multifrequency MRE (2) was conducted at 1.5 T scanner (Siemens, Magnetom Sonata) using 7 harmonic frequencies (30 to 60 Hz, 5 Hz increment). The 3D wave field was recorded using a single-shot EPI sequence with motion-encoding gradients. Total acquisition time for 9 consecutive slices of 2.7 × 2.7 × 5 mm3 resolution, 7 frequencies, 8 wave dynamics was 5 minutes and 8 seconds. MRE wave data was reconstructed using wavenumber-based inversion as detailed in (3) providing maps of shear wave speed (c) and penetration rate (a) which reflect liver stiffness and tissue damping. respectively. Hepatic fat fraction (HFF) was measured using the Dixon method (4). Liver biopsy was performed for staging fibrosis and steatosis.Results
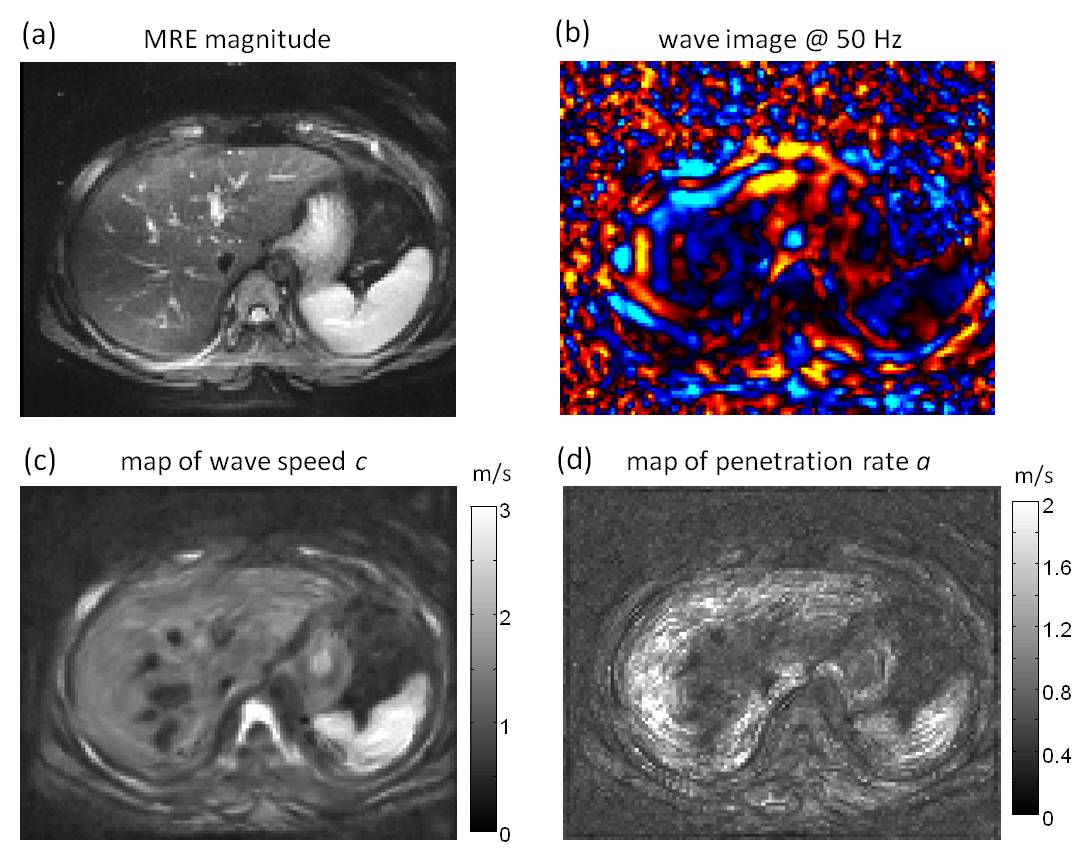
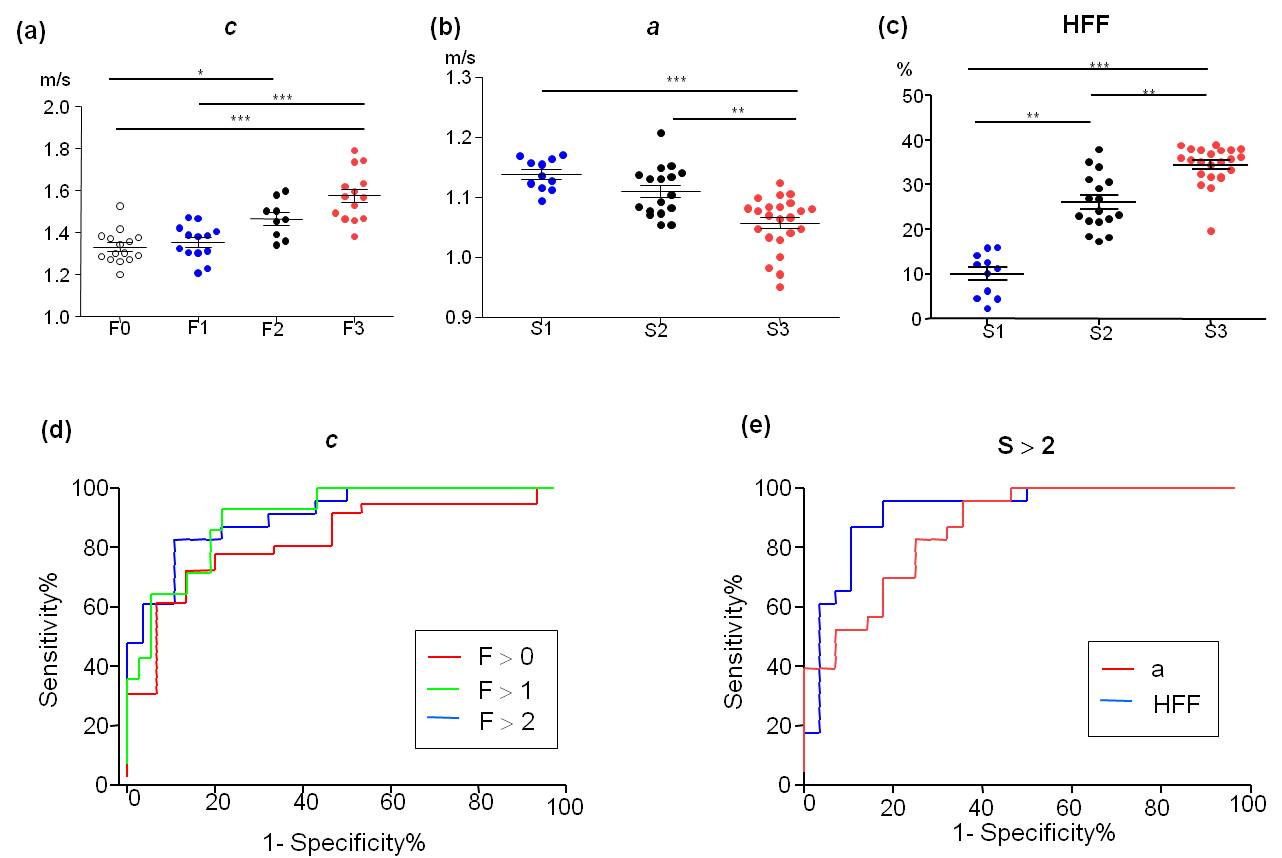
Based on histological staging, 28 subjects had no or early fibrosis, specifically 15 subjects had stage 0 (F0) and 13 subjects had stage 1 (F1) fibrosis. Furthermore, 9 subjects had stage 2 (F2) moderate fibrosis and 14 subjects had advanced fibrosis with stage 3 (F3). Based on the steatosis grade, the patients are divided into 3 groups, with 11, 17 and 23 subjects having steatosis grade 1, 2 and 3 (S1,S2 and S3), respectively. Fig.1 shows MRE magnitude image, shear wave image at 50 Hz drive frequency, map of shear wave speed c and penetration rate a in a central slice of one patient with stage-1 fibrosis. In terms of fibrosis, c was significantly higher in patients with F3 (Fig.2a). c was also used for detecting any fibrosis (F > 0), moderate fibrosis (F > 1) and advanced fibrosis (F > 2) with AUROC-values of 0.82, 0.91 and 0.90, respectively (Fig.2d). Regarding steatosis, a was significantly lower in S3 group (Fig.2b) while HFF was elevated with increasing steatosis grades (Fig.2c). Both a and HFF were used to detect moderate steatosis (S > 2). AUROC-values for a and HFF were 0.86 and 0.92, respectively (Fig 2e). Additionally, a negative correlation between a and HFF (Person r = -0.58, P < 0.0001) was observed.Discussion
In this study, we observed increased hepatic stiffness with progression of fibrosis in pediatric NFALD which agrees to previous reports (5). However, we achieved a better diagnostic accuracy, especially in detecting moderated fibrosis which wasn't possible in (5). In our study, the MRE parameter a was introduced for the first time as a diagnostic marker for detecting hepatic fat content which is a key feature in the NAFLD pathology. With similar diagnostic power as HFF, a could be paired with c, both acquired within the same scan, to increase the diagnostic power of MRE in the disease spectrum NAFLD. Statistical cross-tests of c and a for detecting steatosis and fibrosis revealed that each MRE parameter is only responsive to one distinctive feature of NAFLD.Conclusion
Wave speed values obtained from multifrequency MRE is sensitive in differentiating moderate and advanced fibrosis. Penetration rate as another MRE parameter is able to detect moderate steatosis and is negatively correlated with HFF. Both MRE derived mechanical parameters c and a are independently responsive to pathological feature of NAFLD such as fibrosis and steatosis. The mechanical parameters can potentially serve as a complementary imaging marker for the noninvasive assessment of liver fibrosis and steatosis in patients with NAFLD.Acknowledgements
No acknowledgement found.References
1. Muthupillai R, Ehman RL. Magnetic resonance elastography. Nat Med. 1996;2(5):601-3.
2. Guo J, Buning C, Schott E, et al. In vivo abdominal magnetic resonance elastography for the assessment of portal hypertension before and after transjugular intrahepatic portosystemic shunt implantation. Invest Radiol. 2015;50(5):347-51.
3. Tzschatzsch H, Guo J, Dittmann F, et al. Tomoelastography by multifrequency wave number recovery from time-harmonic propagating shear waves. Med Image Anal. 2016;30:1-10.
4. Dixon WT. Simple proton spectroscopic imaging. Radiology. 1984;153(1):189-94.
5. Schwimmer JB, Behling C, Angeles JE, et al. Magnetic resonance elastography measured shear stiffness as a biomarker of fibrosis in pediatric nonalcoholic fatty liver disease. Hepatology. 2017;66(5):1474-85.
Figures