0518
Automated liver-segment localization and segmental hepatic proton-density fat fraction measurement1Radiology, University of California, San Diego, La Jolla, CA, United States, 2Biomedical Informatic, University of California, San Diego, La Jolla, CA, United States
Synopsis
Hepatic proton-density fat fraction (PDFF) has emerged as an imaging biomarker for liver fat content in non-alcoholic fatty liver disease. To account for the spatial heterogeneity of liver fat, one approach is to manually place a region of interest (ROI) and estimate the PDFF in each hepatic Couinaud segment separately. We trained a convolutional neural network to automatically locate each liver segment and calculate segmental PDFF values. We show that segmental PDFF measurement based on our automated approach closely matches those based on manual placement by a trained image analyst, demonstrating the feasibility of utilizing CNNs to automatically extract clinically valuable quantitative information from source images.
Purpose
MRI-determined proton-density fat fraction (PDFF) is an advanced MRI technique that produces a parametric map of the spatial distribution of hepatic fat.1 It has been shown to be an accurate alternative to liver biopsy to assess severity of liver fat content in non-alcoholic fatty liver disease (NAFLD).1 To account for spatial heterogeneity of liver fat, a common practice is to manually place a region of interest (ROI) and estimate the PDFF in each hepatic Couinaud segment separately.2 However, this manual annotation can be time-consuming, imposing workflow barriers to scaling this technique. Convolutional neural networks (CNNs) are able to perform complex vision tasks such as anatomical landmarks detection on radiographs.3 We hypothesize that a CNN can be trained to reliably localize the hepatic Couinaud segments and accurately measure the segmental hepatic PDFF.Method
Couinaud liver-segment localization
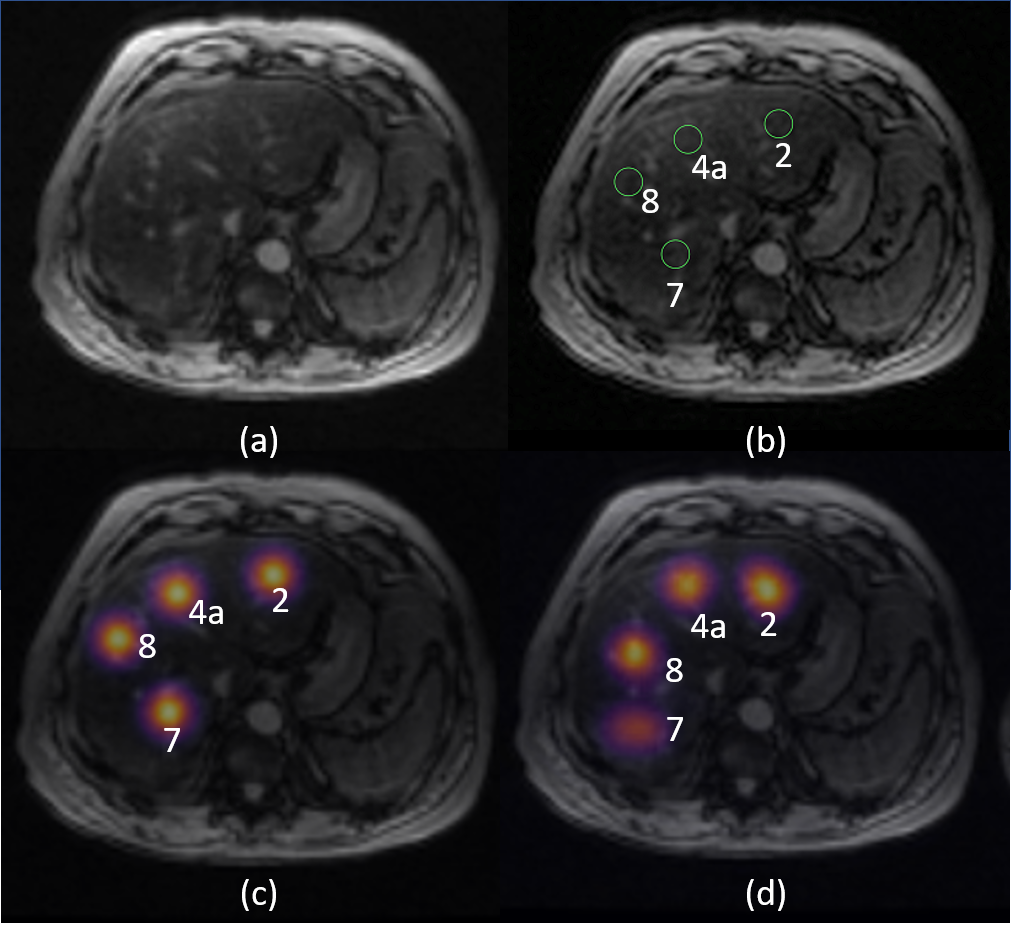
This cross-sectional, retrospective study was approved by IRB and HIPAA-compliant. Image data of 360 patients with known or suspected NAFLD who underwent liver MRI exams at 3T between 2012-2017 were retrospectively collected for training (n=300) and validation (n=60) of a CNN model. Each liver MRI exam included a PDFF map estimated using a low flip angle (10o), multi-echo spoiled gradient recalled echo (SPGR) sequence.4 By visual estimation, a trained image analyst under the supervision of an abdominal radiologist marked the center location of each liver segment on the SPGR images. As an initial step, we limit the development of our CNN model to localize four of the nine Couinaud liver segments (2, 4a, 7, 8). To train the CNN to localize liver segments, we used the heatmap regression approach by Payer et. al. utilizing a 2D U-net architecture.3 In this approach, a heatmap image, representing a Gaussian probability distribution of the center location of each liver segment, was generated. A CNN was trained to predict this targeted heatmap from three consecutive axial multi-echo SPGR images that contains the center location of the aforementioned liver segments. The center location of the liver segments was estimated by finding the location of maximum probability on the predicted heatmap. The euclidean distance between the manually-defined and CNN-predicted center location was measured. The CNN-predicted center location was also visually inspected by an image analyst (6 years of experience) to identify possible misplacement outside the targeted segment.
Segmental PDFF measurement
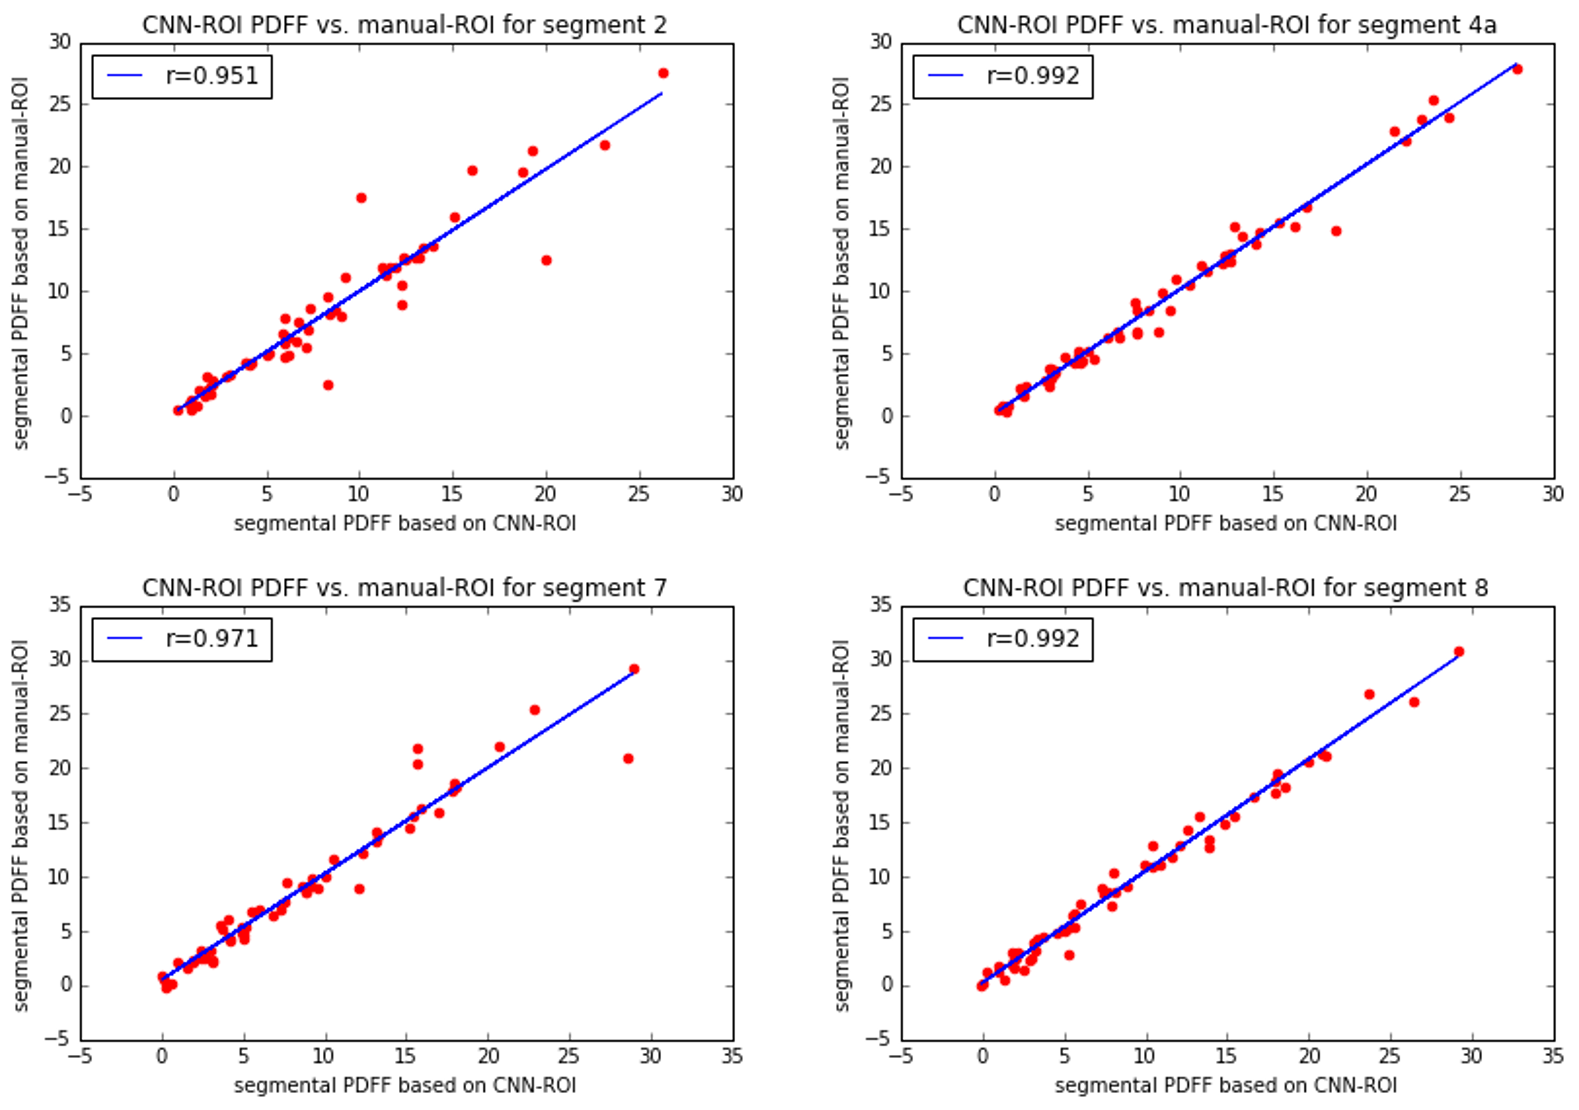
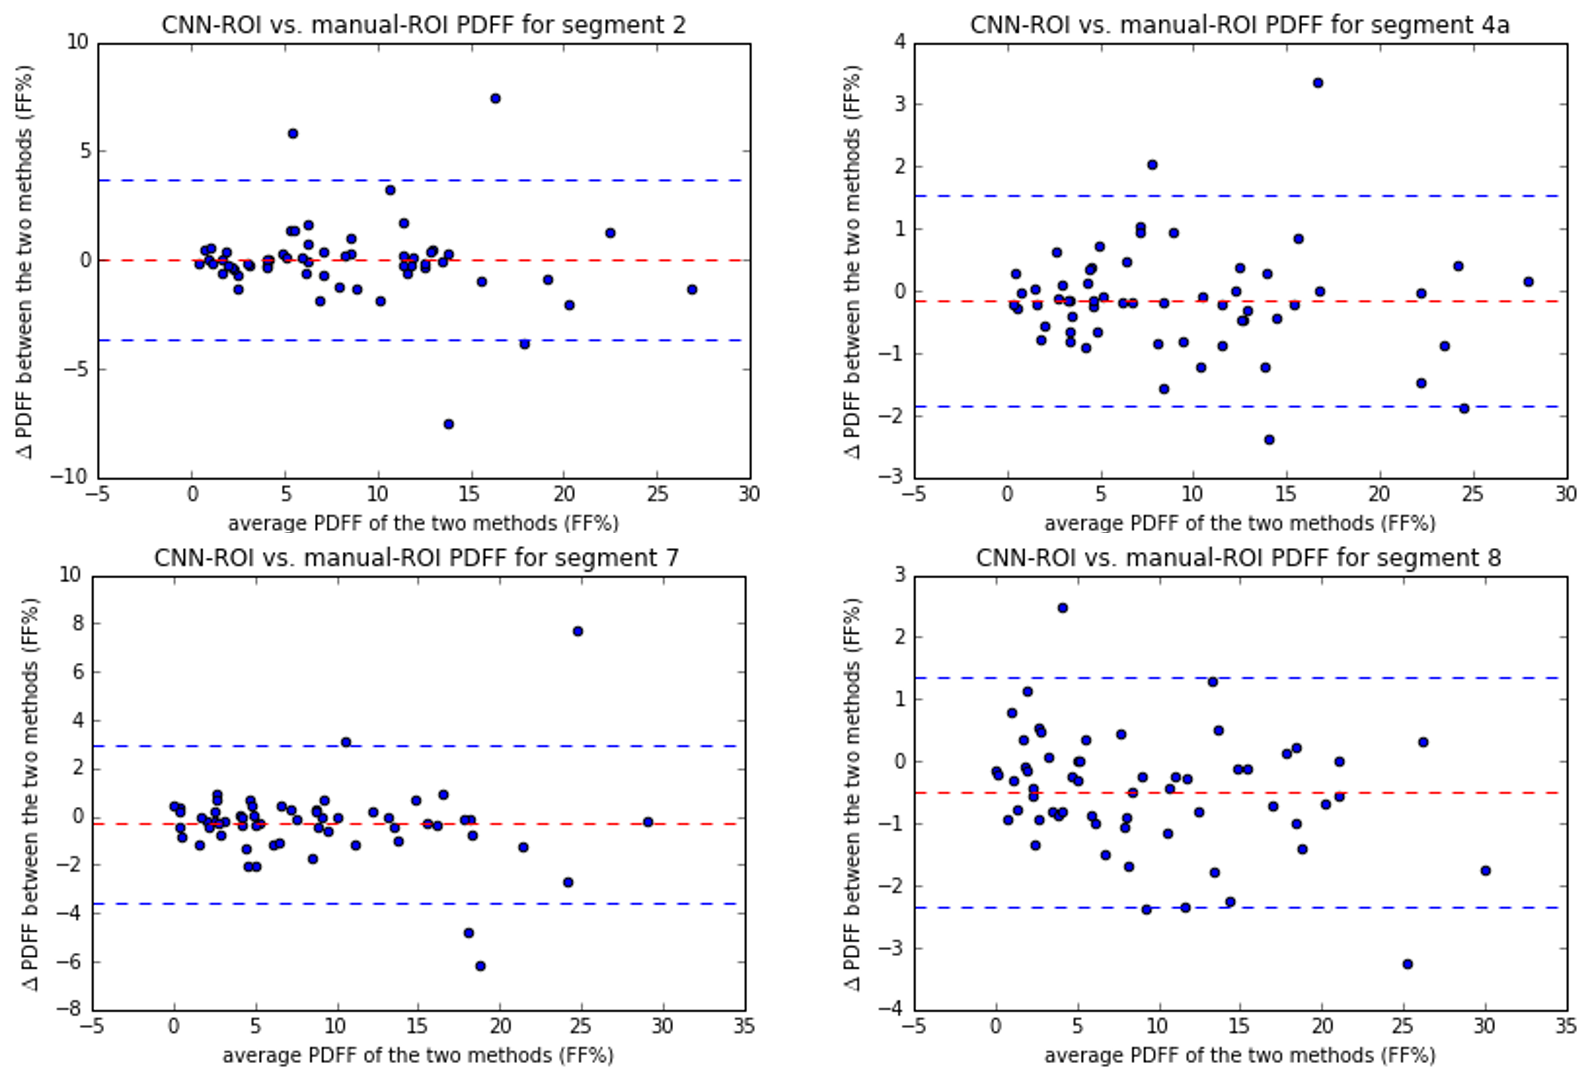
PDFF measurements were made from a circular ROI (diameter=20 mm) placed on the PDFF map. Two PDFF measurements were made based on the location of the ROI, one centered at the manually-defined center location of the liver (manual-ROI PDFF), one centered at the CNN-predicted location (CNN-ROI PDFF). To evaluate for accuracy, manual-ROI PDFF and CNN-ROI PDFF were compared using Pearson correlation and Bland-Altman analysis.
Results
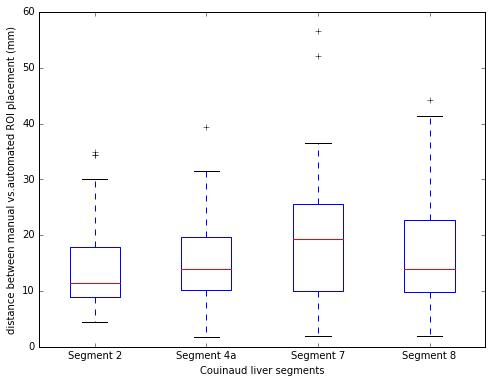
An example of the input SPGR image, the heatmap of the manually-defined and CNN-predicted center location of liver segments are shown in Figure 1. The mean distance between the manually-defined and CNN-predicted center location is 16.2 mm (Figure 2). From visual inspection, we found 20 of 240 (8.3%) center location were misplaced in the incorrect liver segment, but all within the liver. The most frequent error is misplacing segment 4a in segment 2 or vice versa (12/20). The Pearson correlation between CNN-ROI and manual-ROI PDFF ranges from 0.95 to 0.99 (Figure 3). From bland-Altman analysis, the 95% limit of agreement (LoA) ranged from -3.7% to 3.7% (Figure 4).Discussion
The distance between manually-defined and CNN-predicted center location of individual Couinaud segment was small (mean distance 16.2 mm) and the segmental PDFF measured by manual vs. CNN-ROI placement were strongly correlated (overall r=0.98). There was no significant bias between the two methods. The discrepancy in segmental PDFF between the two methods was small, with the largest disagreement in segment 2 (95% LoA = +/- 3.7%). This might be due to inherent greater variability of PDFF values in segment 2.5 The occasional difficulty in distinguishing segment 2/4a may reflect incomplete visualization of the falciform ligament on the multi-echo SPGR pulse sequence -- an anatomical landmark that distinguishes the two segments. The falciform ligament is sometimes only visually apparent on a more inferior slice than the input images. This difficulty might be alleviated if CNN with 3D architecture is used, which may be undertaken in future work.Conclusion
We demonstrate the feasibility of utilizing a CNN to automatically measure segmental PDFF values in segments 2, 4a, 7, 8 in patients with known or suspected NAFLD. Future work is needed to extent the CNN to estimate segmental PDFF values in the other Couinaud segments.Acknowledgements
No acknowledgement found.References
- Yokoo T, Bydder M, Hamilton G, et al. Nonalcoholic Fatty Liver Disease: Diagnostic and Fat-Grading Accuracy of Low-Flip-Angle Multiecho Gradient-Recalled-Echo MR Imaging at 1.5 T. Radiology. 2009;251(1):67-76. doi:10.1148/radiol.2511080666.
- Hepatic fat quantification using the proton density fat fraction (PDFF): utility of free-drawn-PDFF with a large coverage area. Radiol Med. 2015 Dec;120(12):1083-93. doi: 10.1007/s11547-015-0545-x. Epub 2015 May 8.
- Payer, Christian, Darko Stern, Horst Bischof and Martin Urschler. “Regressing Heatmaps for Multiple Landmark Localization Using CNNs.” MICCAI (2016).
- Bonekamp S, Tang A, Mashhood A, et al. Spatial Distribution of MRI-Determined Hepatic Proton Density Fat Fraction in Adults with Nonalcoholic Fatty Liver Disease. Journal of magnetic resonance imaging : JMRI. 2014;39(6):1525-1532.
- Yokoo T, Shiehmorteza M, Hamilton G, et al. Estimation of Hepatic Proton-Density Fat Fraction by Using MR Imaging at 3.0 T. Radiology. 2011;258(3):749-759.
Figures