0515
Estimating Liver Water and Fat T1 and T2, and PDFF using Flip Angle Corrected Multi-TR, Multi-TE 1H MRS1Liver Imaging Group, Department of Radiology, University of California, San Diego, La Jolla, CA, United States, 2NAFLD Research Center, Division of Gastroenterology, Department of Medicine, University of California, San Diego, La Jolla, CA, United States
Synopsis
Multi-TR, multi-TE (MTRTE) 1H MRS estimates T1 and T2 of fat and water and liver proton density fat fraction (PDFF) in a single breath-hold by assuming a perfect 90° pulse, which is not guaranteed in vivo and may introduce bias. We introduce a flip angle corrected multi-TR, multi-TE (FAC MTRTE) 1H MRS sequence based on a non-steady state approach and compare the T1, T2, and PDFF given by MTRTE and FAC MTRTE MRS. T1 estimates given by MTRTE MRS and FAC MTRTE MRS were significantly different, due to the MTRTE sequence not being acquired with a perfect 90° flip.
Introduction
In vivo liver multi-TR, multi-TE (MTRTE) 1H MR spectroscopy has previously been used to estimate the T1 and T2 of fat and water and the proton density fat fraction (PDFF) in a single breath-hold1. This approach uses a steady state solution, which assumes that a perfect 90° pulse is generated. For in vivo liver MRS this perfect 90° pulse is not guaranteed, which may introduce errors in the steady state solution. Alternatively, using a non-steady state approach allows the flip angle to be estimated, giving flip angle corrected T1 and T2 estimates. In this study we compare the T1, T2, and PDFF given by the standard MTRTE and a flip angle corrected version of the multi-TR, multi-TE 1H MRS sequence (FAC MTRTE) based on a non-steady state approach and we see if differences in flip angle introduce biases in the MTRTE data.Sequence Design
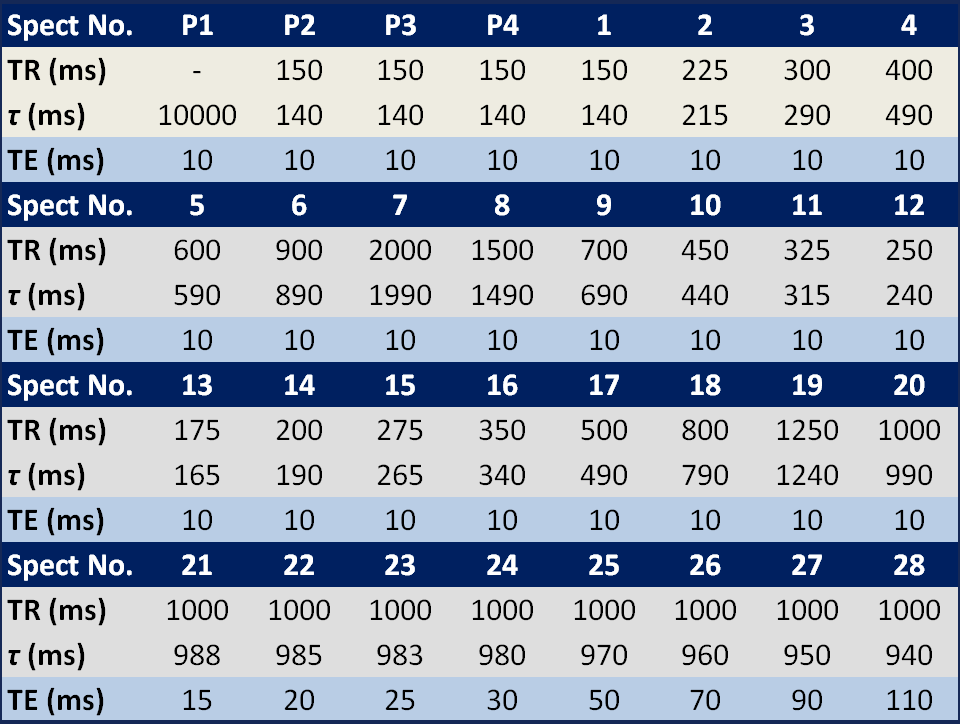
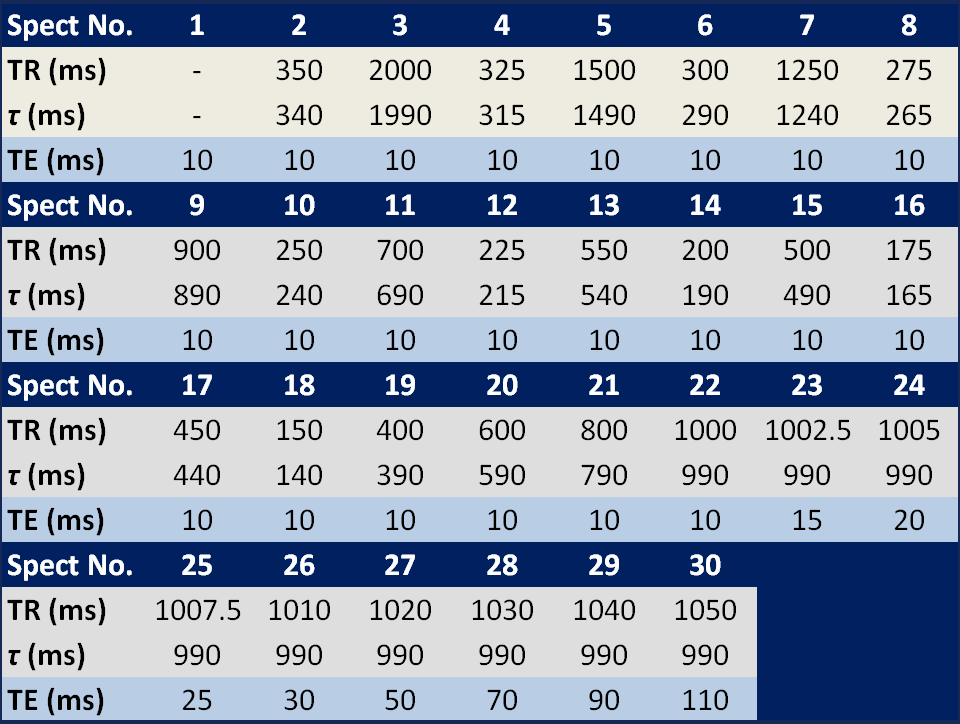
Both MTRTE and FAC MTRTE acquire multiple STEAM sequences in a single 21 second acquisition. MTRTE acquires 32 spectra, whereas FAC MTRTE acquires 30 spectra. The timings of the two sequences are shown in table 1 and table 2. Whilst MTRTE has pre-pulses (P1-P4) in table 1 to get to equilibrium, these are not required for FAC MTRTE. In FAC MTRTE, there are large changes in consecutive TRs to maximize non-steady conditions allowing estimation of flip angle. To estimate T1 and T2, MTRTE non-linearly fitted the measured peaks area to the signal (Sn) using the standard steady state equation $$S_{n}=M_{0}(1-e^{(-\tau_{n}/T1)})e^{(-TE_{n}/T2)}$$ where τn and TEn are given in table 1. To estimate T1 and T2 for FAC MTRTE, the longitudinal magnetization at each acquisition (Mn) was calculated by $$ M_{n}=M_{n-1}e^{(-\tau_{n}/T1)}\cos(\alpha)+M_{0}(1-e^{(-\tau_{n}/T1)})$$ with the signal given by $$S_{n}=M_{n}e^{(-TE_{n}/T2)}\sin(\alpha)$$ where α is the flip angle, M0 the equilibrium longitudinal magnetization, and τn and TEn are given in table 2. The calculated signals for each acquisition are then non-linearly fitted to the measured peak areas.
Methods
The study was IRB and HIPAA compliant, with subjects giving written informed consent. MTRTE and FAC MTRTE spectra were acquired on 57 adult subjects (mean age 58 yrs, range 22-81 yrs, 21 male, 36 female), with known or suspected non-alcoholic fatty liver disease, at 3 Tesla (GE Signa EXCITE HD, GE Healthcare, Waukesha, WI) using an 8-channel torso array coil. The MTRTE and FAC MTRTE acquisitions were acquired consecutively in the same 20x20x20 mm voxel within the liver, selected to avoid major blood vessels and liver edges. No spatial or chemical saturation was used. If possible, the transmitter gain (TG), which determines the amount of power required to generate a true 90° flip, was set automatically by the scanner for both sequences. If the pre-scan failed to set a value, the TG was set manually, using a value from a previous MRI sequence where the imaging volume contained the voxel. Signals from different array elements were combined using an SVD technique2 and a single experienced observer analyzed the spectra using the AMARES algorithm3 included in the MRUI software package4. PDFF was estimated as the ratio of fat signal to the sum of water and fat signals, adjusted for fat included in the 'water' peak from a previously established standard liver spectrum5. The estimates of water T1, T2 and PDFF were compared graphically and using paired t-tests for the two sequences to see if errors in flip angle were introducing possible biases in these estimates.Results
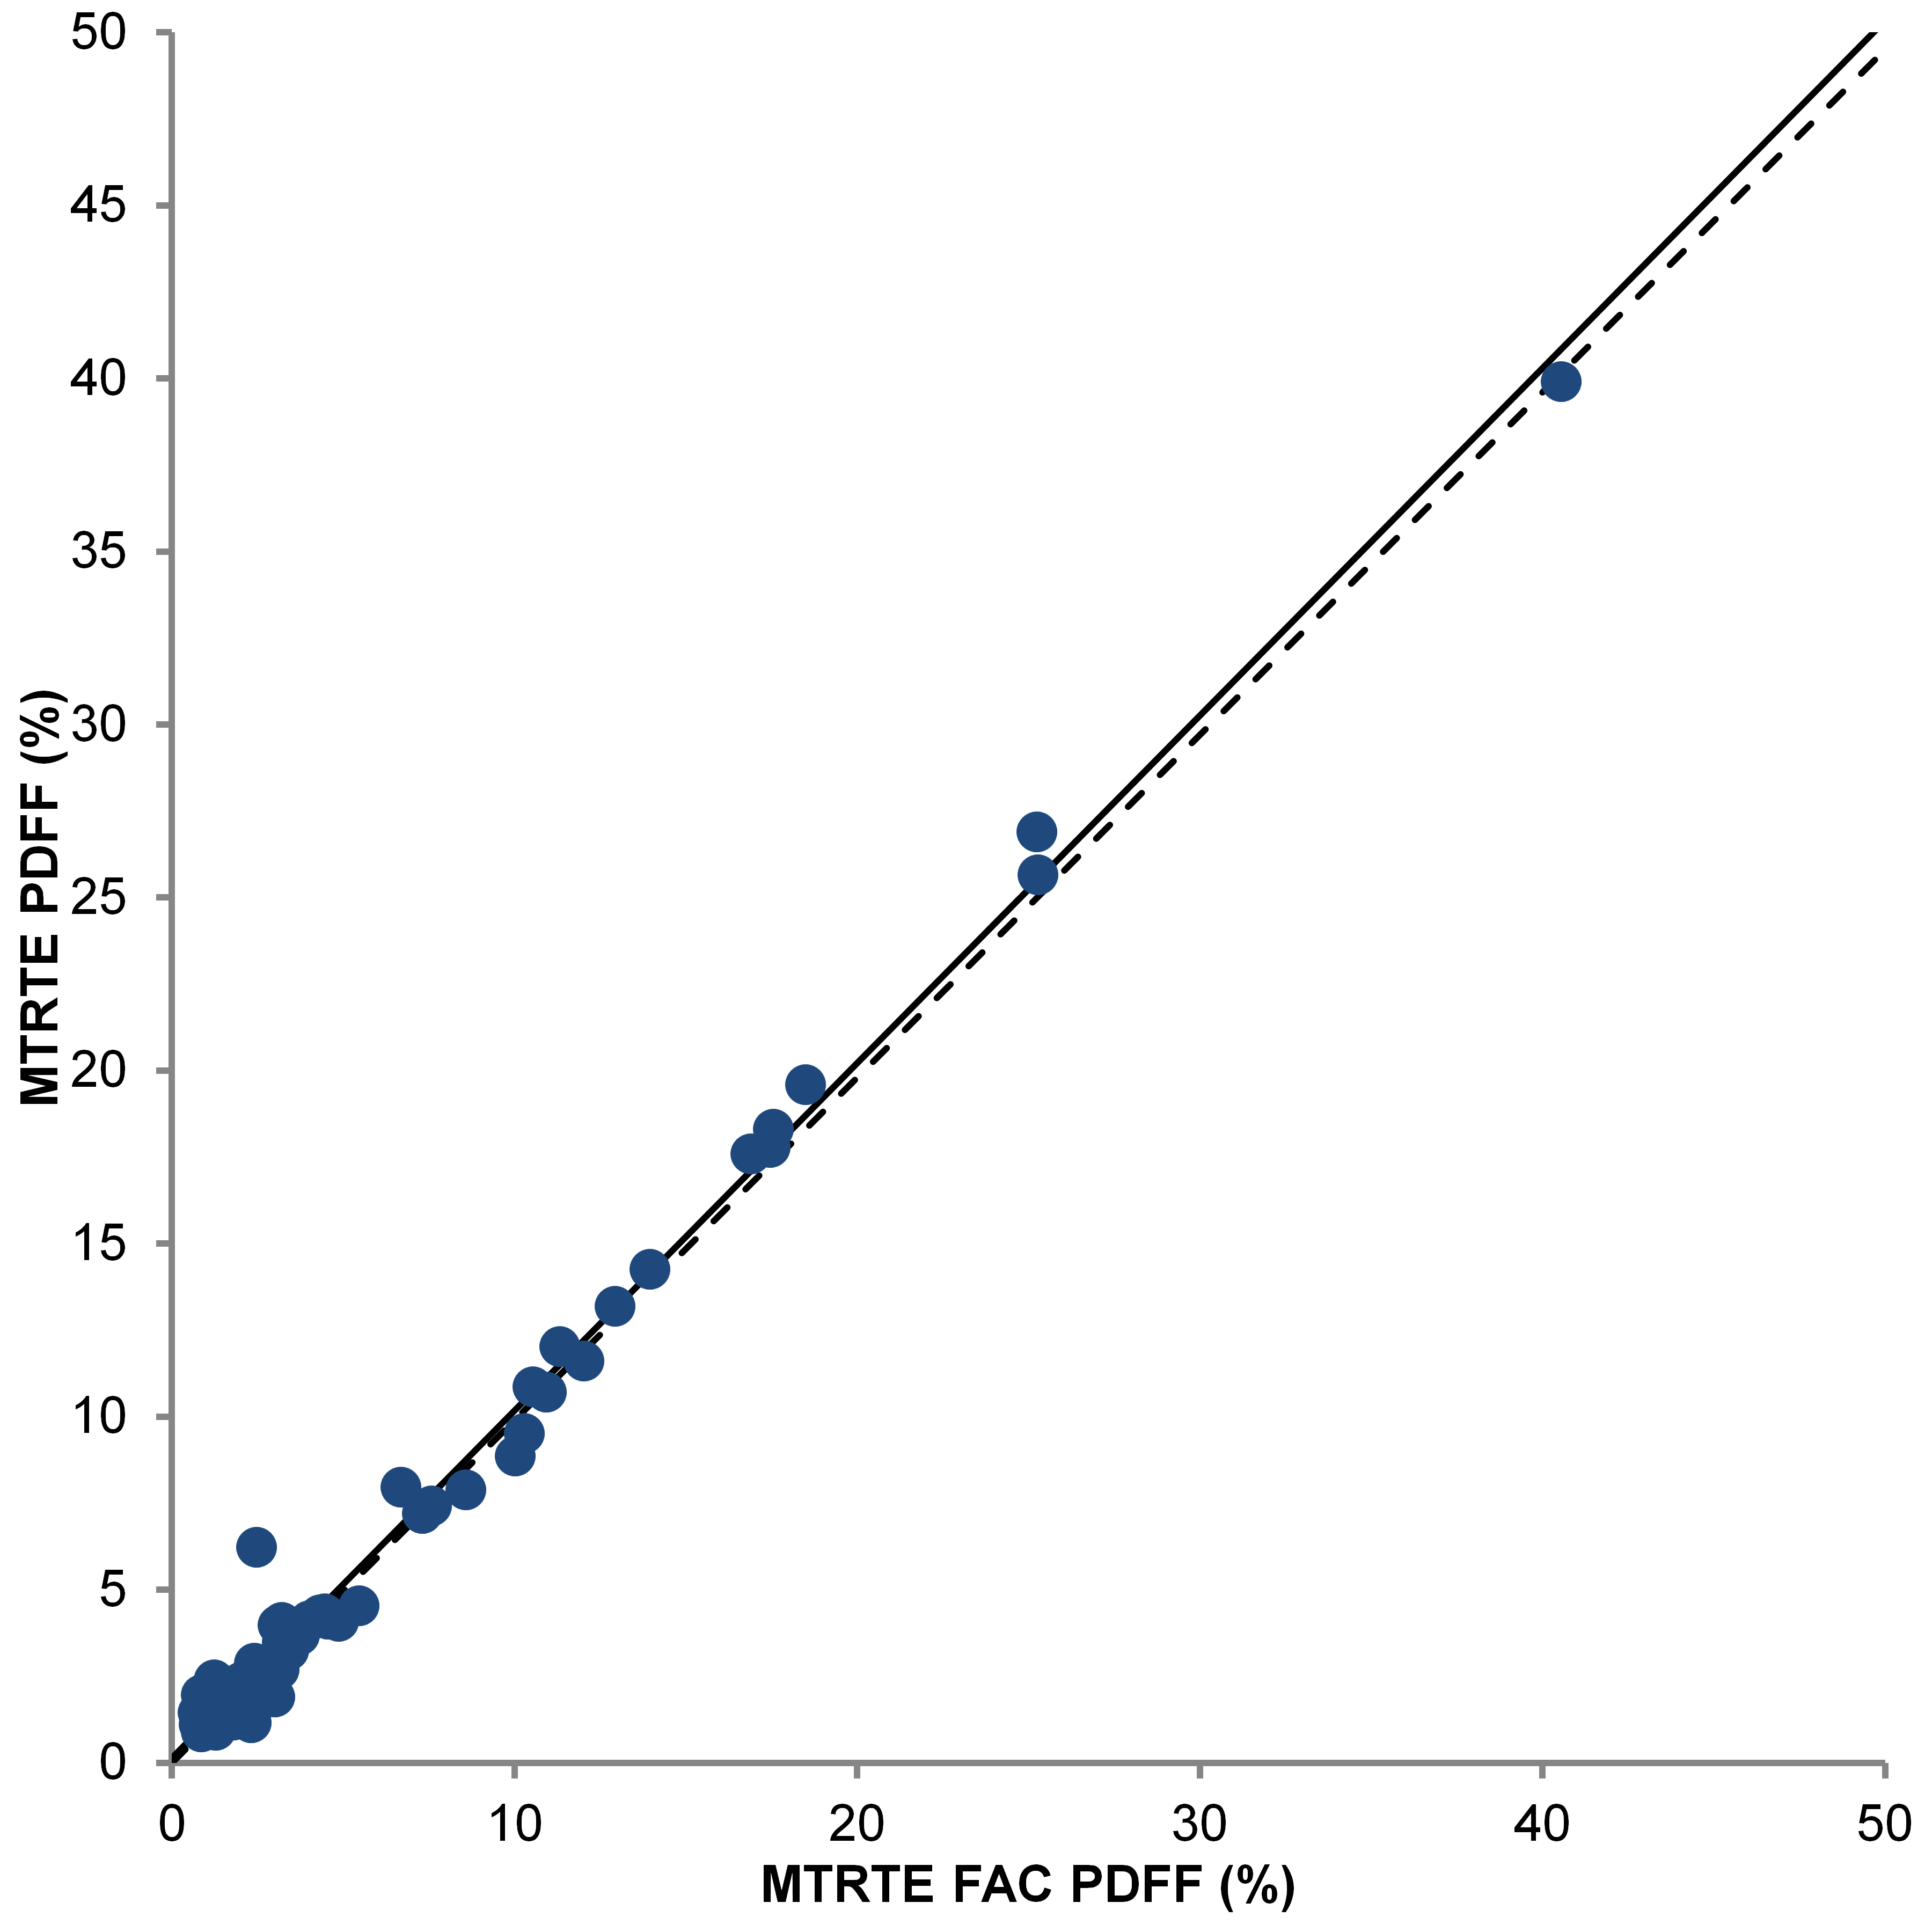
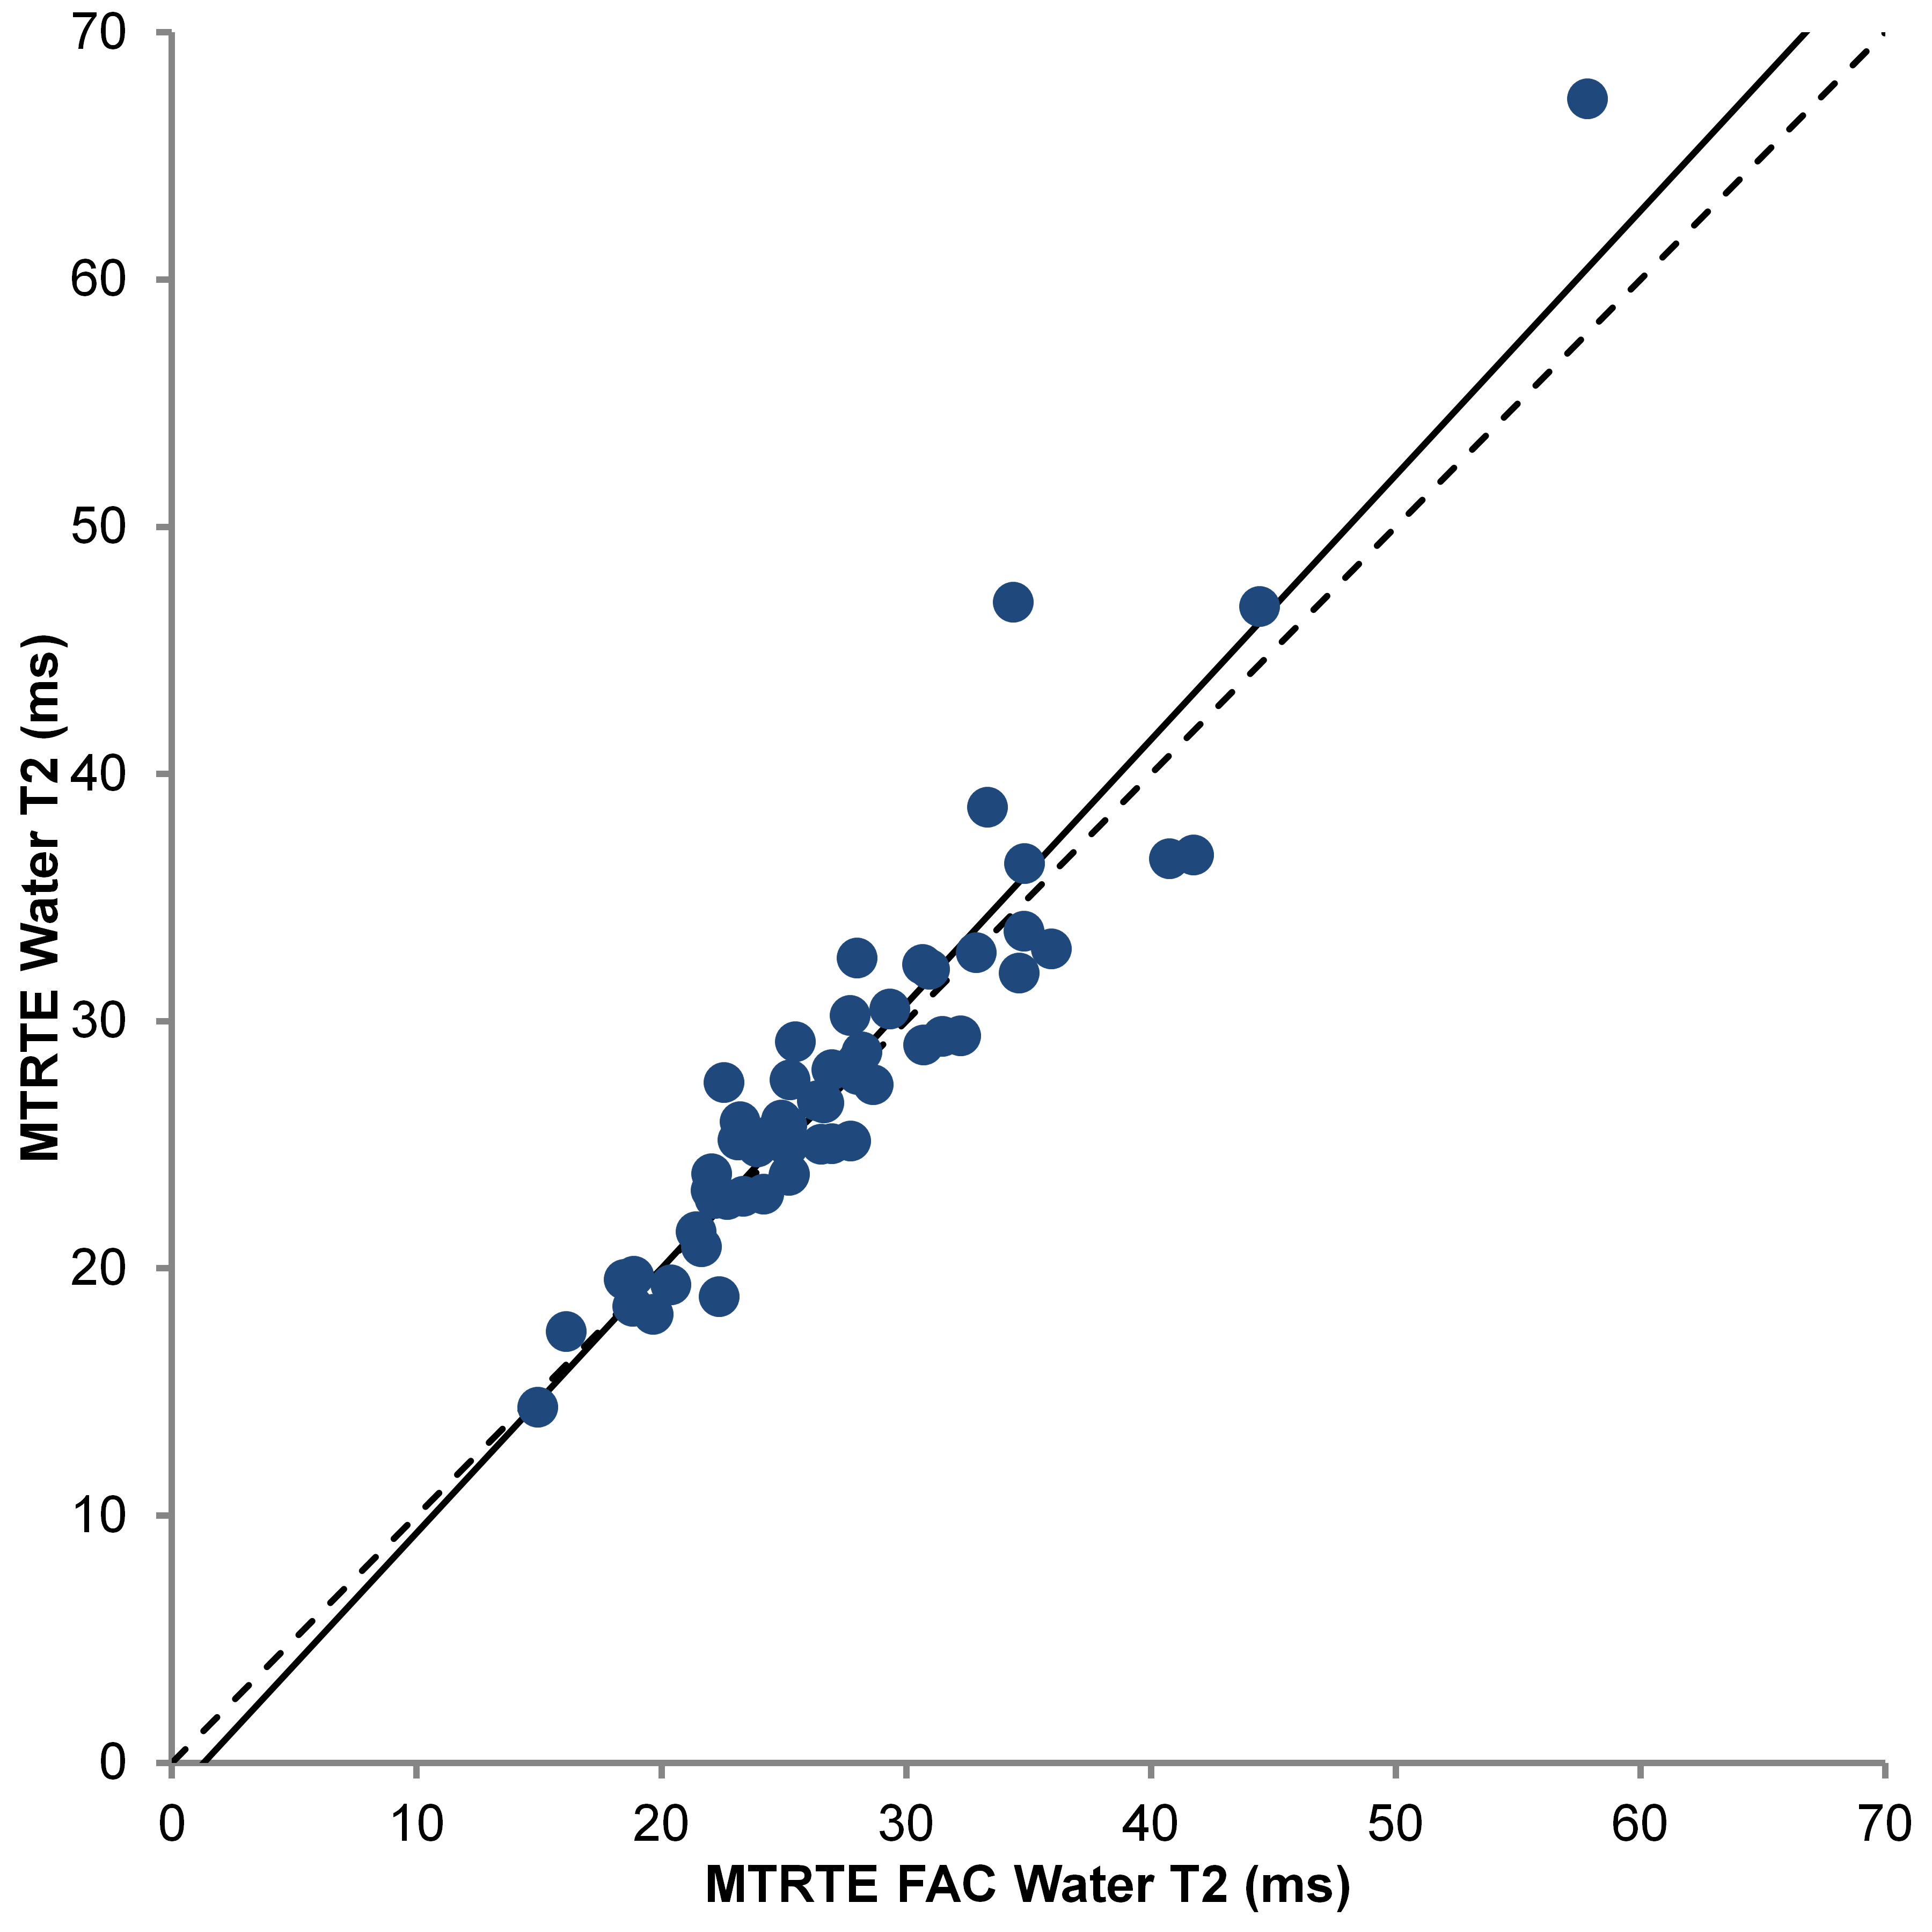
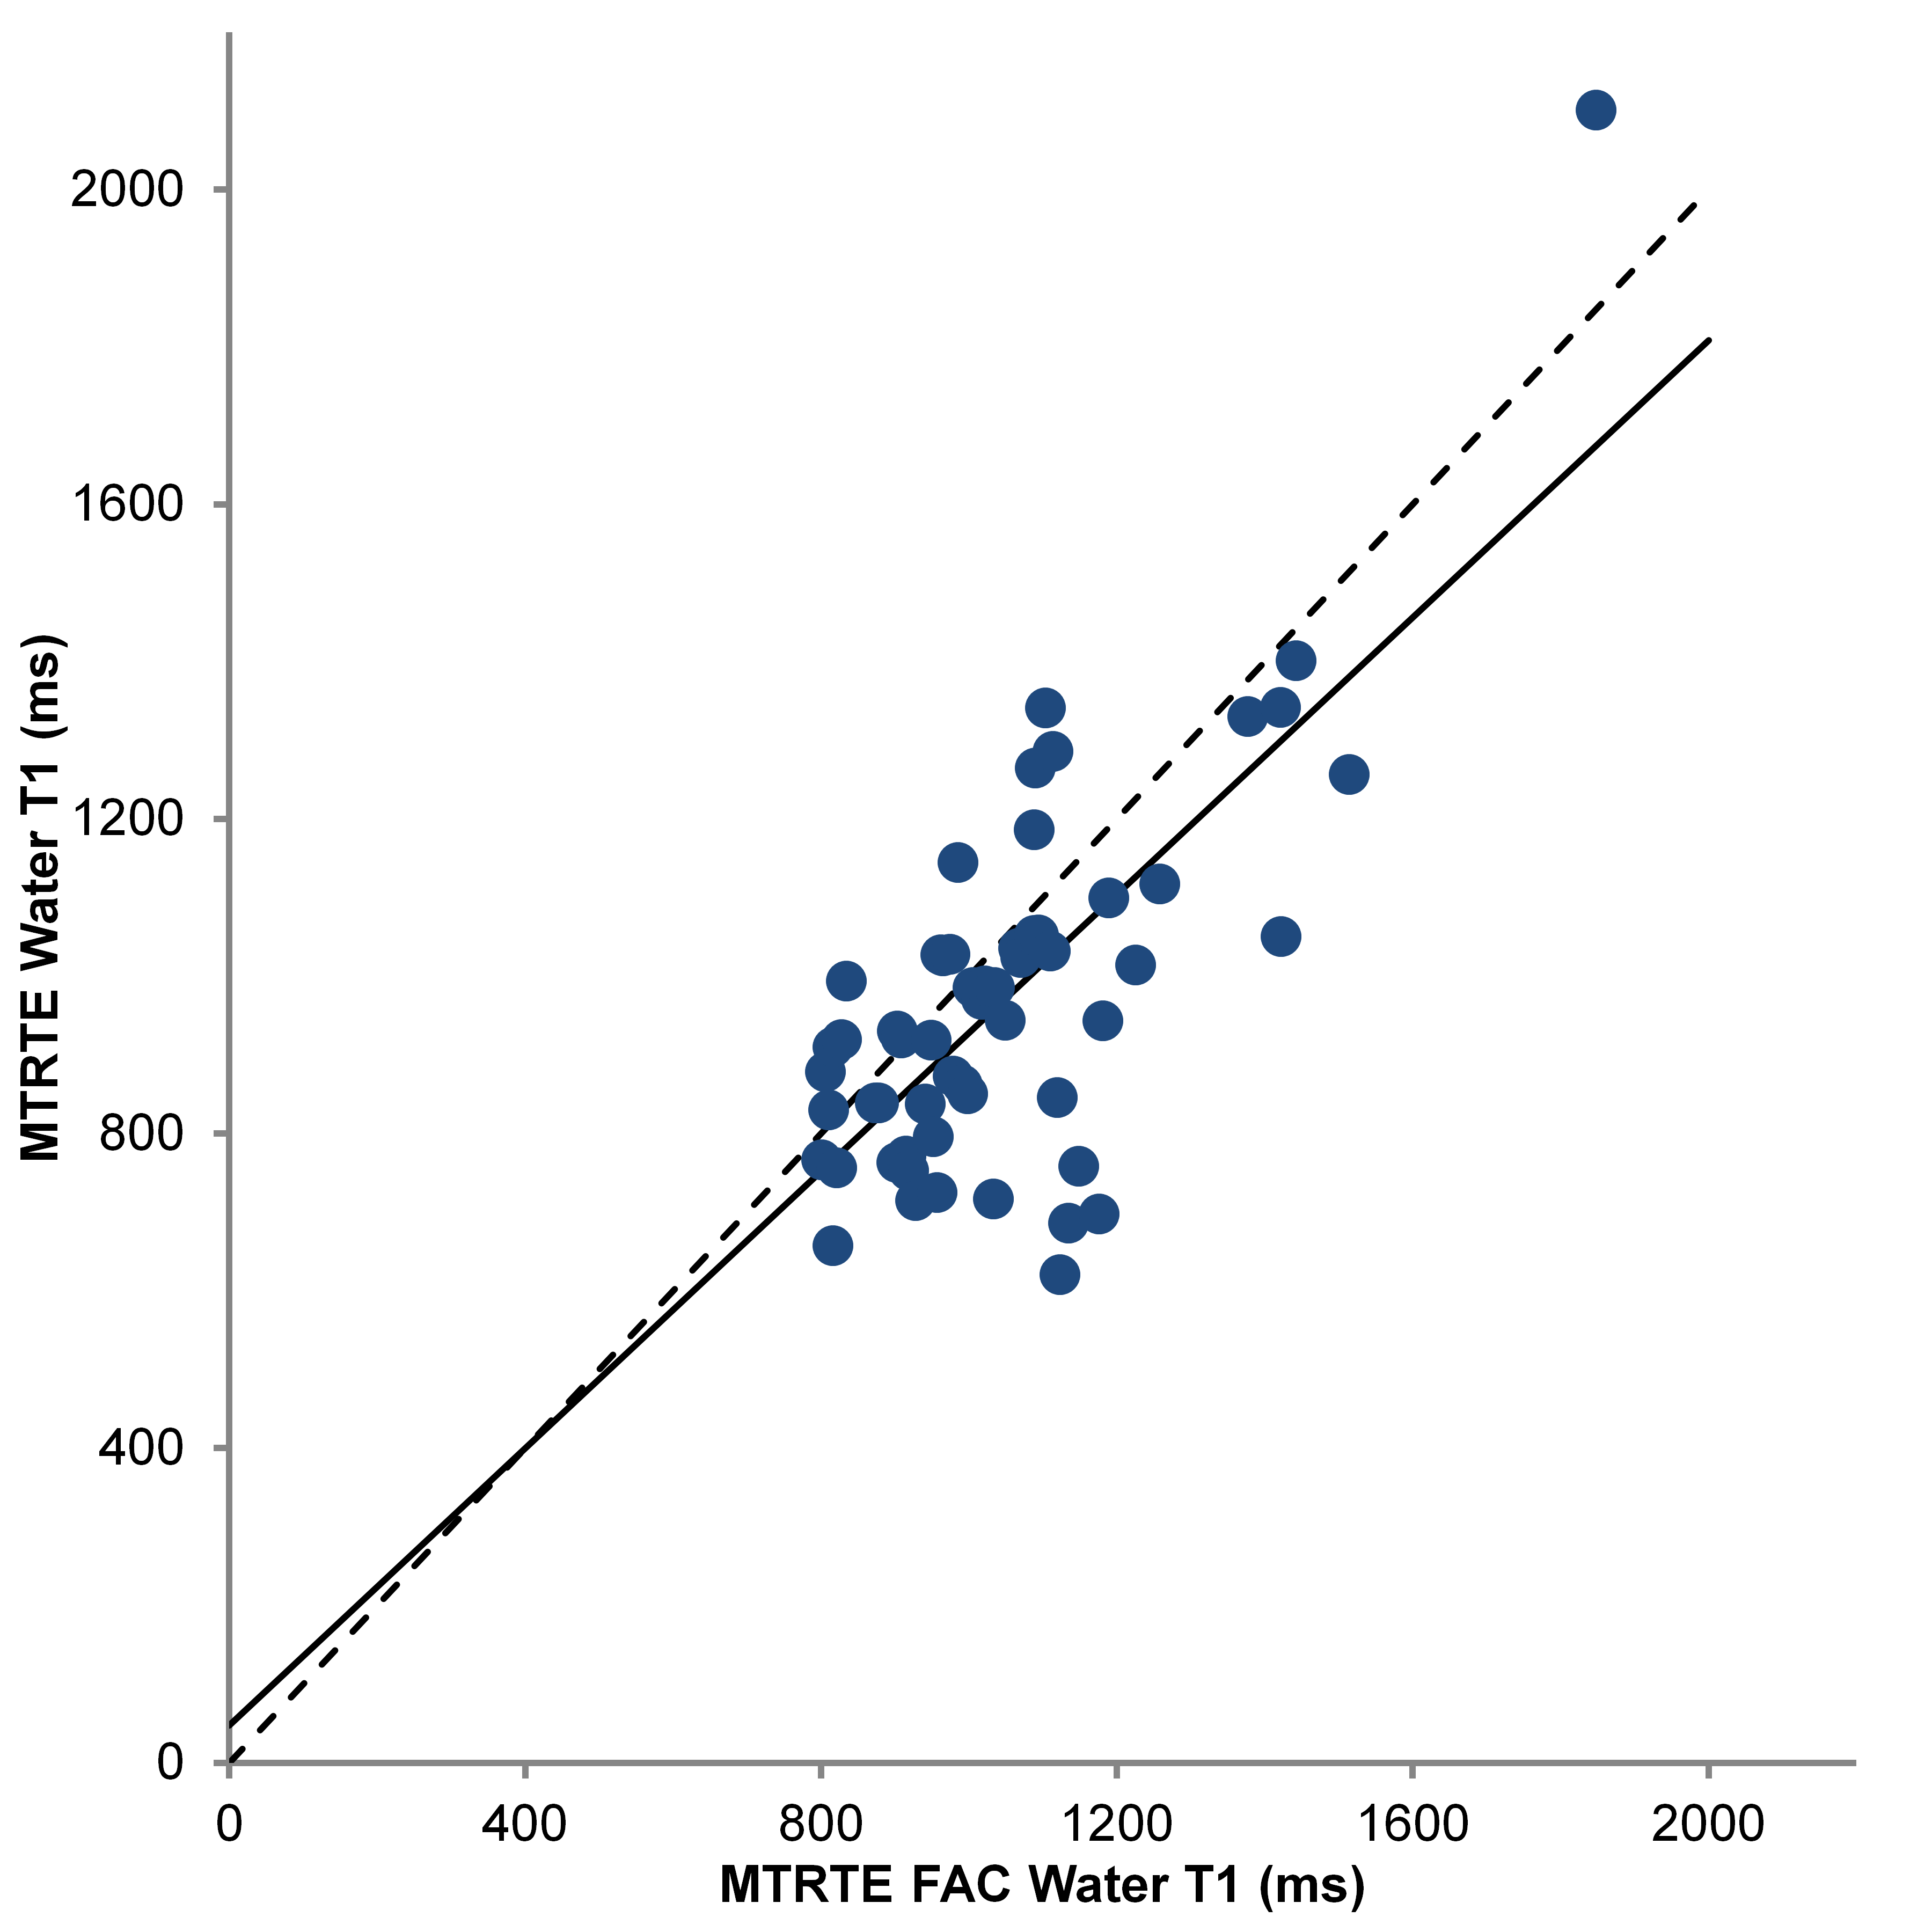
Figure 1 compares the PDFF estimated by MTRTE and FAC MTRTE, while figures 2 and 3 compare the same for water T2 and T1. There was no significant difference between the two estimates of PDFF (y = 1.004x + 0.14) or water T2 (y = 1.07x – 1.40). However there was significant difference between estimates of water T1 (mean water T1 MTRTE 973 ms, FAC MTRTE: 1052 ms, p < 0.001, y = 0.881x + 47). FAC MTRTE found the mean flip angle of the acquisition was 82.2°.Conclusion
There was a difference between the T1 estimates given by MTRTE MRS and FAC MTRTE MRS. FAC MTRTE observed a mean flip angle lower than 90° suggesting that the bias seen in the two sequences was due to the MTRTE sequence not being acquired with a perfect 90° flip. Water T2 and PDFF were unaffected by the flip angle deviating from 90°.Acknowledgements
No acknowledgement found.References
- Hamilton G, Middleton MS, Hooker JC, et al. In vivo breath-hold 1H MRS simultaneous estimation of liver proton density fat fraction, and T1 and T2 of water and fat, with a multi-TR, multi-TE sequence. J Magn Reson Imaging 2015; 42: 1538-1543.
- Bydder M, Hamilton G, Yokoo T, Sirlin CB. Optimal phased-array combination for spectroscopy. Magn Reson Imaging 2008;26:847-850
- Vanhamme L, van den Boogaart A, Van Huffel S. Improved method for accurate and efficient quantification of MRS data with use of prior knowledge. J Magn Reson 1997;129:35-43
- Naressi A, Couturier C, Devos J, et al. Java-based graphical user interface for the MRUI quantitation package. MAGMA 2001;12:141-152.
- Hamilton G, Yokoo T, Bydder M, et al. In vivo characterization of the liver fat 1H MR spectrum. NMR Biomed 2011;24:784-790
Figures