0514
Liver R2* as a Biomarker of Liver Iron Concentration: Interim Results from a Multi-Center, Multi-Vendor Reproducibility Study at 1.5T and 3T1Radiology, University of Wisconsin-Madison, Madison, WI, United States, 2Medical Physics, University of Wisconsin-Madison, Madison, WI, United States, 3Global MR Applications & Workflow, GE Healthcare, Menlo Park, CA, United States, 4Radiology, The Johns Hopkins University, Baltimore, MD, United States, 5Siemens Healthineers, Baltimore, MD, United States, 6Radiology, University of Texas Southwestern Medical Center, Dallas, TX, United States, 7Radiology, Technical University of Munich, Munich, Germany, 8Siemens Healthineers, Los Angeles, CA, United States, 9Medicine, University of Wisconsin-Madison, Madison, WI, United States, 10Radiology, Stanford University, Stanford, CA, United States, 11Advanced Imaging Research Center, University of Texas Southwestern Medical Center, Dallas, TX, United States, 12Biomedical Engineering, University of Wisconsin-Madison, Madison, WI, United States, 13Emergency Medicine, University of Wisconsin-Madison, Madison, WI, United States
Synopsis
R2* is a promising biomarker of liver iron concentration (LIC), with application in the assessment of iron overload. Previous works have demonstrated the high correlation of liver R2* with biopsy-determined LIC. Although R2* measurements may be affected by multiple confounding factors, including the presence of fat and noise bias, confounder-corrected R2* mapping has been shown to be highly insensitive to the presence of these confounding factors. However, the multi-center reproducibility of confounder-corrected R2* for liver iron quantification remains unknown. This abstract demonstrates excellent reproducibility of R2* for liver iron quantification in a multi-center, multi-vendor study at both 1.5T and 3T.
Introduction
R2* is a promising biomarker of liver iron concentration (LIC), with important application in the diagnosis and treatment monitoring of iron overload. Previous works have demonstrated the high correlation of liver R2* with biopsy-determined LIC [1, 2]. However, R2* measurements may be affected by a number of confounding factors, including the presence of fat, noise bias, and susceptibility effects [3]. Recent works have demonstrated the insensitivity of confounder-corrected R2* mapping to the presence of fat and noise bias over a wide range of R2* values [4, 5].
However, the reproducibility [6, 7] of confounder-corrected R2* for liver iron quantification remains unknown. Therefore, the purpose of this work is to determine the reproducibility of confounder-corrected R2* for liver iron quantification across multiple sites, vendors, field strengths and platforms. This abstract reports the interim reproducibility results from an NIH sponsored multi-center liver iron quantification study.
Methods
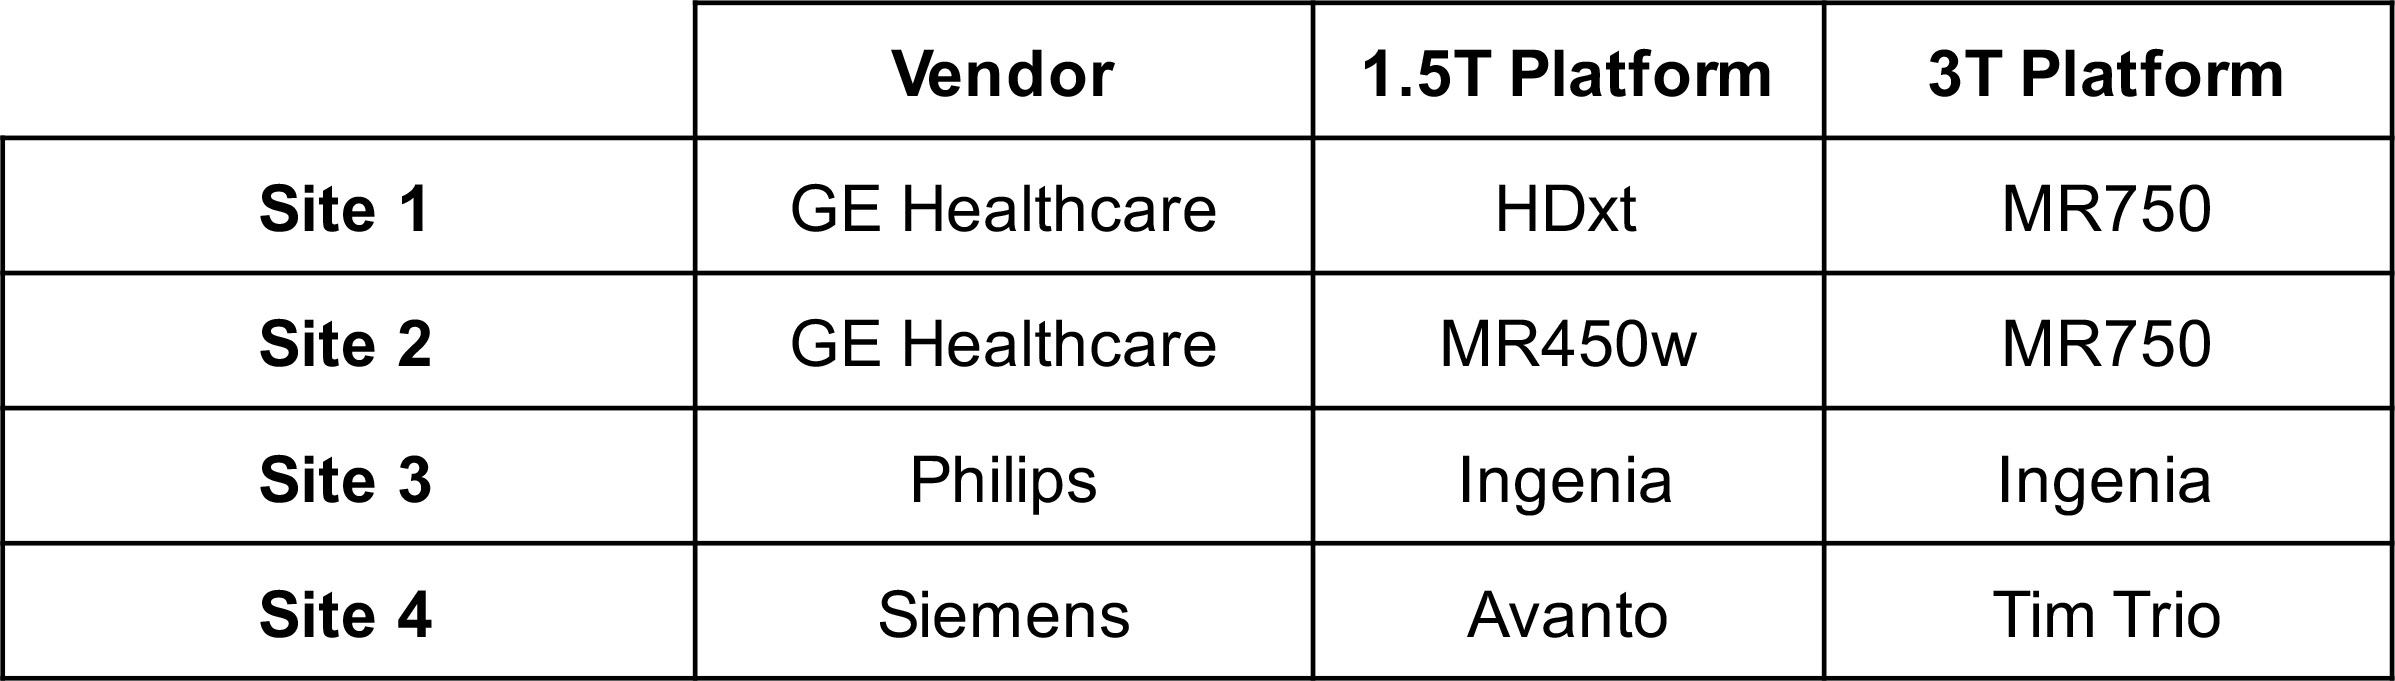
Study description: This IRB-approved multi-center study includes four sites and three MRI scanner vendors (see Table 1). At each site, patients with known or suspected iron overload are recruited upon informed written consent.
MRI acquisition: A previously calibrated, FDA-approved single-spin-echo R2-based technique at 1.5T (FerriScan, Resonance Health, Australia) was used at each site to provide a common reference for LIC [8]. Additionally, multi-echo 3D spoiled gradient-echo (SGRE) data were acquired at both 1.5T and 3T for R2* mapping at both field strengths. SGRE data were acquired with an approximately matched protocol across all sites, including: slice thickness = 8mm, flip angle = 12° (1.5T)/ 9° (3T), number of echoes = 12 (1.5T) / 8 (3T), TE1=0.8ms (1.5T) /0.7ms (3T), ΔTE= 0.8ms (1.5T) / 0.7ms (3T), TR = 9.0ms (1.5T)/6.0ms (3T). SGRE data were sent to Site 1 for centralized processing.
R2* mapping and measurement: Complex-fitting (ie: to avoid noise bias), fat-corrected (ie: including fat-water separation) R2* mapping was performed from the SGRE data using a common centralized algorithm for data from each site and field strength [4]. Additionally, fat-uncorrected R2* mapping was performed in patients with high R2* (>500 s-1 at 1.5T, >1000 s-1 at 3T) to avoid instability and bias. Measurements of liver R2* were performed using a single region of interest (ROI) approximately co-localized with the ROI used in the FerriScan LIC report.
Data analysis: The relationship between liver R2* and FerriScan-LIC was assessed for all of the patients over all four sites using a mixed model linear regression analysis, in order to assess the overall calibration as well as the effect of site/platform on the R2*-LIC calibration. This analysis was performed separately for R2* obtained from 1.5T and 3T scans. Finally, the field strength dependence of R2* (comparison of R2* at 1.5T versus 3T) was similarly assessed over all sites using mixed model linear regression.
Results
A total of 96 patients have been included in this interim report (Site 1: 27 patients, 19/8 M/F, 45.4±20.0 years old, Site 2: 32 patients, 18/14 M/F, 20.8±15.9 years old, Site 3: 22 patients, 15/7 M/F, 48.0±16.2 years old, Site 4: 15 patients, 8/7 M/F, 22.4±11.3 years old).
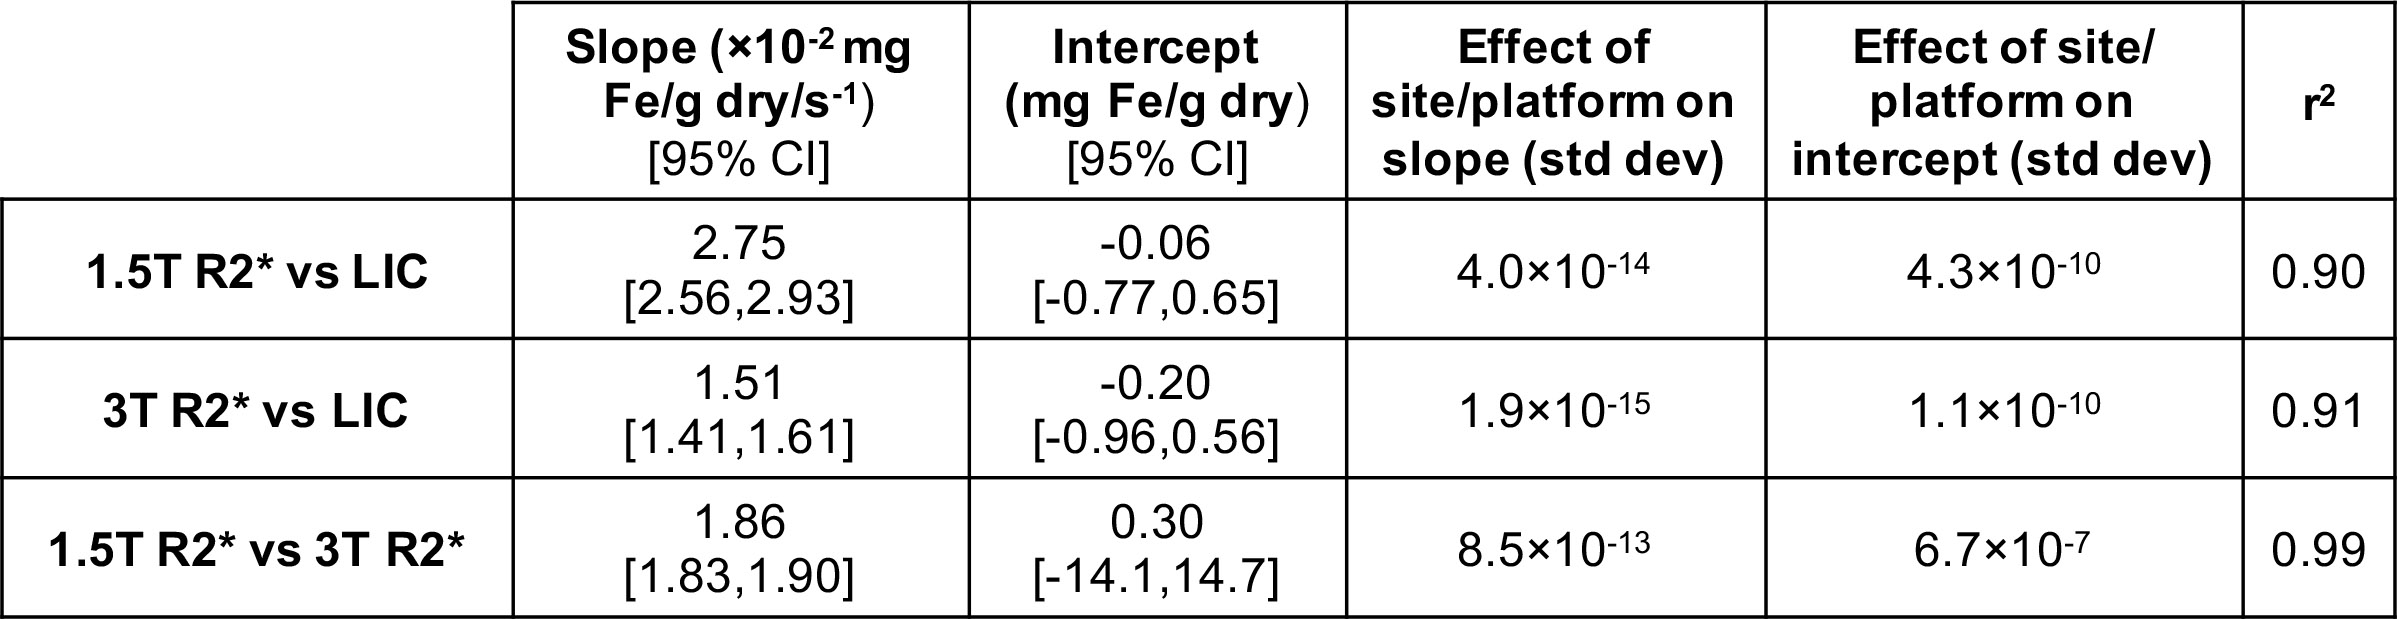
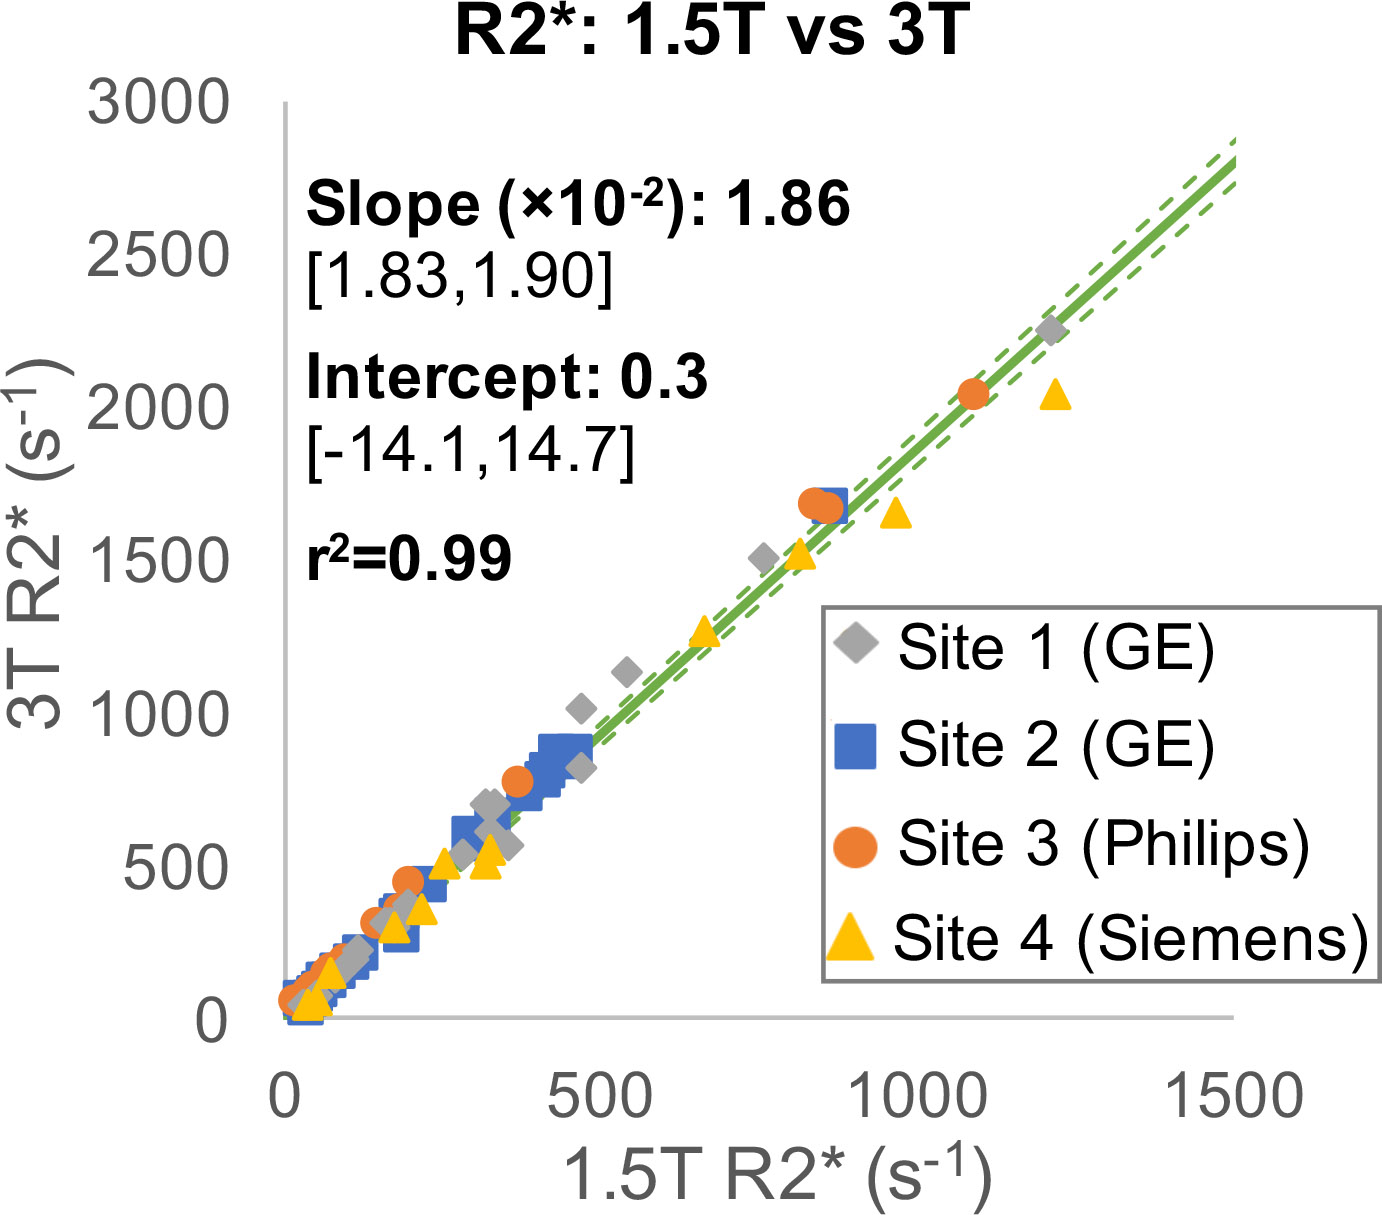
Strong multi-center correlation was observed between 1.5T R2* and LIC (r2=0.90, Figure 1A) as well as between 3T R2* and LIC (r2=0.91, Figure 1B). For each field strength, the effect of site/plaftorm on the slope or intercept of the correlation between R2* and LIC was negligible (σ<10-9, see Table 2). Further, a very strong correlation was observed between 1.5T R2* and 3T R2* (r2=0.99, Figure 2), also with negligible effect of site/platform on the slope or intercept (σ<10-6, see Table 2).
Discussion
These results demonstrate excellent reproducibility of R2* for liver iron quantification in a multi-center, multi-vendor study at both 1.5T and 3T, and may enable the use of a unified (although field strength dependent) calibration between confounder-corrected R2* and LIC. This multi-center study has several limitations, including the inability to exactly match patient populations and acquisition protocols across sites and vendors. Nevertheless, the excellent reproducibility observed across various patient populations and approximately matched acquisition protocols underscores the reproducibility of confounder-corrected R2* for liver iron quantification.Acknowledgements
The authors wish to acknowledge support from the NIH (UL1TR00427, R01 DK083380, R01 DK088925, R01 DK100651, and K24 DK102595). The authors also acknowledge GE Healthcare who provides research support to the University of Wisconsin-Madison and Stanford University, Philips Healthcare who provides research support to the University of Texas-Southwestern, and Siemens Healthcare who provides research support to Johns Hopkins University.References
1. Hankins, J.S., et al., R2* magnetic resonance imaging of the liver in patients with iron overload. Blood, 2009. 113(20): p. 4853-5.
2. Wood, J.C., et al., MRI R2 and R2* mapping accurately estimates hepatic iron concentration in transfusion-dependent thalassemia and sickle cell disease patients. Blood, 2005. 106(4): p. 1460-5.
3. Hernando, D., et al., Quantification of liver iron with MRI: State of the art and remaining challenges. J Magn Reson Imaging, 2014. 40(5): p. 1003-1021.
4. Hernando, D., H.J. Kramer, and S.B. Reeder, Multipeak Fat-Corrected Complex R2* Relaxometry: Theory, Optimization, and Clinical Validation. Magn Reson Med, 2013. 70: p. 1319-1331.
5. Qazi, N., D. Hernando, and S.B. Reeder, Robustness of R2* mapping for liver iron assessment at 1.5T and 3T, in Proceedings of the 21th Annual Meeting of ISMRM. 2013: Salt Lake City, Utah. p. 4204.
6. Wood, J.C., et al., Liver iron concentration measurements by MRI in chronically transfused children with sickle cell anemia: baseline results from the TWiTCH trial. Am J Hematol, 2015. 90(9): p. 806-10.
7. Kirk, P., et al., International reproducibility of single breathhold T2* MR for cardiac and liver iron assessment among five thalassemia centers. J Magn Reson Imaging, 2010. 32(2): p. 315-9.
8. St Pierre, T.G., et al., Noninvasive measurement and imaging of liver iron concentrations using proton magnetic resonance. Blood, 2005. 105(2): p. 855-61.
Figures