0513
Noninvasive Staging of Liver Fibrosis using Magnetic Resonance, Ultrasound, and Transient Elastography: a Comparison with Liver Biopsy1Centre de recherche du centre hospitalier de l'Université de Montréal (CRCHUM), Montreal, QC, Canada, 2Department of Gastroentology and Hepatology, Université de Montréal, Montreal, QC, Canada, 3Department of Medicine, Division of Gastroenterology, McGill University Health Centre (MUHC), Montreal, QC, Canada, 4Department of Pathology, Centre hospitalier de l'Université de Montréal (CHUM), Montréal, QC, Canada, 5Department of Pathology and Cellular Biology, Université de Montréal, Montreal, QC, Canada, 6Department of Radiology, Radio-Oncology and Nuclear Medicine, Université de Montréal, Montreal, QC, Canada, 7MR Clinical Science, Philips Healthcare Canada, Markham, ON, Canada
Synopsis
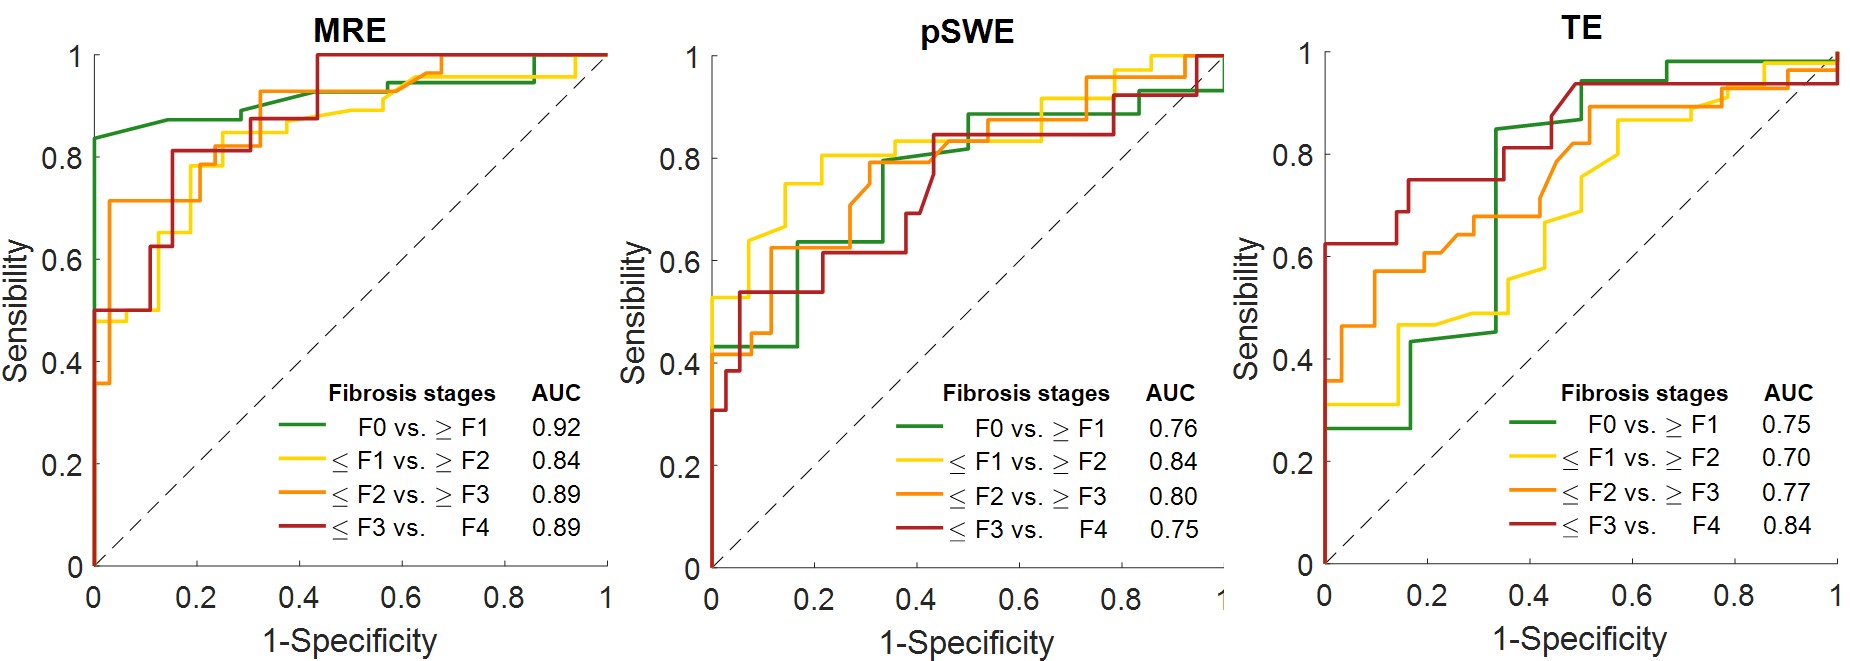
Elastographic techniques measure liver stiffness as surrogate biomarker of liver fibrosis. We performed paired comparisons of MRE, pSWE, and TE for staging liver fibrosis. For classification of dichotomized fibrosis stages F0 vs. ≥ F1, ≤ F1 vs. ≥ F2, ≤ F2 vs. ≥ F3, and ≤ F3 vs. F4, the AUCs were respectively 0.92, 0.84, 0.89, 0.89 for MRE; 0.76, 0.83, 0.80, 0.75 for pSWE; and 0.75, 0.70, 0.77, 0.84 for TE. Overall, MRE provided a diagnostic accuracy similar or higher than ultrasound-based elastographic techniques.
Background
Staging of liver fibrosis is of critical importance for the prognosis, management, and follow up of chronic liver diseases. Considering the burden of chronic liver disease and the risks, costs, and accessibility issues of liver biopsy, noninvasive methods for assessment of liver fibrosis are warranted.1 Elastographic techniques have been proposed to measure mechanical properties, primarily stiffness, which represent surrogate biomarkers of liver fibrosis. These elastographic methods have been implemented on ultrasound- or magnetic resonance-based systems. Clinically available elastographic techniques include magnetic resonance elastography (MRE), point shear wave elastography (pSWE), and 1D transient elastography (TE). Some studies have previously compared two of these three elastographic methods.2,3,4,5 However, to our knowledge, no previous study performed head-to-head comparison of the three most commonly used elastographic techniques.Purpose
To compare the feasibility and diagnostic accuracy of MRE, pSWE, and TE for assessing histology-determined fibrosis stages in patients with chronic liver disease.Materials and Methods
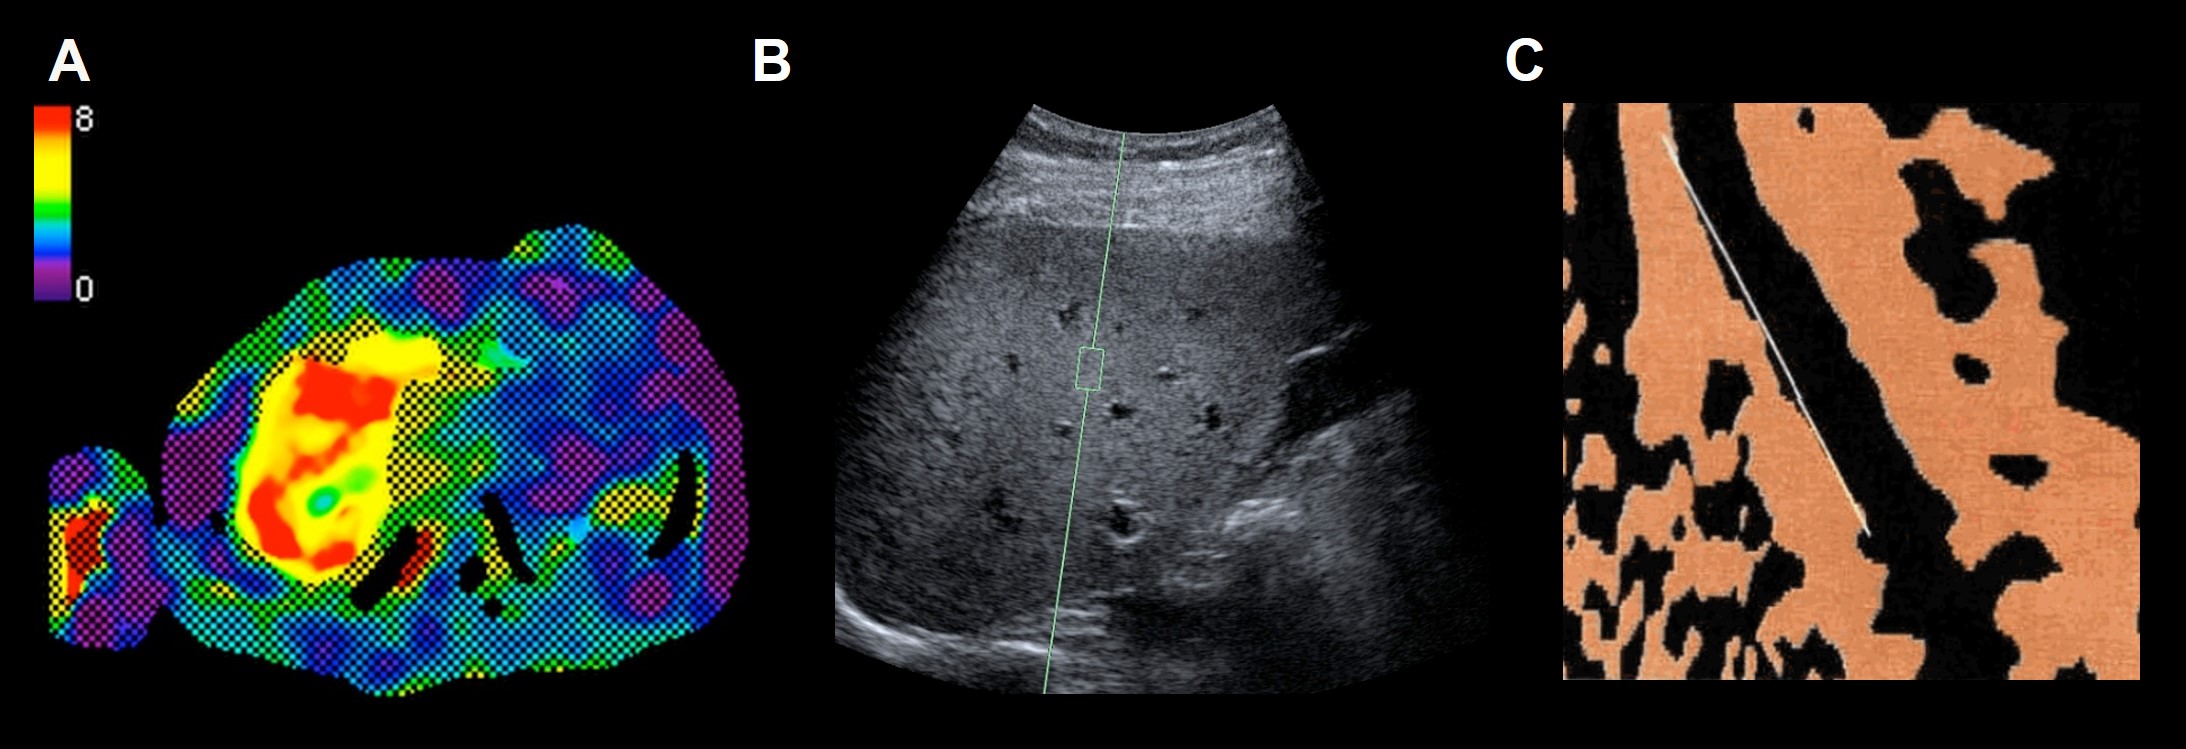
This cross-sectional study was approved by the institutional review board of participating institutions. Between January 2014 and September 2017, patients were included if they underwent liver biopsy as part of their clinical standard of care for suspected or known chronic liver disease caused by hepatitis C, hepatitis B, nonalcoholic steatohepatitis, or autoimmune hepatitis. Index tests (MRE, pSWE, and TE) were performed within 6 weeks of the liver biopsy, either before or after the liver biopsy. MRE examinations were conducted on a 3.0 T clinical scanner (Achieva TX, Philips Healthcare, Best, Netherlands A transducer positioned on the right side of the patient in supine position induced a mechanical vibration (60 Hz) synchronized with the acquisition of a motion-sensitized gradient echo sequence as described previously.6 Direct inversion algorithm, elastographic image processing and stiffness measuring methods were applied.6 MRE measurements were considered reliable if R2* were in the normal range (lower than 126 s-1 at 3.0 T). pSWE examinations were conducted on a clinical ultrasound system (Acuson S2000 or S3000, Siemens, Mountain View, CA, USA). The liver was imaged in real-time through an intercostal window at the mid-axillary line and measurements were performed in the right liver lobe at the junction of segments VII and VIII in accordance with previously described method.7 TE examinations were conducted using the FibroScan (Echosens; Paris, France). Measures of liver stiffness were performed on the skin at an intercostal space over the right liver lobe as described by previous research groups using M or XL probes (for body mass index > 30 kg/m2).8 pSWE and TE measurements were considered reliable if IQR/median were lower than 0.30. Fibrosis, necroinflammation, and steatosis grades were centrally scored by a liver pathologist. The pathologist was blinded to elastography results and image analysts were all blinded to biopsy results. Measurements of shear modulus by MRE, shear wave speed by pSWE, and Young's modulus by TE were evaluated as index tests and compared to histopathologic scoring as the reference standard. Spearman's correlation, Kruskal-Wallis test, Mann-Whitney U test, and receiver operating characteristic (ROC) analyses were performed. Bootstrapping was used to estimate the 95% confidence intervals of area under ROC curves (AUC). Thresholds that maximized Youden's index were identified and the corresponding sensitivity, specificity, accuracy, positive predictive value, and negative predictive value were reported.Results
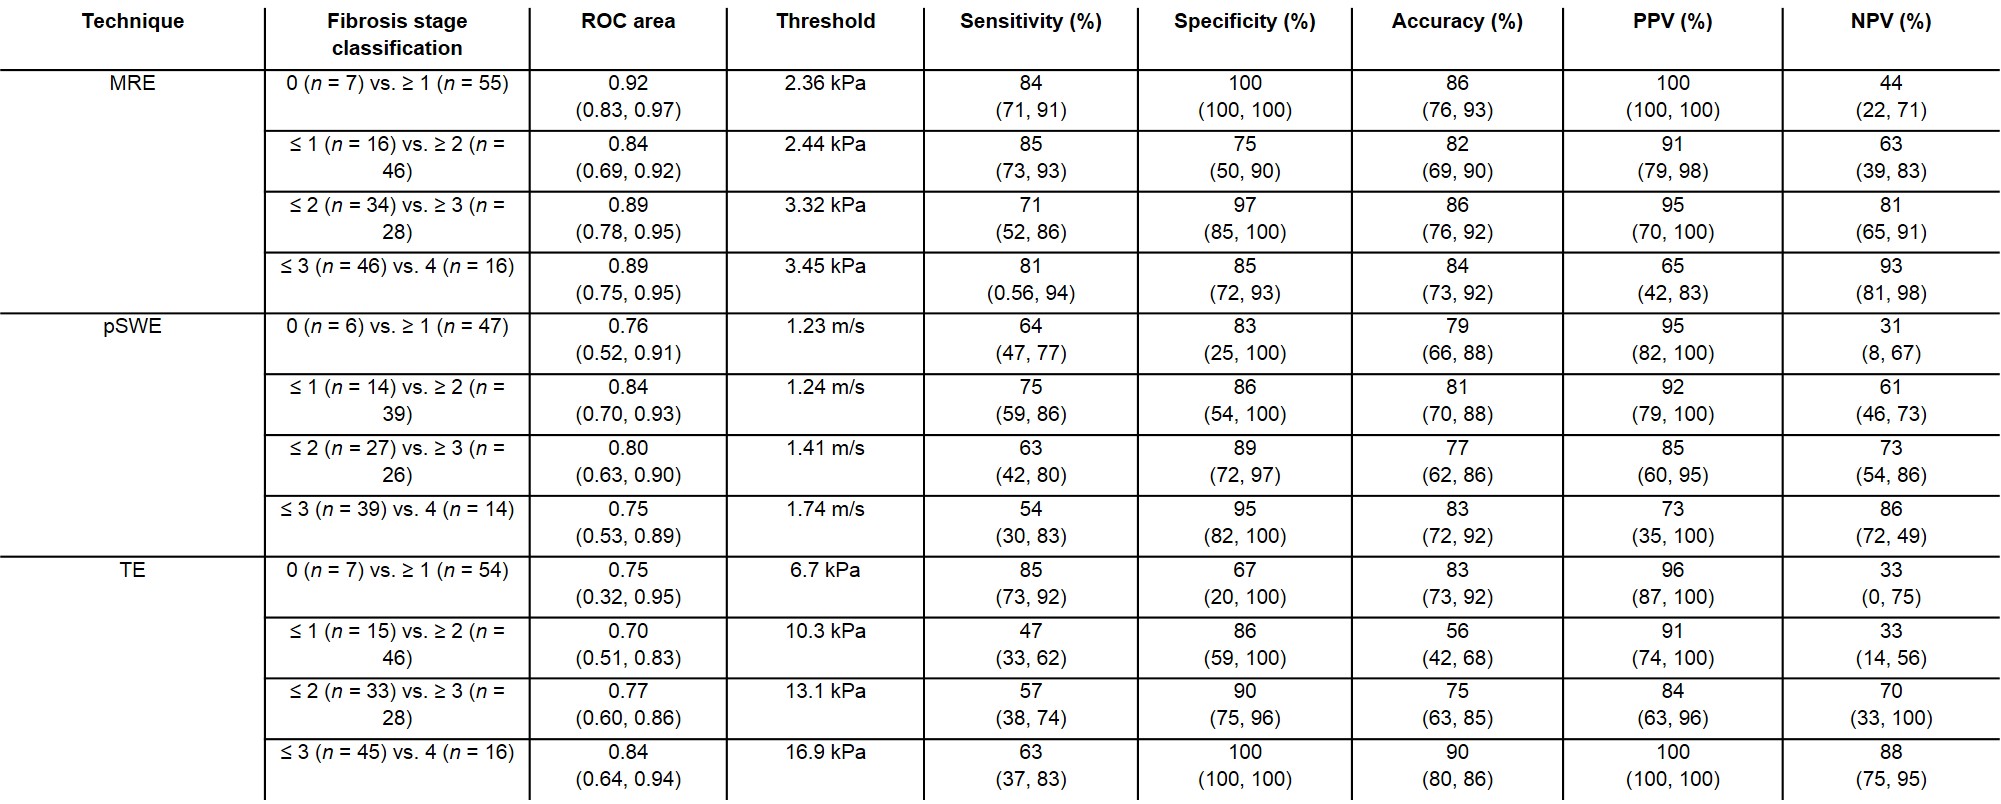
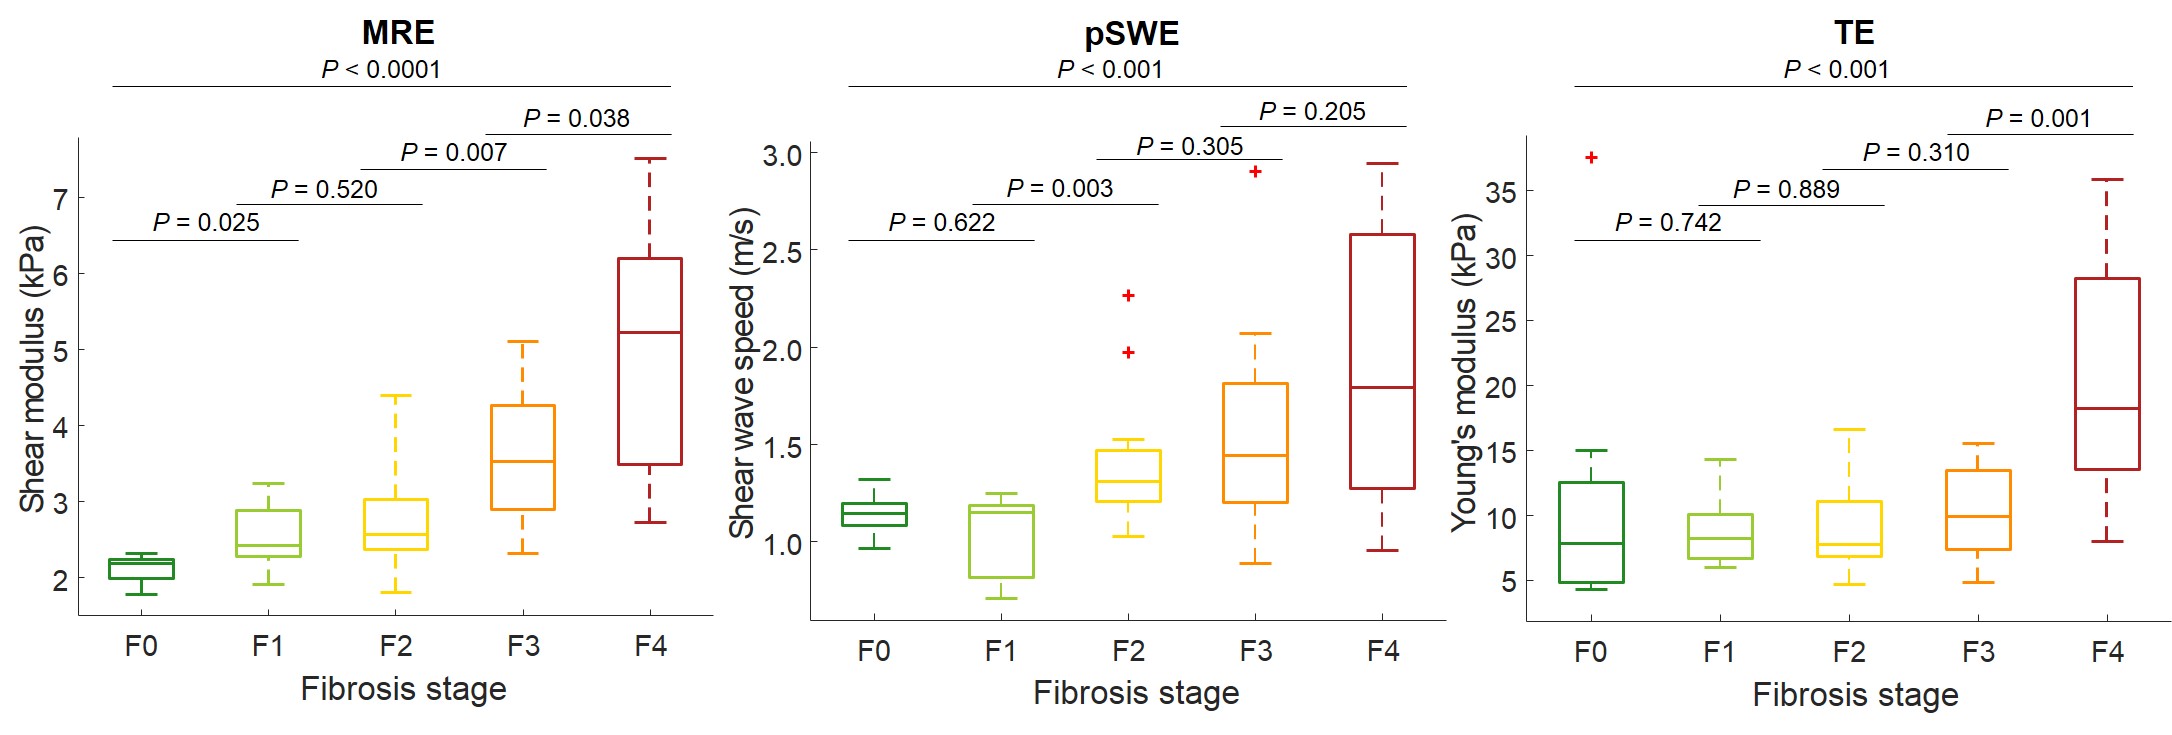
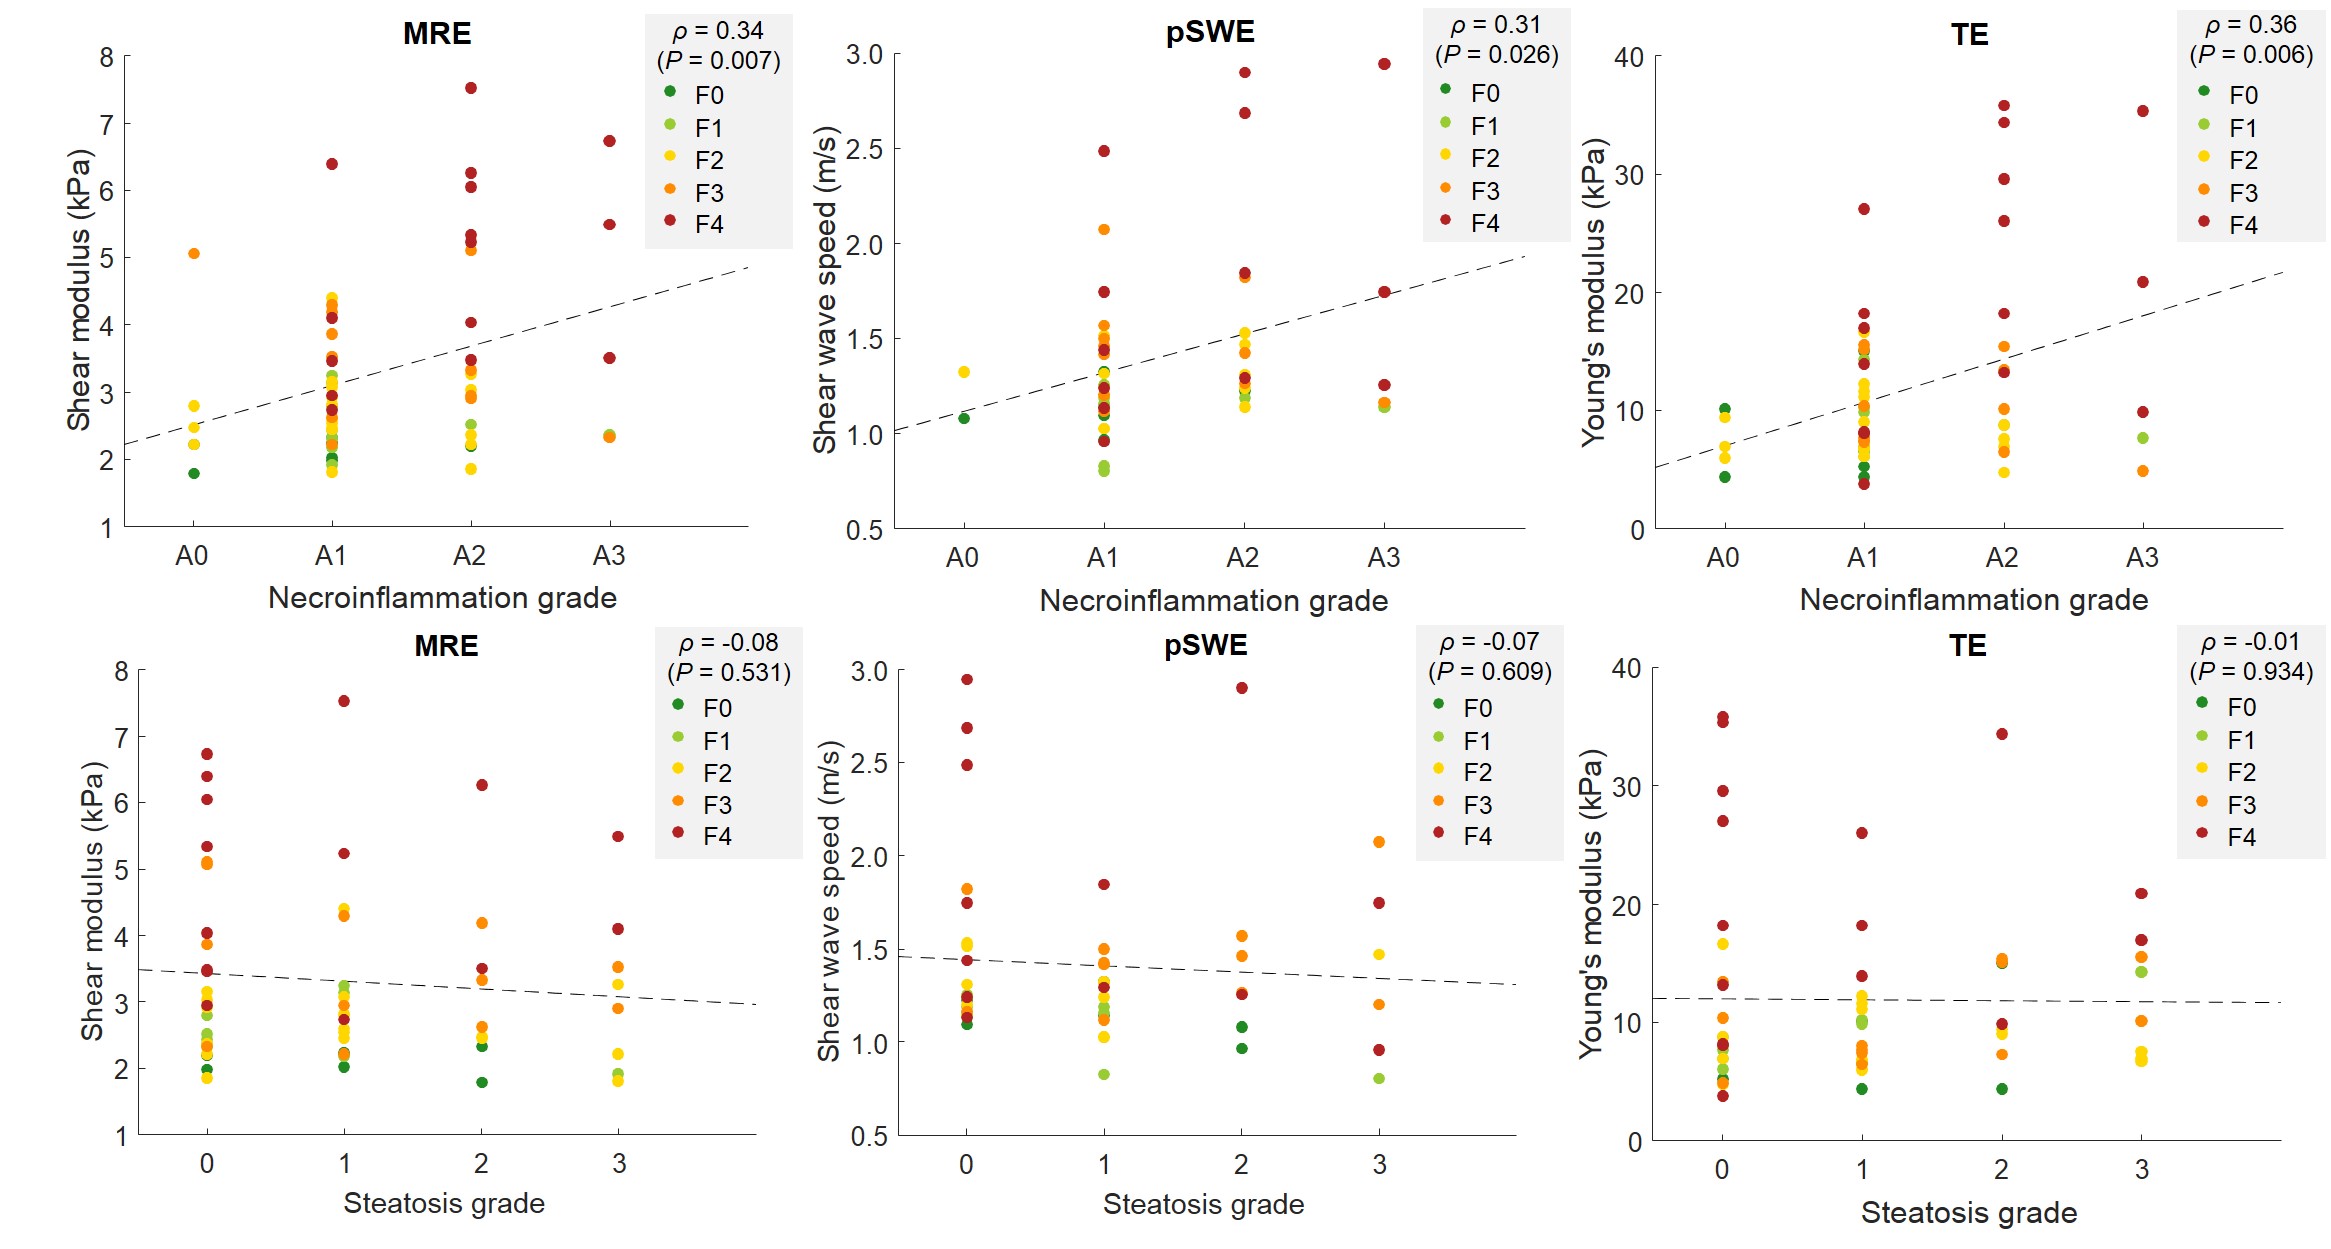
Sixty-six subjects were included. MRE, pSWE, and TE were technically feasible in 65/66, 66/66, and 66/66 subjects, respectively. MRE, pSWE, and TE measures were reliable in 62/66, 53/66, and 61/66 subjects, respectively. MRE, pSWE, and TE measurements were all significantly correlated with fibrosis stages (ρ = 0.67, ρ = 0.54, and ρ = 0.53, respectively; P < 0.001 for all) and with necroinflammation grades (ρ = 0.34, ρ = 0.31, and ρ = 0.36; P = 0.007, P = 0.026, and P = 0.006, respectively), but not with steatosis grades (ρ = -0.08, ρ = -0.07, and ρ = -0.01; P = 0.531, P = 609, and P = 0.934, respectively). Stiffness measurements were significantly different between fibrosis stages for MRE, pSWE, and TE (P < 0.0001, P < 0.001, P < 0.001, respectively). Table 1 summarizes the performance of elastographic techniques measurements for staging liver fibrosis. Figure 2 shows box and whisker plots of elastographic techniques measurements vs. fibrosis stages. Figure 3 shows ROC curves of elastographic techniques measurements vs. dichotomized fibrosis stages. Figure 4 shows the correlation between elastographic techniques measurements and necroinflammation and steatosis grades.Conclusion
We performed paired comparisons of MRE, pSWE, and TE for the assessment of histologically determined liver fibrosis stages. Overall, MRE provided a diagnostic accuracy similar or higher than ultrasound-based elastographic techniques for staging of liver fibrosis.Acknowledgements
This work has been supported by an Operating Grant from the Canadian Institutes of Health Research (CIHR)-Institute of Nutrition, Metabolism, and Diabetes (INMD) Operating Grant (#301520).
An Tang is supported by a Career Award from the Fonds de recherche du Québec en Santé and Association des Radiologistes du Québec (FRQS-ARQ #34939) and a New Researcher Startup Grant from the Centre de Recherche du Centre Hospitalier de l'Université de Montréal (CRCHUM).
References
1. Friedman SL. Mechanisms of hepatic fibrogenesis. Gastroenterology. 2008;134(6):1655-69.
2. Rizzo L, Calvaruso V, Cacopardo B, Alessi N, Attanasio M, Petta S, Fatuzzo F, Montineri A, Mazzola A, L'abbate L, Nunnari G, Bronte F, Di Marco V, Craxì A, Cammà C. Comparison of transient elastography and acoustic radiation force impulse for non-invasive staging of liver fibrosis in patients with chronic hepatitis C. Am J Gastroenterol. 2011 Dec;106(12):2112-20.
3. Cassinotto C, Lapuyade B, Aït-Ali A, Vergniol J, Gaye D, Foucher J, Bailacq-Auder C, Chermak F, Le Bail B, de Lédinghen V. Liver fibrosis: noninvasive assessment with acoustic radiation force impulse elastography--comparison with FibroScan M and XL probes and FibroTest in patients with chronic liver disease. Radiology. 2013 Oct;269(1):283-92.
4. Cui J, Heba E, Hernandez C, Haufe W, Hooker J, Andre MP, Valasek MA, Aryafar H, Sirlin CB, Loomba R. Magnetic resonance elastography is superior to acoustic radiation force impulse for the Diagnosis of fibrosis in patients with biopsy-proven non-alcoholic fatty liver disease: A prospective study. Hepatology. 2016 Feb;63(2):453-61.
5. Chen J, Yin M, Talwalkar JA, Oudry J, Glaser KJ, Smyrk TC, Miette V, Sandrin L, Ehman RL. Diagnostic Performance of MR Elastography and Vibration-controlled Transient Elastography in the Detection of Hepatic Fibrosis in Patients with Severe to Morbid Obesity. Radiology. 2017 May;283(2):418-428.
6. Venkatesh SK, Ehman RL. Magnetic resonance elastography of liver. Magn Reson Imaging Clin N Am. 2014;22(3):433-46.
7. Friedrich-Rust M, Ong MF, Martens S, et al. Performance of transient elastography for the staging of liver fibrosis: a meta-analysis. Gastroenterology 2008; 134:960–974.
8. Friedrich-Rust M, Nierhoff J, Lupsor M, et al. Performance of acoustic radiation force impulse imaging for the staging of liver fibrosis: a pooled meta-analysis. J Viral Hepat 2012; 19:e212–e219.
Figures