0504
Chronic Neurovascular Dysfunction in a Mouse Model of Repeated Mild Traumatic Brain Injury1Medical Biophysics, University of Toronto, Toronto, ON, Canada, 2Sunnybrook Research Institute, Toronto, ON, Canada, 3Mouse Imaging Centre, Toronto, ON, Canada, 4Grenoble Institut des Neurosciences, Université Grenoble Alpes, Grenoble, France, 5Bruker Biospin MRI, Ettlingen, Germany, 6Inserm, U1216, Grenoble, France, 7Department of Laboratory Medicine and Pathobiology, University of Toronto, Toronto, ON, Canada
Synopsis
In-situ assessments of brain function following repeated mild traumatic brain injury (rmTBI) have yet to be seen. Herein, we report the first functional imaging study in the chronic phase of a mouse model of rmTBI. Pseudo-continuous arterial spin labelling MRI revealed a reduction in basal cerebral blood flow and cerebral reactivity, while electrophysiological recordings of evoked responses were greatly reduced in injured brain. Finally, immunohistochemical analysis of vascular endothelium, astrogliosis, and neurons was performed to investigate cellular populations.
Introduction
It has long been established that the outcomes associated with repeated mild traumatic brain injury (rmTBI) are considerably worse than those of a single mild TBI. Despite much higher prevalence of mild injuries, most preclinical research has modelled moderate-to-severe TBI. Recent efforts on rmTBI characterization have begun to uncover the mechanisms of the injury, yet the effects of rmTBI on brain function are still largely unknown.1 For moderate-to-severe TBI, compromise of the neurovascular unit and the resulting mismatch between neuronal metabolic needs and their cerebrovascular support has been identified as a key in pathological progression, and is an attractive target for therapeutics.2 In this study, we aim to probe the neurovascular unit functioning following rmTBI.Methods
Repeated mild TBI: Transgenic mice (stock #007612, strain B6.Cg-Tg (Thy1-COP4/EYFP)18Gfng/J, Jackson Labs) received either rmTBI or sham preparation. Briefly, mice under 2% isoflurane underwent controlled cortical impact via Leica Impact One stereotaxic actuator (2m/s tip velocity, 1.5mm tip diameter, 1mm below skull surface) delivered to skull coordinates overlying the forelimb region of the primary somatosensory cortex.3 This procedure was performed another two times, with 3 days between each impact.4
Imaging: Two weeks following induction of rmTBI, mice underwent either electrophysiology, or MRI, which was followed by brain perfusion and immunohistochemistry. For in situ imaging, mice were anesthetized with isoflurane (5% induction, 1% maintenance), mechanically ventilated, monitored (for heart rate, breath rate, and end-tidal CO2), placed on a temperature-controlled heating-pad, and immobilized via incisor and ear bars.
MRI: Imaging was performed using a 7T horizontal preclinical MRI system (Bruker BioSpec). Resting perfusion and functional response to 10% inspired CO2 (delivered via programmable gas mixer) were assessed using pseudo continuous ASL (pCASL) imaging (5μT labelling pulses with Gav/Gmax=10/45mT/mm, Hanning shaped pulses of duration 0.4ms, 0.8ms pulse interval, and prescan-based correction of interpulse phases to maximize the pCASL signal).5 Pulses were applied in a plane positioned perpendicular to the common carotid artery, 13mm posterior to the coronal slice being imaged. Single slice coronal EPI images were then collected (TR/TE=3500/11ms, FOV=16x16x1mm, and matrix size = 64x64x1. For multi-post labeling delay (PLD) experiments to quantify resting CBF, 32 labelled-unlabelled EPI pairs were acquired for each of nine PLDs (0ms, 50ms, 150ms, 250ms, 350ms, 500ms, 750ms, 1000ms, and 2000ms). Resting CBF was computed in absolute units by modelling the pCASL signal vs. PLD using a single compartment model.6 For assessment of cerebrovascular reactivity to hypercapnia, pCASL imaging (PLD=250ms) was performed during one-minute hypercapnic challenges separated by four minutes medical air breathing. Changes in pCASL signal were assessed via AFNI’s 3dDeconvolve.
Electrophysiology: Mice underwent bilateral craniotomy over region of the CCIs and over homologous region in the contralateral hemisphere to allow stereotactic placement of single recording electrode on both sides for recording of brain activity (Heka Instruments inc.). Local Field Potentials were sampled at 10 kHz and stored for offline analysis. Photostimulation (30mW/mm2, 450nm light, 10Hz, 50ms pulses) was then applied at the site of the electrodes, activating cortical neurons expressing channelrhodopsin. The average amplitude of evoked response was computed for each animal.
Immunohistochemistry: Following imaging, brains were transcardially perfused, extracted, sectioned via sliding freezing microtome (40µm) and sections stained for GFAP (an astrocytic marker; 1:1000, DAKO #Z0334), NeuN (neuronal marker; 1:500, EMD Millipore #ABN90), and DyLight 649-labelled lycopersicon esculentum (tomato) lectin (rodent vascular endothelium marker; 1:200, BioLynx #VECTDL1178). GFAP sections were incubated with secondary antibody conjugated to AlexaFluor-647 (1:500, Invitrogen #A31573). Similarly, NeuN sections were incubated with secondary antibody conjugated to AlexaFluor-647 (1:200, EMD Millipore #AP193SA6). Mounted sections were imaged at 5x magnification using a Zeiss Apotome.2 Microscope (MBF Biosciences). For each contrast, the optical density of positively stained cells was computed at the site of the impacts.
Results
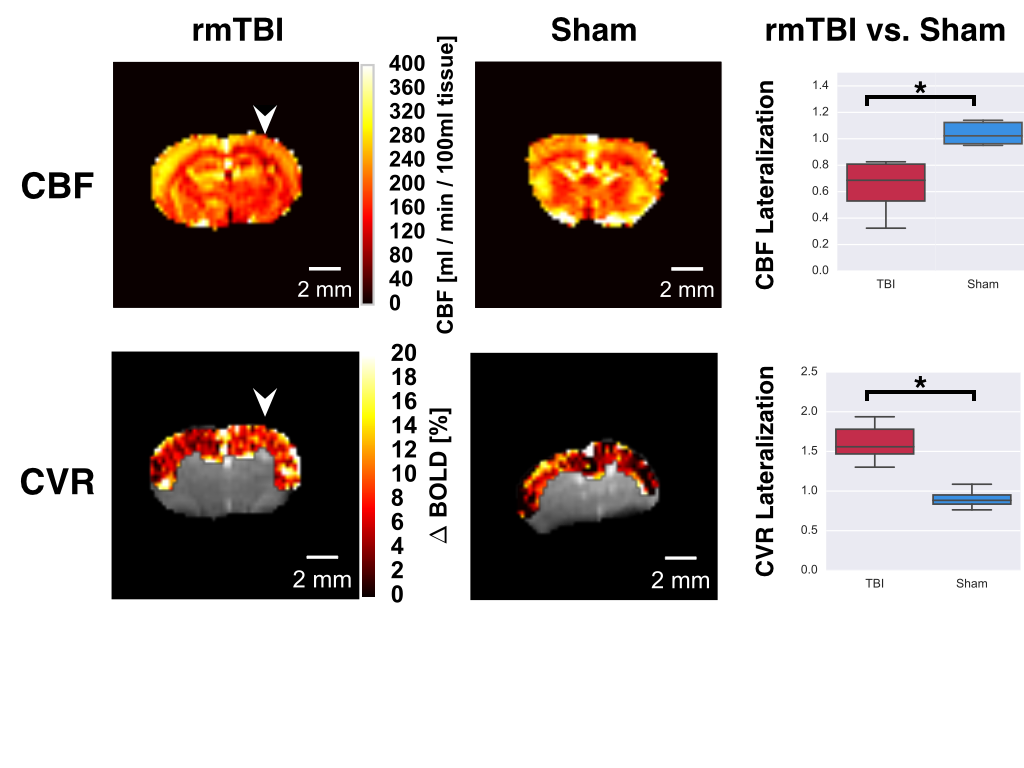
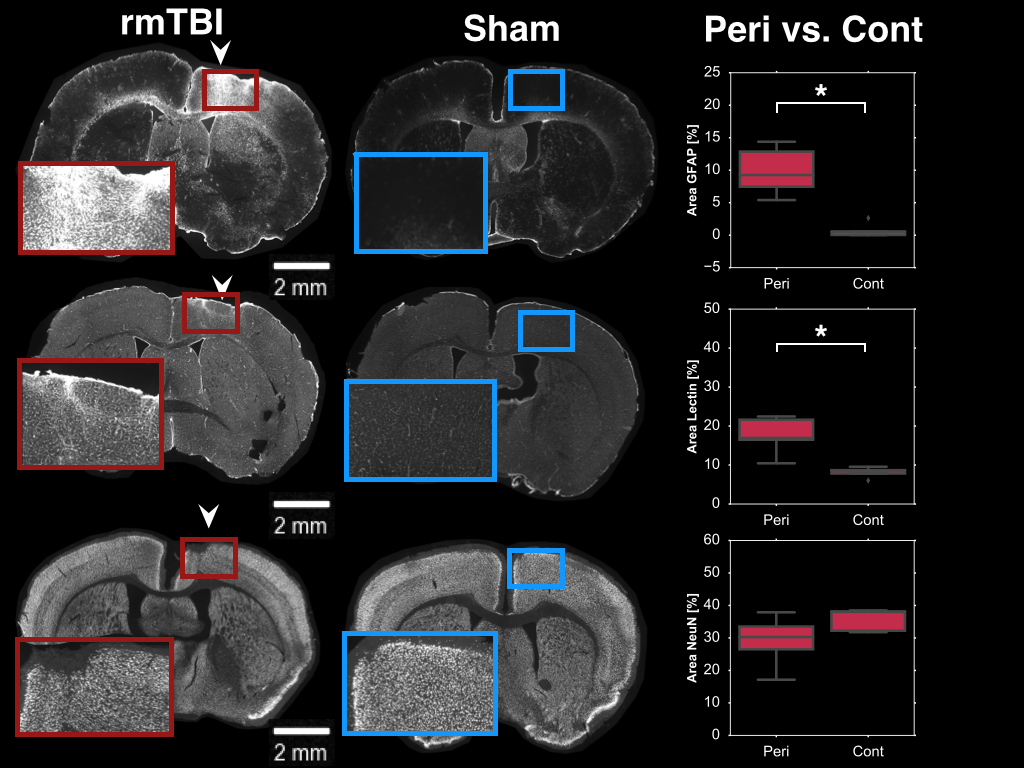
Here, rmTBI mice had reduced resting CBF (0.64±0.08 vs, 1.04±0.04, ratio of injured to non-injured hemisphere for rmTBI and sham mice), yet elevated cerebrovascular reactivity (1.6±0.1 vs 0.90±0.07, ratio of injured to non-injured hemisphere for rmTBI and sham mice); Figure 1. Additionally, the rmTBI mice displayed a depressed response to photostimulation in injured tissue (0.01±0.02 vs. 0.8±0.2, ratio of injured to non-injured hemisphere for rmTBI and sham mice) (Figure 2). Immunohistochemical analyses revealed increased astrogliosis (GFAP) and vascular endothelium (Lectin fluorescence), and no change in neuronal survival (NeuN) in the injured tissue (Figure 3).Conclusion
Reduced CBF with elevated CVR alongside an increase in vascular density may result from formation of new vessels that are functionally recruitable, yet hypoperfused at rest. Reduced neuronal reactivity alongside the abnormal cerebrovascular profile indicated a pronounced compromise of the neurovascular unit in the chronic phase of rmTBI.Acknowledgements
No acknowledgement found.References
1. Fehily B, Fitzgerald M. Repeated Mild Traumatic Brain Injury. Cell Transplantation. 2017; 26; 1131-1155Kimbra Kenney, Margalit Haber, Franck Amyot, Cora Davis, Angela Pronger, Carol Moore, Ramon Diaz-Arrastia. Cerebral Microvascular Injury in Traumatic Brain Injury. J. Neurol. 2015; 275; 353-366.
2. Dixon CE, Clifton GL, Lighthall JW, Yaghmai AA, Hayes RL. A controlled cortical impact model of traumatic brain injury in the rat. J. Neurosci. Methods 1991; 39; 253-262.
3. Longhi, Luca, Kathryn E. Saatman, Scott Fujimoto, Ramesh Raghupathi, David F. Meaney, Jason Davis, Asenia McMillan B S, et al. 2005. “Temporal Window of Vulnerability to Repetitive Experimental Concussive Brain Injury.” Neurosurgery 56 (2): 364–74.
4. Hirschler L, Debacker CS, et. al. Robust Inter-Pulse Phase Correction for Brain Perfusion Imaging at Very High Field using Pseudo-Continuous Arterial Spin Labeling (pCASL). In Proceedings of the 23rd Annual Meeting of ISMRM, Toronto, Ontario, Canada. #3168
5. Parkes LM, Tofts PS. Improved Accuracy of Human Cerebral Blood Perfusion Measurements Using Arterial Spin Labeling: Accounting for Capillary Water Permeability. Magnetic Resonance in Medicine. 2002; (48):27-41.
Figures