0502
Assessment of white matter anisotropy effects in mq-BOLD based mapping of relative Oxygen Extraction Fraction1Department of Neuroradiology, Technical University of Munich, Munich, Germany, 2Department of Radiology & Biomedical Imaging, Yale University, New Haven, CT, United States, 3Philips Healthcare, Hamburg, Germany, 4Departement of Radiology, Technical University of Munich, Munich, Germany, 5School of Engineering & Applied Science, Yale University, New Haven, CT, United States, 6Clinic for Neurology, Technical University of Munich, Munich, Germany
Synopsis
Anisotropy effects were proven to strongly affect T2* and DSC-measurements, however influences on the relative Oxygen Extraction Fraction (rOEF) by multi-parametric quantitative BOLD (mq-BOLD) have not been investigated yet. Therefore, we present a methodolocigal study within healthy elderly. The major aim was to evaluate anisotropy effects on rOEF and all mq-BOLD related parameters at the same time. We found strong orientation dependencies of T2*, T2, R2' and rCBV on the main-nerve-fiber orientation towards B0 with variations up to 26.6%. However, our results show rather low angle dependency of rOEF with 13.6% as R2’ and rCBV effects show partially counteracting influences.
Purpose
The multi-parametric quantitative BOLD (mq-BOLD) approach is highly promising for assessing vascular oxygenation by revealing relative Oxygen Extraction Fraction (rOEF) maps.1,2 It requires three separate measurements of T2, T2* and relative Cerebral Blood Volume (rCBV), and has been successfully applied in several studies.3-6 However, contrary to the underlying model assumptions of randomly-isotropic oriented capillaries1,7, recent publications separately demonstrated DSC8 and T2* orientation effects in WM9-17, while their main contributions are still under discussion. Albeit, WM is particularly affected in many diseases such as stroke and small vessel disease.18 Hence, a deeper understanding of WM rOEF-mapping would be of high clinical relevance. Therefore, our study investigates for the first time anisotropy effects on rOEF-mapping by analyzing all mq-BOLD related parameters at the same time.
Methods
In our clinical study, 30 healthy subjects (70.1$$$\,$$$±$$$\,$$$4.8$$$\,$$$y, 13$$$\,$$$males) underwent MRI on a Philips 3T Ingenia MR-Scanner (Philips Healthcare, Best, Netherlands) using a 16-channel head-neck-coil. The imaging protocol and sequence parameters are summarized in Fig.1. Processing was performed with SPM12,19 FSL20 and custom Matlab21 programs. FLAIR lesions were graded by the Fazekas-score22 (Rater:$$$\,$$$JG). T2*-data was corrected for background gradients23 and motion24 and, just as T2, fitted mono-exponentially1. Two subjects were excluded based on visual motion artefact ratings (CP,SK). DSC-imaging was performed during a bolus-injection of 15-20$$$\,$$$ml (weight adapted) Gd-DOTA at 4$$$\,$$$ml/s after a prebolus.25 Following the mq-BOLD approach, rOEF was calculated by $$rOEF=\frac{R_2’}{c\cdot rCBV}$$ with $$$c=\gamma\cdot \frac{4}{3}\cdot \pi\cdot \Delta\chi\cdot B_0$$$.1 To extract orientation-information, DTI-data analysis by FSL yielded FA-maps and main-nerve-fiber-orientations $$$\vec {V_1}$$$ voxelwisely (Fig.2C).8-10 DTI imaging-volume orientations were extracted from Nifti-headers and applied to rotate $$$\vec {V_1}$$$-maps to the scanner coordinate-system yielding $$$\vec {V_1’}$$$-maps (Fig.2A). The azimuthal angle θ describes the main-nerve-fiber-orientation $$$\vec {V_1’}$$$ relative to the main magnetic field B0 with z’$$$\,$$$||$$$\,$$$B0 (Fig.2B,D). To investigate influences perpendicular to B0, we transformed $$$\vec {V_1’}$$$ to spherical-coordinates and analyzed the polar angle $$$\varphi$$$ dependencies in the x’-y’-plane ($$$\bot$$$B0) (Fig.2B). As fiber-direction is irrelevant, we analysed angle ranges of θ$$$\,$$$=$$$\,$$$0°$$$\,$$$to$$$\,$$$90° and $$$\varphi \,$$$=$$$\,$$$-90°$$$\,$$$to$$$\,$$$90°.8 Analysis was restricted to oriented WM-voxels (pWM$$$\,$$$>$$$\,$$$0.95 & FA$$$\,$$$>$$$\,$$$0.15) (Fig.2D). Within this mask, anisotropy effects of the individual parameters T2*, T2, R2', rCBV and rOEF were evaluated in 5° angle-bins. Following a basic theoretical tissue-model of parallel cylinders with susceptibility differences, largest magnetic-field gradients and shortest T2* relaxation-times are expected at θ=90°.7-10 We will fit the more sophisticated model by Lee et al17: $$$R_2^*(\theta)=c_0+c_1\cdot sin(2\theta+\phi_0)+c_2\cdot sin(4\theta+\phi_1)$$$.
Results
Lesion analysis revealed a Fazekas mean score of 1.0$$$\,$$$±$$$\,$$$0.9, indicating minor microangiopathic changes. T2* and T2 showed a strong dependence on θ with T2*(θ)$$$\,$$$=$$$\,$$$47.7$$$\,$$$-$$$\,$$$54.7$$$\,$$$ms (Fig.3A) and T2(θ)$$$\,$$$=$$$\,$$$76.5$$$\,$$$-$$$\,$$$82.6$$$\,$$$ms (Fig.3C). Fitting Lee's model17 to R2*(θ) revealed excellent agreement (p<0.0001) (Fig.3A). R2’ values yielded a θ-dependent variation of 21.3% (Fig.4A). The θ-dependence of rCBV was even stronger with 26.6% (Fig.4C). The maximum rOEF(θ) change was 13.6% (Fig.4E). No dependencies of any parameters on $$$\varphi$$$ were observed (Fig.3B,D & Fig.4B,D,F).
Discussion
In accordance with recent literature,8-10 we observed a strong dependence of T2* and rCBV on tissue orientation towards B0 measured by θ (Table1). We assume additionally observed T2-effects to be mediated by diffusion.11 We introduced polar-coordinates for the first time in anisotropy analysis,8-10 showing no dependencies on $$$\varphi$$$ perpendicular to B0 which strongly indicates the correct orientation of our data. The major contributors to T2* and rCBV-anisotropy are still under discussion. In consistency with literature, our data shows no obvious magic-angle effects26 suggesting no major dipole-dipole interaction influences.10,13 The most likely contributor to the angle-dependencies are sub-voxel susceptibility effects from anisotropic sources, namely highly ordered myelin-fiber structures8-17 and blood-vessel orientation effects8,9 as blood-vessels are preferentially aligned parallel to axonal-fibers.27 Even though measured rOEF-values in WM are systematically elevated (mean rOEFWM$$$\,$$$=$$$\,$$$1.05), observed rOEF anisotropy effects of 13.6% are rather low compared to strong R2’ and rCBV effects >20%. This is due to counteracting effects of R2’ and rCBV. The highest rOEF anisotropy effects were observed at low angles θ$$$\,$$$<$$$\,$$$30°. When considering the small number of voxels at θ$$$\,$$$<$$$\,$$$30° (Fig.3E), the average anisotropy related rOEF-deviation is only 4.3%.
Conclusion
Our results demonstrate successful in-vivo measurements of anisotropy effects with high sensitivity and reasonable scan-time. We confirmed a strong T2* and rCBV dependency on the main-nerve-fiber orientation towards B0. We observed similar dependencies for T2 and R2’ indicating strong impact on many T2 & T2*-contrast based MR-measurements in WM. rOEF anisotropy is comparably low in our healthy, elderly cohort indicating good reliability of WM rOEF with regards to orientation effects. Further rOEF anisotropy analysis within patients is required and currently in progress. Anisotropy does not seem to primarily contribute to elevated WM rOEF-values suggesting future analysis of other systematic influences.
Acknowledgements
The authors acknowledge support by the Friedrich-Ebert-Stiftung and Dr.-Ing. Leonhard-Lorenz-Stiftung.References
1: Hirsch NM et al (2014). „Technical considerations on the validity of blood oxygenation level-dependent-based MR assessment of vascular deoxygenation.“ NMR Biomed, 27: 853-862.
2: Christen T et al (2012). „Measuring brain oxygenation in humans using a multiparametric quantitative blood oxygenation level dependent MRI approach.“ MRM 68(3): 905-911.
3: Preibisch C et al (2017). “Characterizing hypoxia in human glioma: A simultaneous multimodal MRI and PET study.” NMR Biomed 30(11).
4: Gersing AS et al (2015). „Mapping of cerebral metabolic rate of oxygen using dynamic susceptibility contrast and blood oxygen level dependent MR imaging in acute ischemic stroke.“ Neuroradiology 57(12): 1253-1261.
5: Bouvier J et al (2015). „Reduced CMRO2 and cerebrovascular reserve in patients with severe intracranial arterial stenosis: A combined multiparametric qBOLD oxygenation and BOLD fMRI study.“ HBM 36(2) 695-706.
6: Toth V et al (2013). „MR-based hypoxia measures in human glioma.“ J Neurooncol, 115: 197-207.
7: Yablonskiy DA and EM Haacke (1994). "Theory of NMR signal behavior in magnetically inhomogeneous tissues: The static dephasing regime." MRM 32(6): 749-763.
8: Hernández-Torres EN et al (2016). "Anisotropic cerebral vascular architecture causes orientation dependency in cerebral blood flow and volume measured with dynamic susceptibility contrast magnetic resonance imaging." JCBFM 37(3): 1108-1119.
9: Denk C et al (2011). "The influence of white matter fibre orientation on MR signal phase and decay." NMR Biomed 24(3): 246-252.
10: Bender B and U Klose (2010). "The in vivo influence of white matter fiber orientation towards B(0) on T2* in the human brain." NMR Biomed 23(9): 1071-1076.
11: Sati P et al. (2012). "In vivo quantification of T2* anisotropy in white matter fibers in marmoset monkeys." NeuroImage 59(2): 979-985.
12: Cherubini A et al (2009). "Characterization of white matter fiber bundles with T2* relaxometry and diffusion tensor imaging." MRM 61(5): 1066-1072.
13: Oh SH et al (2013). "Origin of B(0) orientation dependent R(2)(*) (=1/T(2)(*)) in white matter." NeuroImage 73: 71-79.
14: Lee J et al (2012). "The contribution of myelin to magnetic susceptibility-weighted contrasts in high-field MRI of the brain." Neuroimage 59(4): 3967-3975.
15: He X and DA Yablonskiy (2009). "Biophysical mechanisms of phase contrast in gradient echo MRI." Proc Natl Acad Sci USA 106(32): 13558-13563.
16: Lee J et al (2010). "Sensitivity of MRI resonance frequency to the orientation of brain tissue microstructure." Proc Natl Acad Sci USA 107(11): 5130-5135.
17: Lee J et al (2011). "T2*-based fiber orientation mapping." Neuroimage 57(1): 225-234.
18: Mangla R et al (2011). "Border zone infarcts: pathophysiologic and imaging characteristics." Radiographics 31(5): 1201-1214.
19: Statistical Parametric Mapping software (SPM12) Version 6225: www.fil.ion.ucl.ac.uk/spm.
20: FMRIB Analysis Group, Oxford, UK. http://www.fmrib. ox.ac.uk/fsl
21: MATLAB and Statistics Toolbox Release 2016a, The MathWorks, Inc., Natick, Massachusetts, United States.
22: Fazekas F et al (1987). „MR signal abnormalities at 1.5 T in Alzheimer’s dementia and normal aging.“ AJR Am J Roentgenol 149:351–356.
23: Hirsch NM and C Preibisch (2013). "T2* mapping with background gradient correction using different excitation pulse shapes." AJNR 34(6): E65-68.
24: Magerkurth J et al (2011). "Quantitative T*2-mapping based on multi-slice multiple gradient echo flash imaging: Retrospective correction for subject motion effects." MRM 66(4): 989-997.
25: Kluge A et al (2016). „Analysis of three leakage-correction methods for DSC-based measurement of relative cerebral blood volume with respect to heterogeneity in human gliomas.“ MRI 34(4): 410-421.
26: Chappell KE et al (2004). "Magic angle effects in MR neurography." AJNR 25(3): 431-440. 27: Nonaka H et al. (2003). "Microvasculature of the human cerebral white matter: arteries of the deep white matter." Neuropathology 23(2): 111-118.
27: Nonaka H et al (2003). "Microvasculature of the human cerebral white matter: arteries of the deep white matter." Neuropathology 23(2): 111-118.
Figures
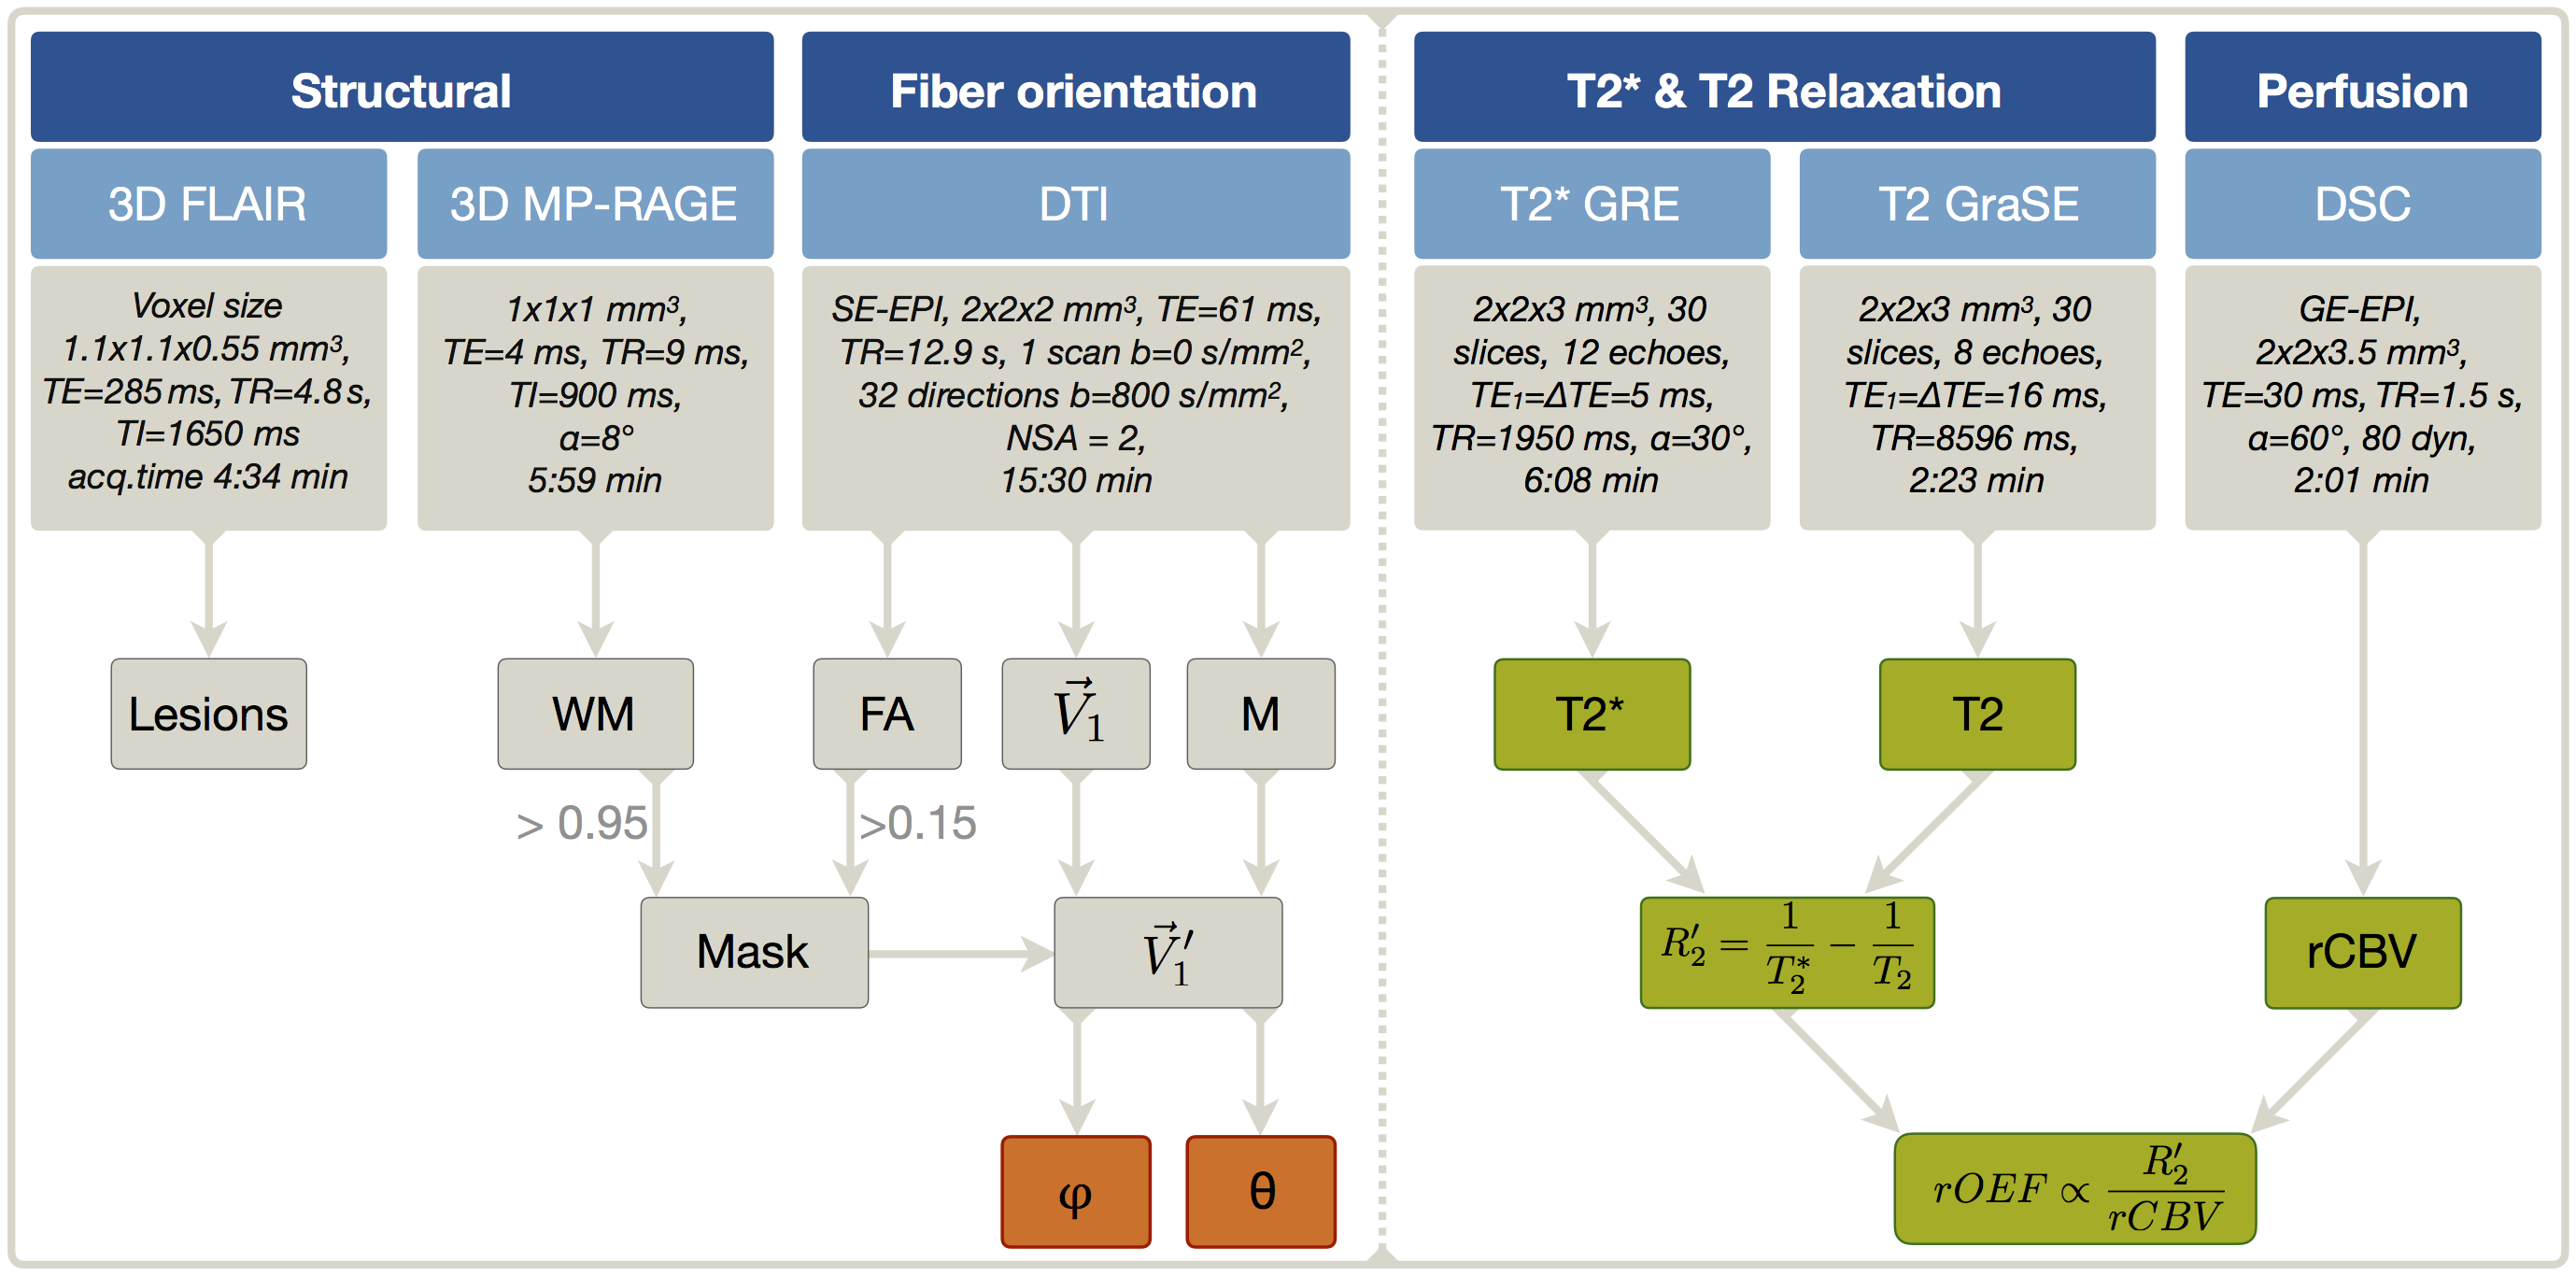
Figure 1: Overview of imaging protocols and derived parameters. FLAIR was used for structural lesion detection and MP-RAGE for WM mask generation. Fractional anisotropy (FA) maps and main-nerve-fiber orientation $$$\vec {V_1}$$$-maps were derived from DTI. The rotation-matrix M was used to transform $$$\vec {V_1}$$$-maps to the scanner coordinate-system resulting in $$$\vec {V_1’}$$$-maps. After application of a mask selecting only oriented WM (PWM > 0.95, FA > 0.15), the spherical angles $$$\varphi$$$ and θ were calculated voxel-wisely (orange). Finally, the dependency of the calculated parameters (green) on $$$\varphi$$$ and θ was analyzed in bins of 5°, each for $$$\varphi$$$ and θ.
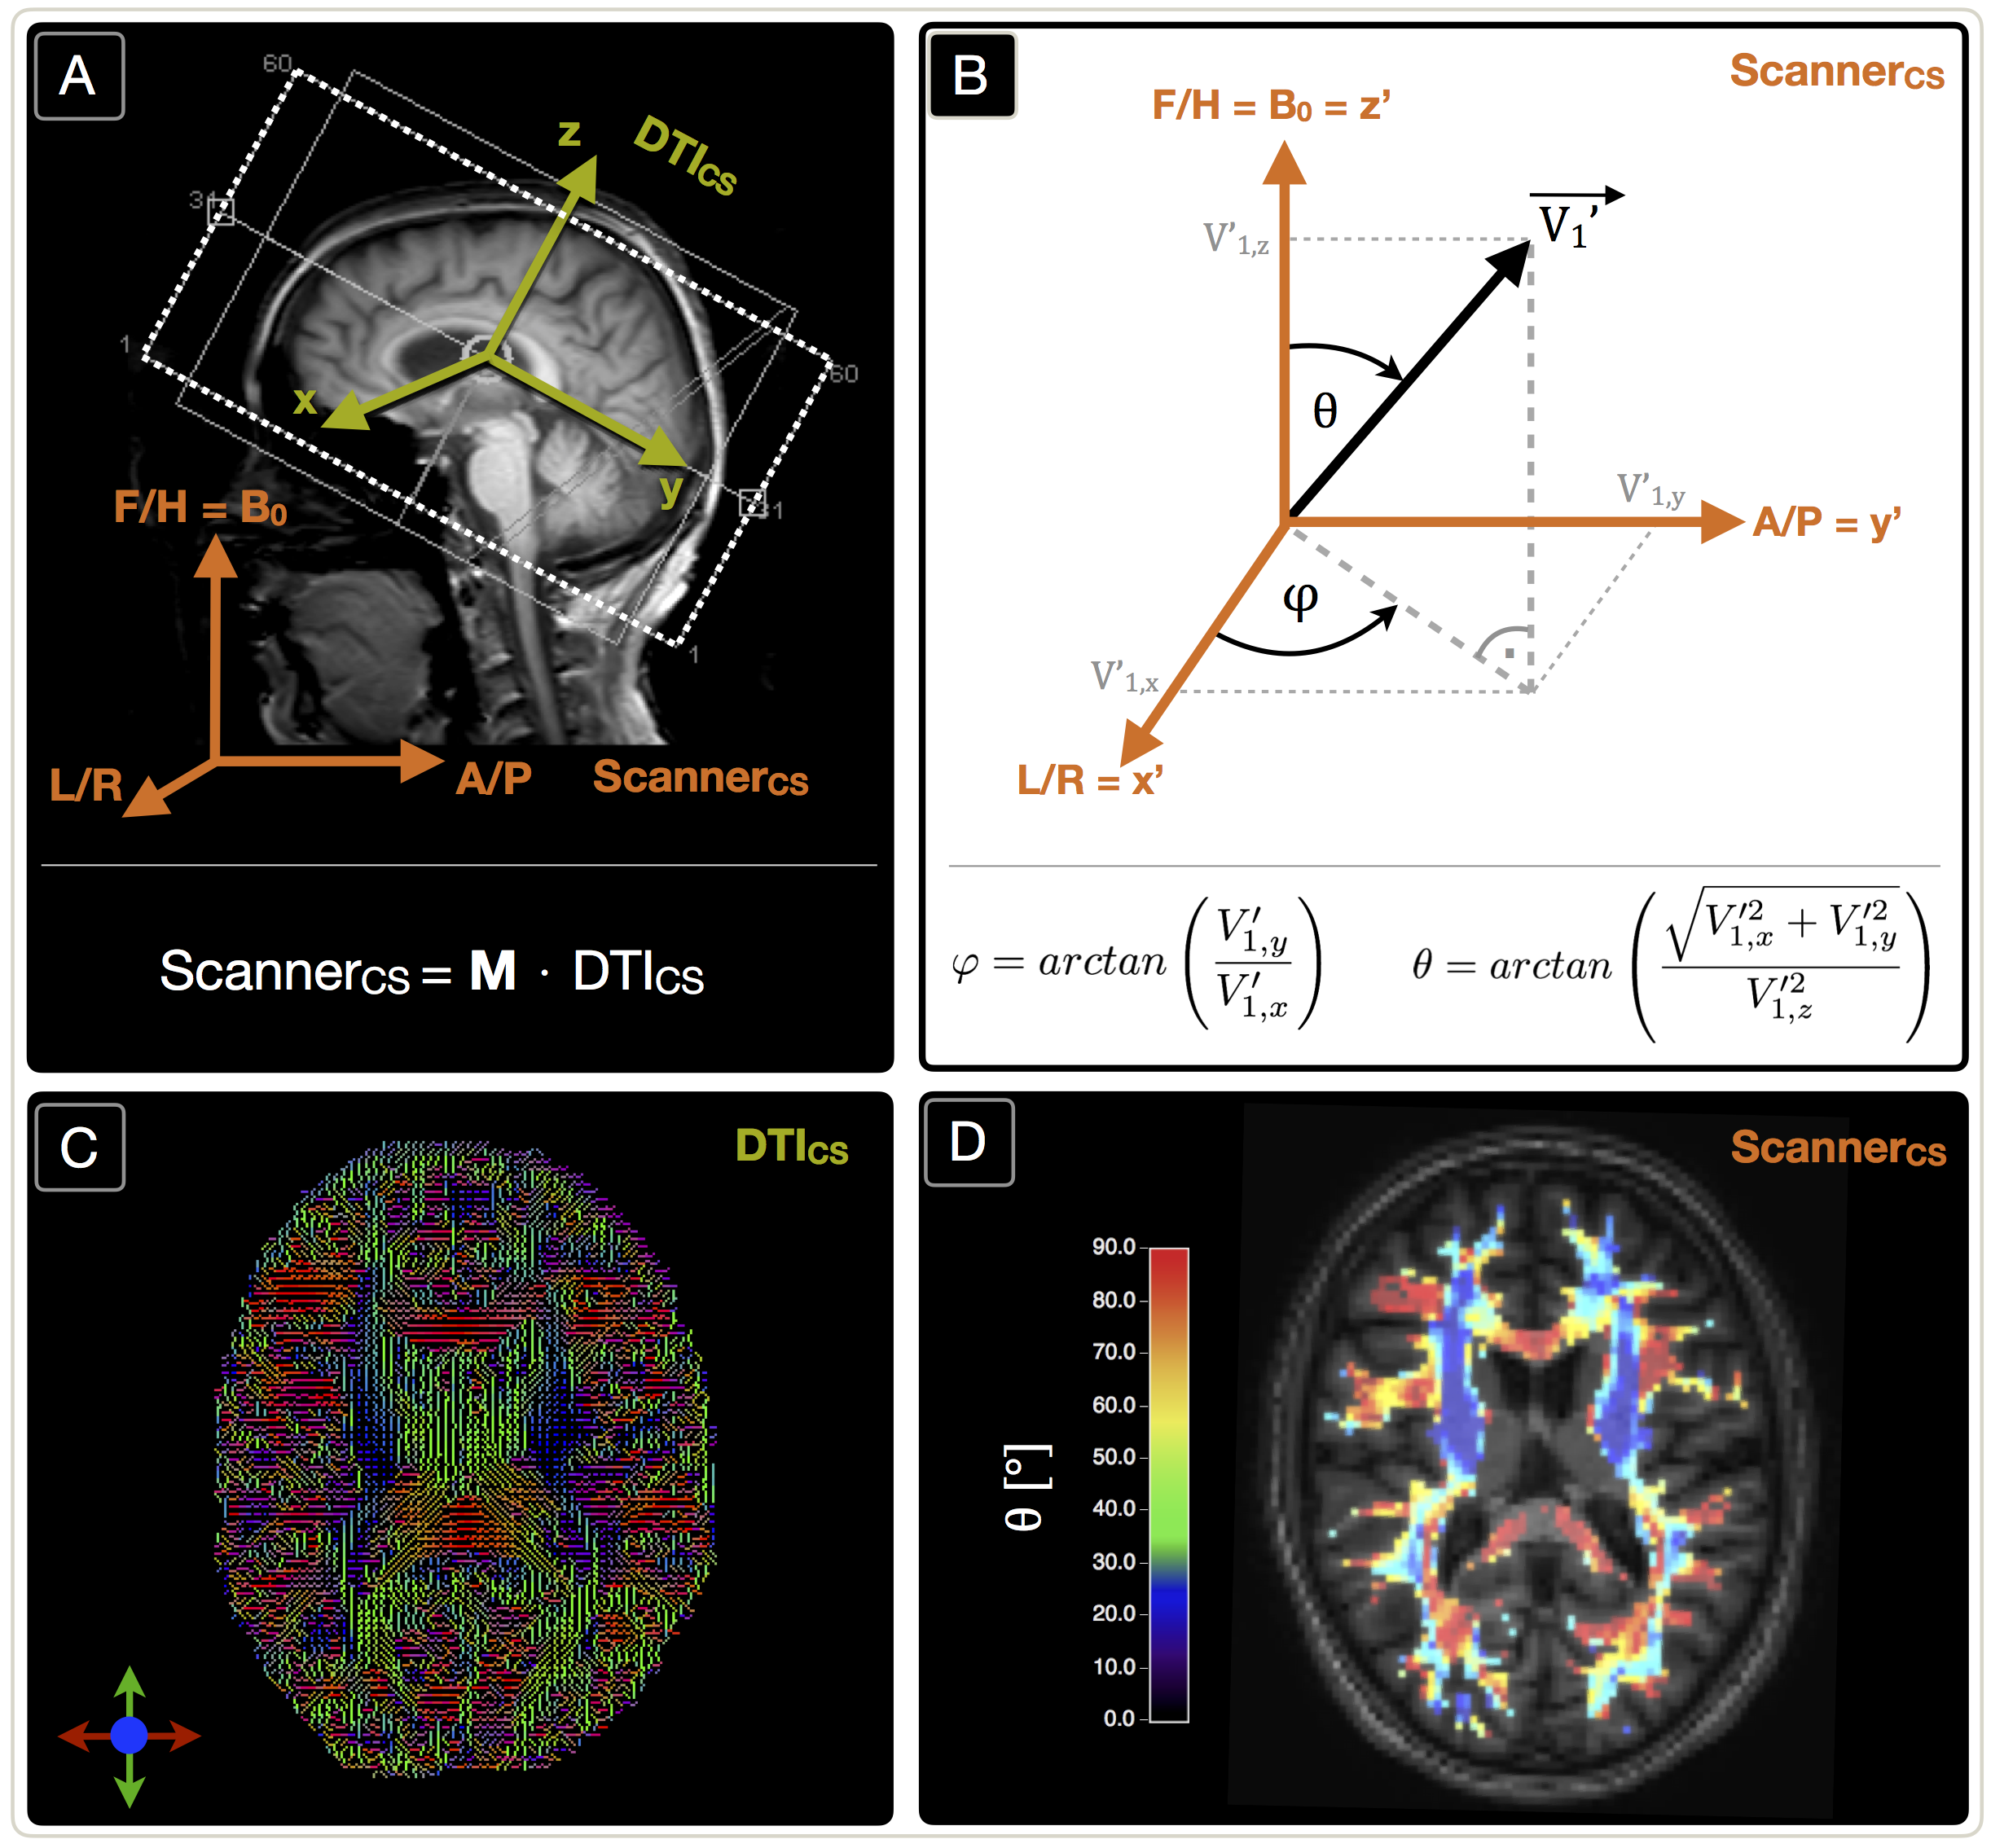
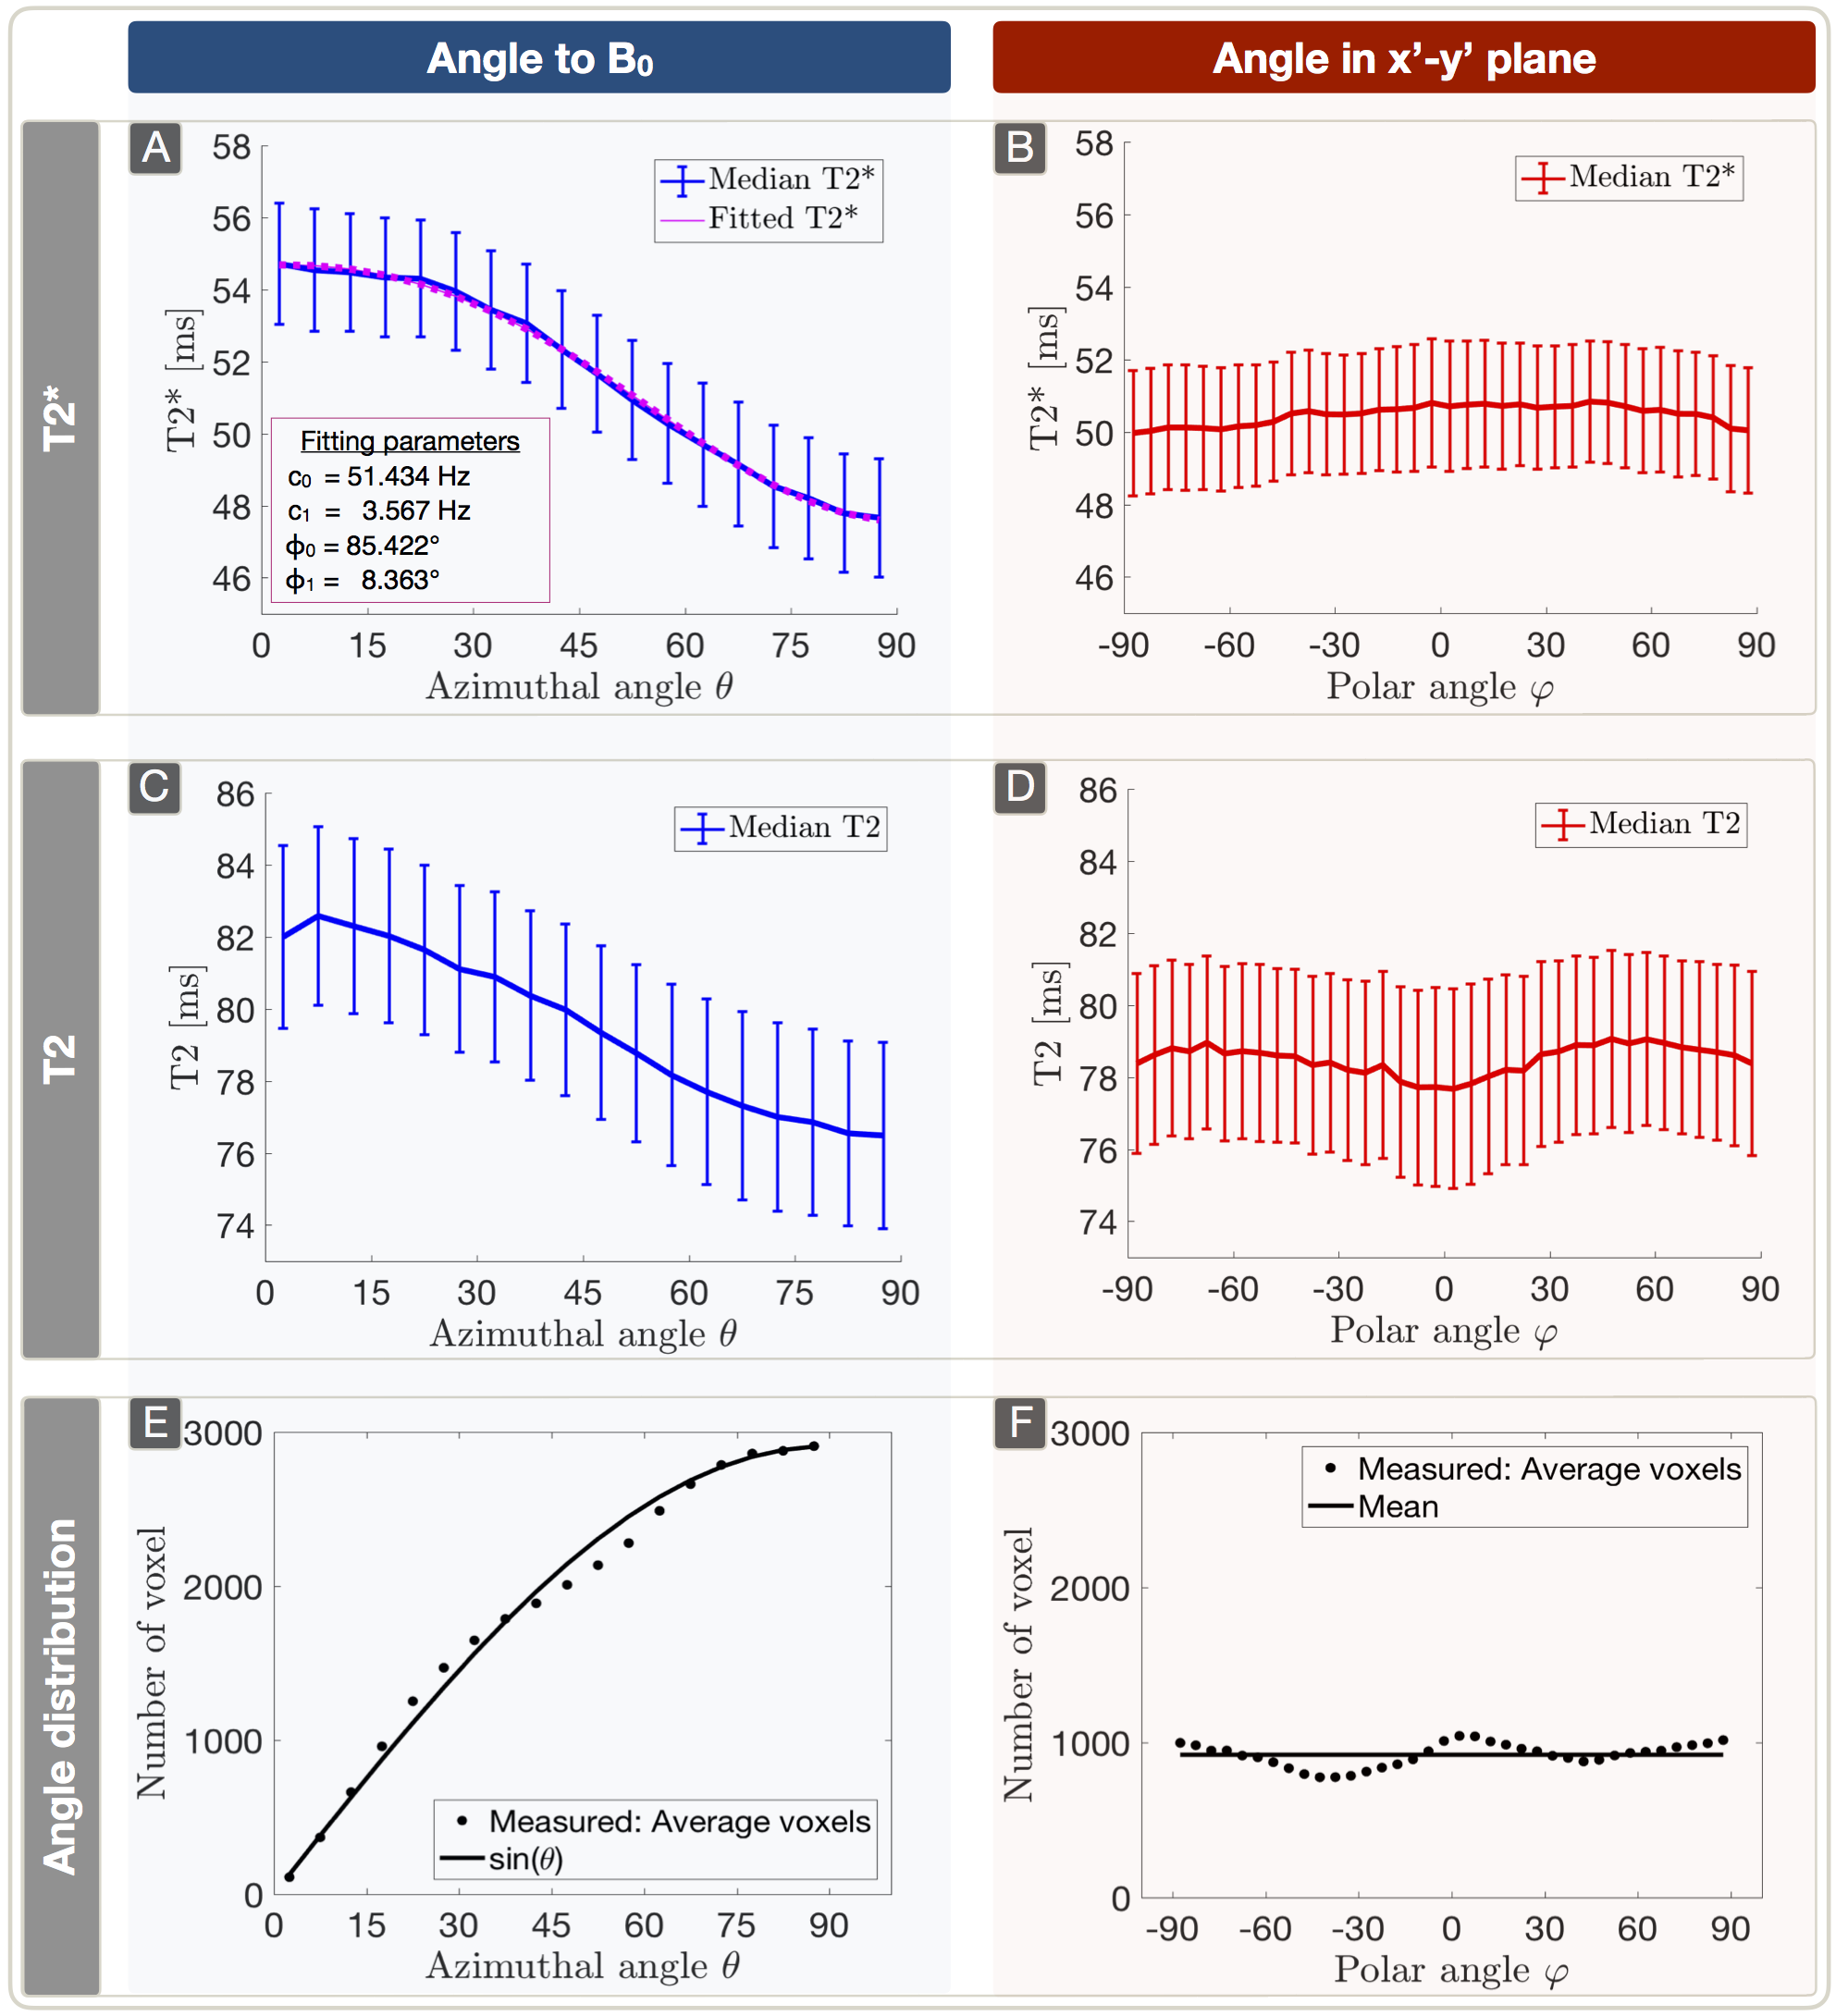
Figure 3: Dependency of T2* (A,B) and T2 (C,D) on azimuthal and polar angles (median ± standard error across subjects) and frequency of spherical angles (E,F). Parameter values were evaluated within 5° bins. The plots show a strong dependence of T2*(θ) (A) and T2(θ) (C) with θ describing the angle between the main-nerve-fiber orientation and B0. The T2* angle dependency is fitted by T2*(θ) = c0 + c1sin(2θ+φ0) + c2sin(4θ+φ1) (A).17 As expected, no significant angle dependency of any parameter was observed in the x’-y’ plane perpendicular to B0 (B,D). The average angle frequency-distribution shows equally populated orientations, respectively (E,F).9
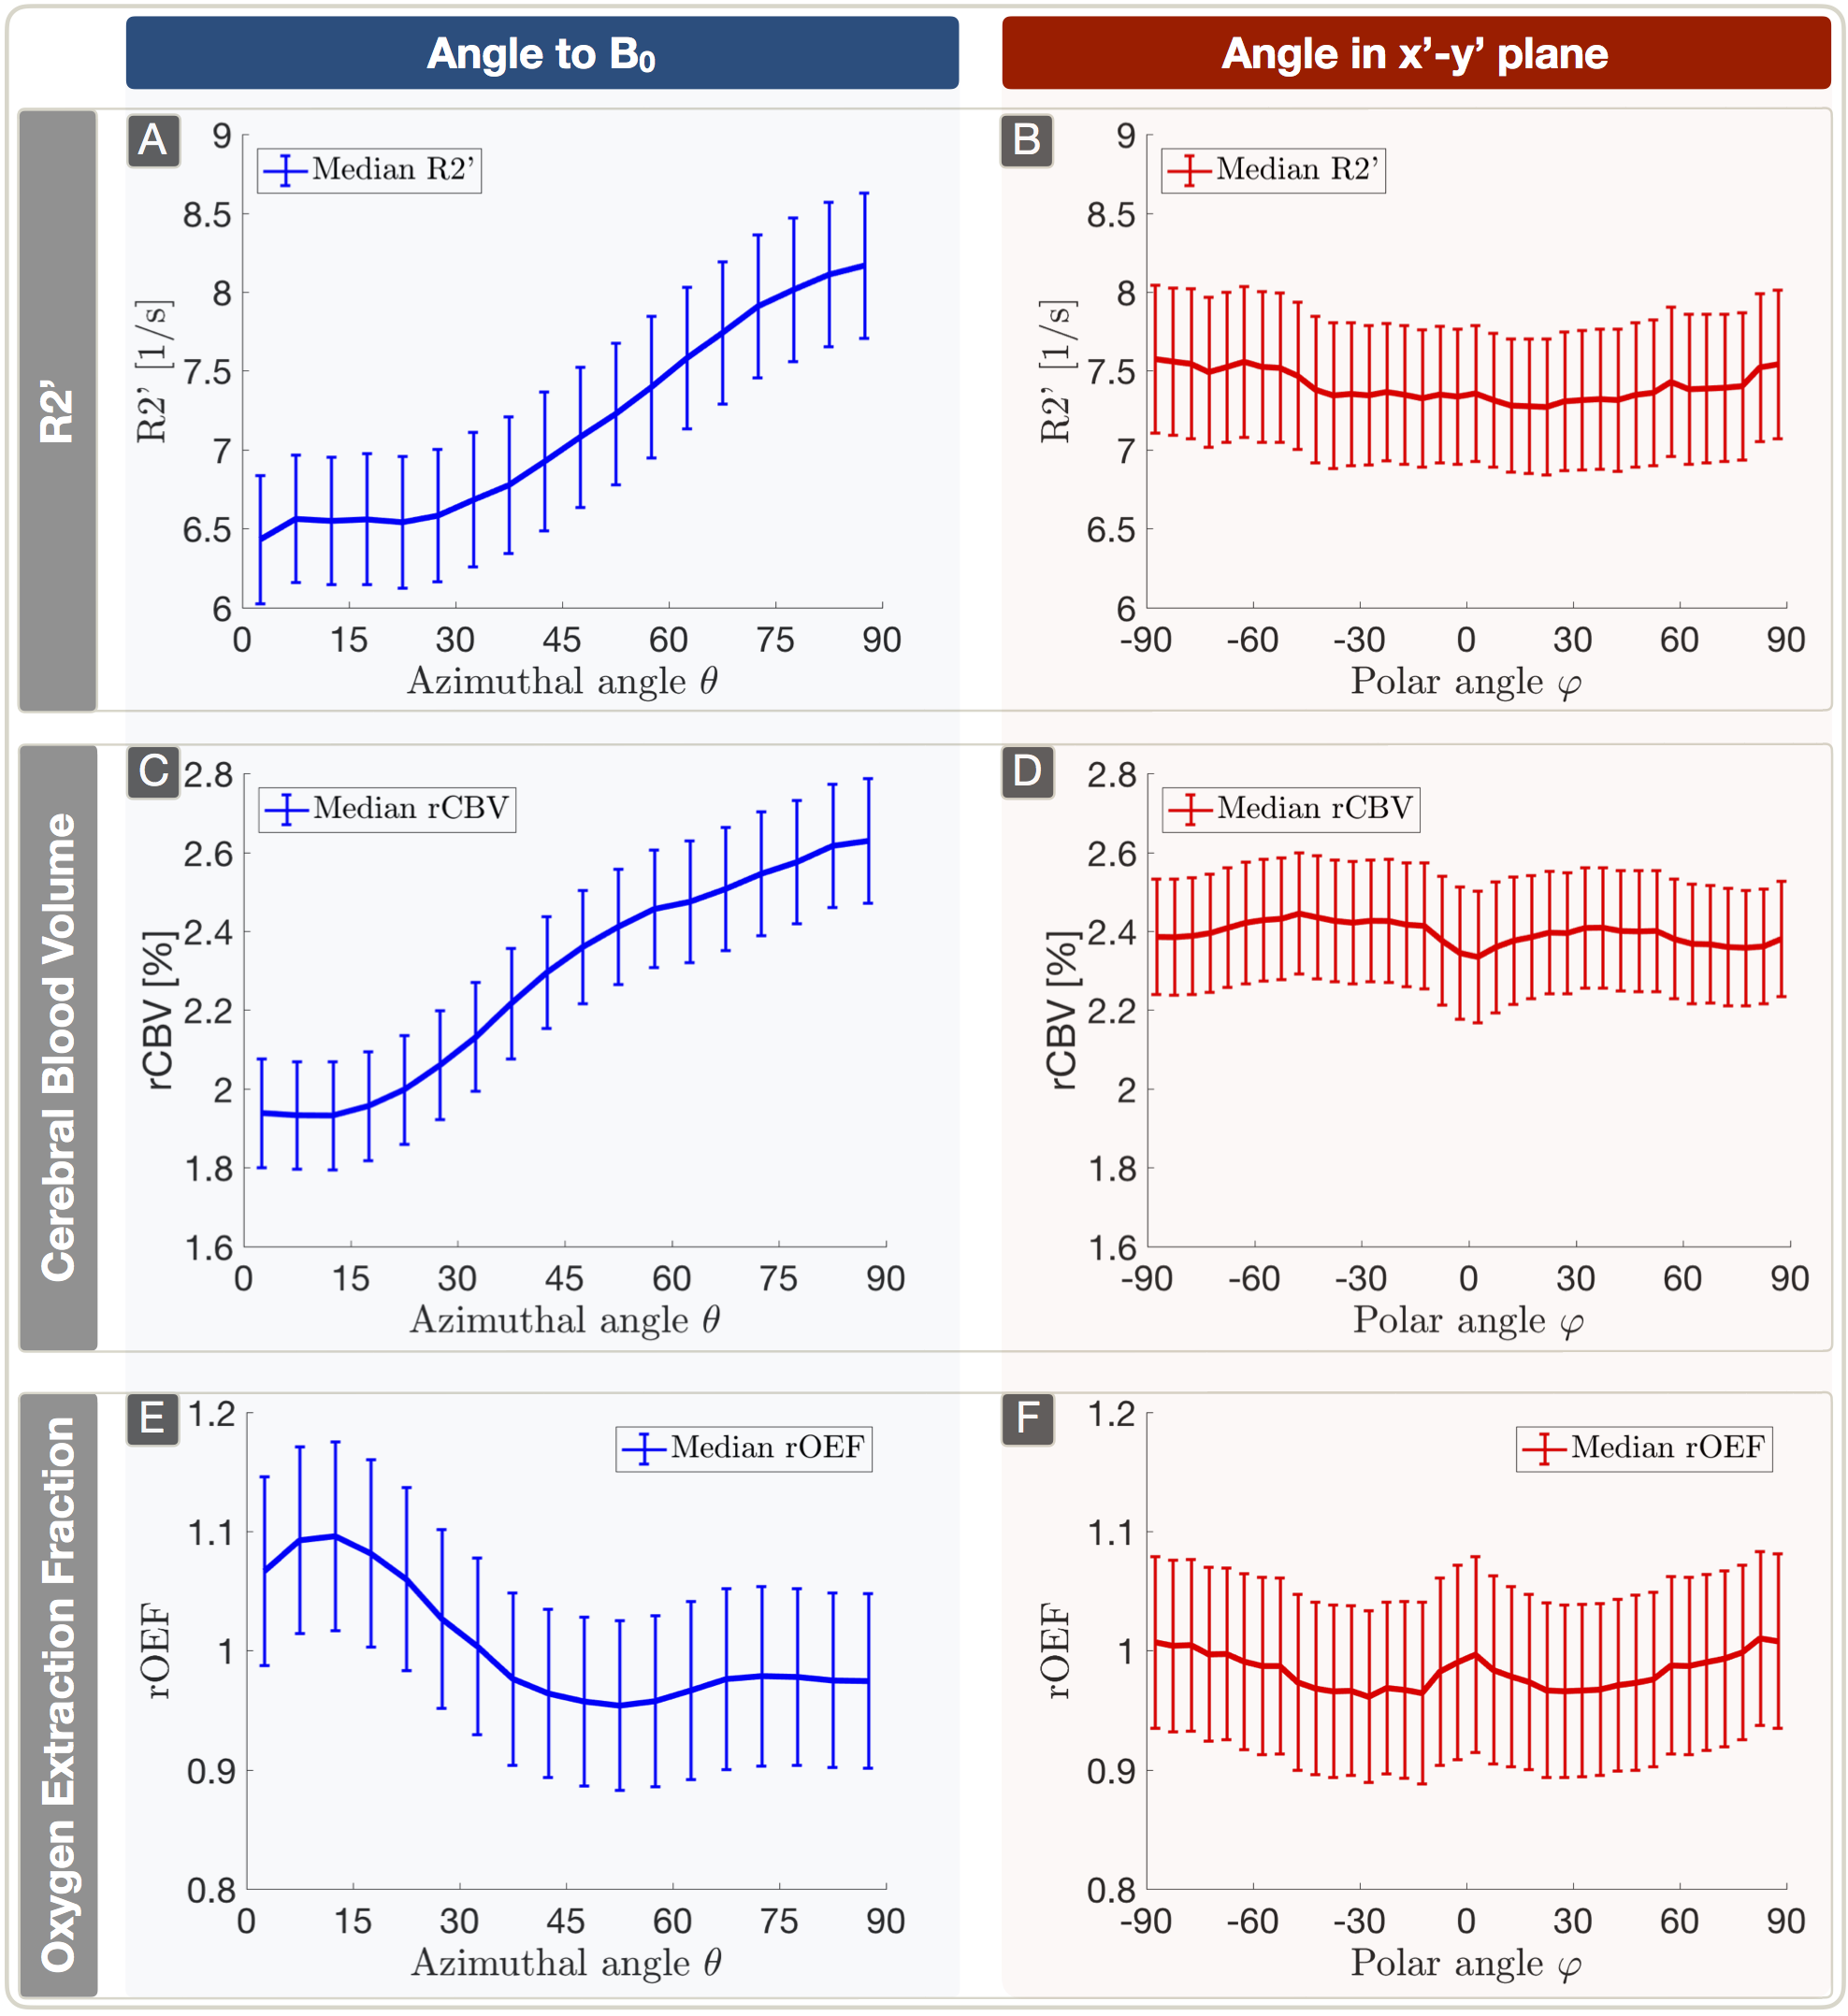
Figure 4: Plots (median ± standard error across subjects) of R2’ (A,B), rCBV (C,D) and rOEF (E,F) vs. both angles. Parameter values were evaluated within 5° bins. R2’ was derived from T2* and T2 and shows strong dependency on θ (A). rCBV shows a similar behavior with an even stronger dependency on θ (C). The anisotropy effects of rOEF are driven by the different slopes of R2’ (A) and rCBV (C) resulting in a smaller dependency of rOEF on θ (E). Overall, no significant anisotropy effects were observed in the x’-y’ plane perpendicular to B0 (B,D,F).
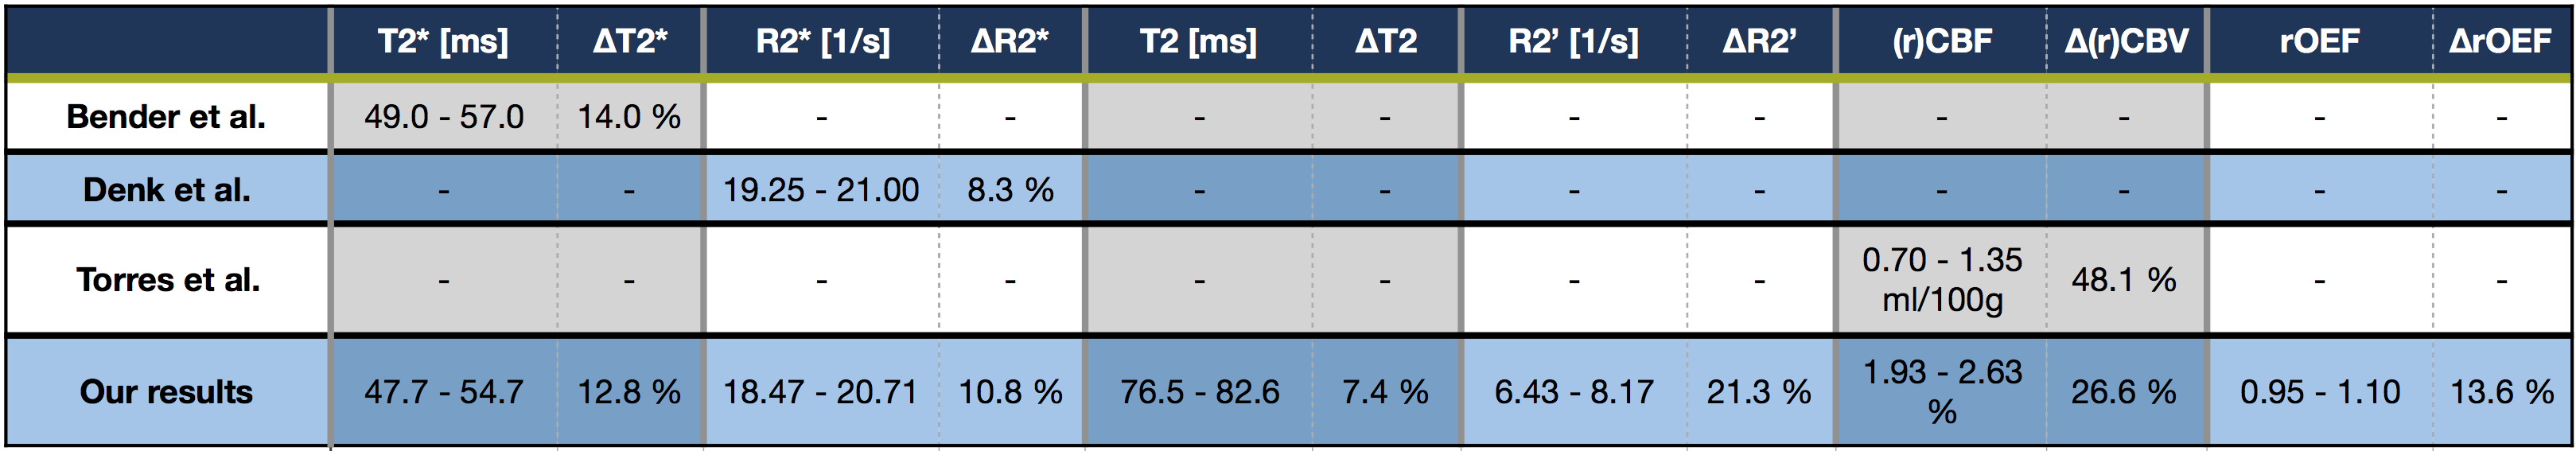
Table 1: Comparison of our results to latest in-vivo literature values. Shown is the range of observed parameter mean values and their changes in percent depending on the main-nerve-fiber orientation relative to B0 for 0° < θ < 90°.8-10 All studies were acquired at 3T. While Hernandez-Torres et al8 measured absolute CBV, our rCBV was normalised to normal appearing deep-WM.25