0501
Demonstrating a novel non-contrast MR perfusion technique: EVM-EPI MR perfusion1Neuroradiology, Massachusetts General Hospital, Boston, MA, United States, 2Radiology, University of Pittsburgh Medical Center, Pittsburgh, PA, United States, 3Neurology, University of Pittsburgh, Pittsburgh, PA, United States, 4Radiology, Massachusetts General Hospital, Boston, MA, United States
Synopsis
EVM-EPI MR perfusion is a novel, non-contrast MR perfusion technique, which amplifies latent imperceptible contrast variation in perfused tissue of a T2*-weighted cine acquisition via Fourier methods at frequencies of cardiac perfusion.
Introduction
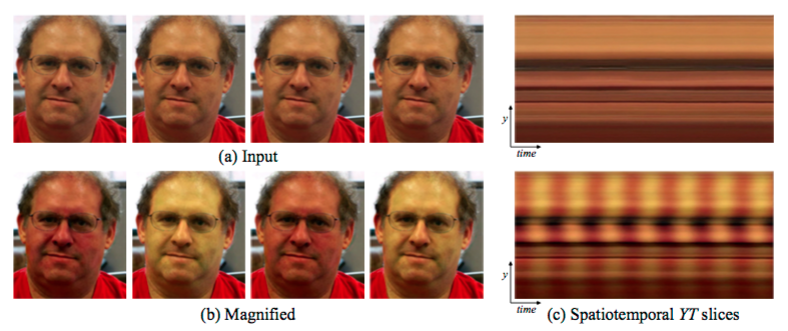
Eulerian video magnification (EVM) [1] and phase-based motion processing technique [2,3] developed at the MIT Computer Science and Artificial Intelligence Laboratory (CSAIL), have enabled the selective amplification of attenuation of specific frequency ranges within visible light video by demonstrating computationally-efficient methods of Fourier analysis and frequency selective motion amplification or attenuation to video elements. These methods permit the investigation of latent recorded but imperceptible periodic motion and color changes within video. By amplifying frequencies of human perfusion (60-100bpm) by over 100x in the Fourier domain, Wu and colleagues have retrospectively demonstrated a subject’s heart rate by visualizing skin alternately flush and blanch. The phase-based approach to manipulating motion in videos by analyzes the signals of local phase over time in different spatial scales and orientations with improved noise resistance. A two-stage combination of pulse amplification with initial phase-based motion cancellation followed by EVM pulse magnification decreases motion artifact and improves performance.
Several complications of dynamic susceptibility contrast MR perfusion include urgently obtaining intravenous access, the risk of nephrogenic sclerosing fibrosis, and the unknown clinical significance of intraparenchymal gadolinium deposition. ASL MR perfusion characterizes cerebral blood flow, but spin-tagging techniques suffer from magnetization transfer and arterial transit effect inaccuracies, and compensatory techniques can result in excess tissue energy deposition, limiting slice coverage and acquisition time. [4] To address these challenges, a novel non-contrast MR perfusion method was developed using EVM to amplify perfusion signals in a rapidly-acquired EPI sequence we describe as EVM-EPI MR perfusion.
Methods
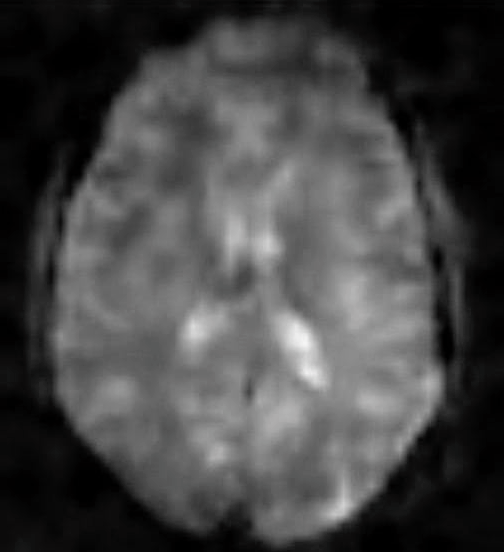
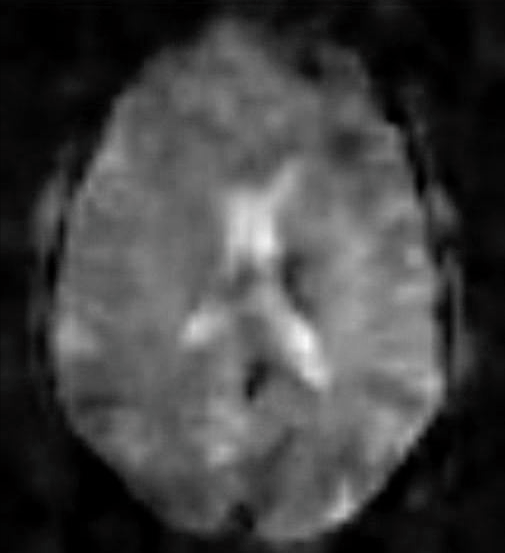
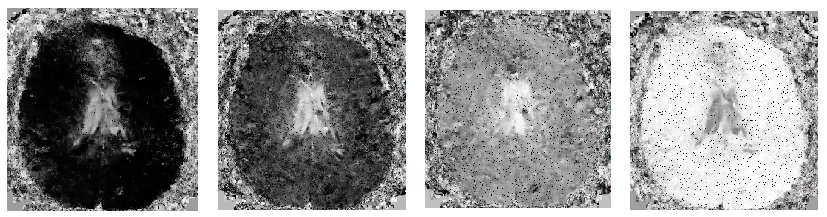
Preliminary investigations of retrospectively amplifying cardiac perfusion frequencies of non-contrast, resting state BOLD MR demonstrates pulsatile tissue contrast change appears to correspond to perfusion T2* effects, and could potentially form the basis of a non-contrast MR perfusion technique. Above, two frames of a resting state BOLD MR cine sequence demonstrate pulsatile changes in the contrast of perfused tissues.
EVM-EPI MR perfusion acquires a 30-second, single slice EPI sequence, based on a modified cine CSF flow sequence. A literature review demonstrated maximum cardiac perfusion interference with T2* weighted BOLD fMRI at TE: 50ms at 1.5T and TE: 35ms at 3T, and a goal of accurately capturing tachycardic perfusion rates set TR: 100ms to avoid aliasing with perfusion signals changing at up to 300bpm. Inflowing blood results in T2* degradation of the EPI image, and the EPI sequence is post-processed with custom Matlab (Mathworks – Natick, MA) software, which performs phase-based motion attenuation, EVM perfusion signal amplification, and integrated preliminary perfusion analysis [5]. The maximum power heart rate is selected from the power spectral density for perfusion analysis from the range of 40 – 120 bpm, and the most-commonly occurring pulses of equal length are averaged together to improve the perfusion signal-to-noise ratio and reduce beat-to-beat perfusion variability.
Results
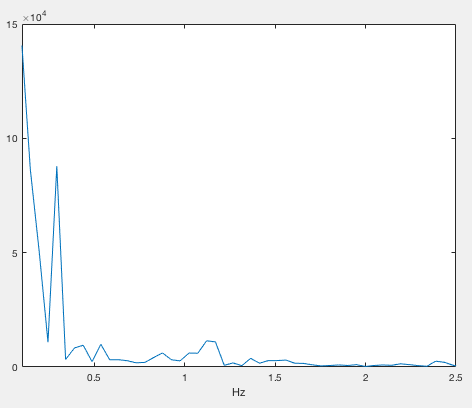
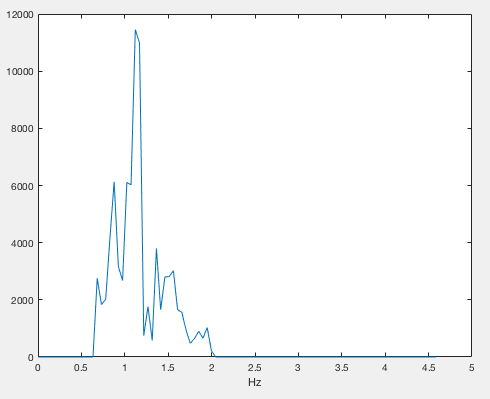
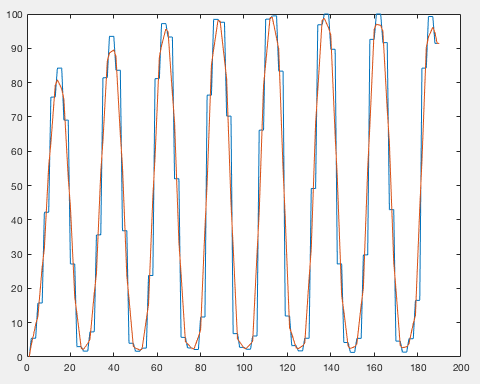
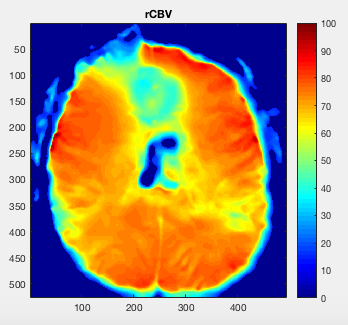
Top Left: Typical EVM-EPI MR power spectral density of frequencies from 0.1 – 2.5Hz. Top Right: Amplifying perfusion frequencies from 40 – 120 bpm to identify the maximum power heart rate frequency: 67.25 bpm. Bottom Left: Phase-lock and mode pulse selection at 67.25 bpm. Right: Relative computed blood flow; note frontal susceptibility artifact due to nasal cavity proximity, present in acquired EPI basis. Processing time: 8 min, 6 sec on 2013 MacBook Air.Discussion
Amplifying the maximum power heart rate frequency in the Fourier domain, results in a similar pattern (above), with increased artifact compared with the EVM and phase-based video processing.Conclusion
EPI-EVM MR perfusion is a novel, non-contrast MR perfusion technique, which amplifies latent T2* contrast variation produced by tissue perfusion. Additionally, no arterial tagging is required to develop relative cerebral blood flow maps.
To further develop an EVM-EPI MR perfusion model, we will describe pending grant-funded retrospective analysis of CT perfusion cine imaging from 10 normal (control) and 40 patients with perfusion anomalies to estimate and validate an arterial input function and calculate a tissue concentration curve for the EVM-EPI MR perfusion technique, permitting development of computed blood flow and mean transit time perfusion maps.
Acknowledgements
No acknowledgement found.References
1. Hao-Yu Wu, Michael Rubinstein, Eugene Shih, John Guttag, Frédo Durand, William T. Freeman. Eulerian Video Magnification for Revealing Subtle Changes in the World. ACM Transactions on Graphics, Volume 31, Number 4 (Proc. SIGGRAPH), 2012.
2. Neal Wadhwa, Michael Rubinstein, Frédo Durand, William T. Freeman Phase-based Video Motion Processing. ACM Transactions on Graphics, Volume 32, Number 4 (Proc. SIGGRAPH), 2013.
3. Neal Wadhwa, Michael Rubinstein, Frédo Durand, William T. Freeman. Riesz Pyramids for Fast Phase-Based Video Magnification. Computational Photography (ICCP), 2014 IEEE International Conference. Petrella and Provenzale. MR Perfusion Imaging of the Brain Techniques and Applications. American Journal of Roentgenology. 2000;175: 207-219.
4. Tomandl, Klotz, Phys, et al. Comprehensive Imaging of Ischemic Stroke with Multisection CT. RadioGraphics. 2003; 23:565–592.
Figures