0500
Improved reliability for mapping water exchange across blood-brain barrier by diffusion prepared three-dimensional pseudo-continuous arterial spin labeling1Laboratory of FMRI Technology (LOFT), Mark & Mary Stevens Neuroimaging and Informatics Institute, Keck School of Medicine, University of Southern California, Los Angeles, CA, United States
Synopsis
A 3D diffusion-prepared gradient and spin echo (GRASE) pseudo-continuous ASL (pCASL) sequence was proposed to improve the reliability for mapping water exchange across the BBB non-invasively. The motion sensitive non-CPMG component signal was eliminated by gradients to spread the diffusion weighted signal across 4π before GRASE readout. Based on test-retest scans (~2 weeks apart) in aged subjects (67±8yrs), excellent reproducibility (ICC=0.87) was achieved for water exchange rate (Kw) measured by the proposed 3D sequence. Whole brain Kw was averaged to be 107.7±19.0 min-1 and 113.0±17.8 min-1 for the proposed 3D and 2D DW-pCASL method, respectively, well matching the literature results.
Background
Diffusion weighted arterial spin labeling (DW-ASL) has been proposed for non-contrast measurement of water exchange across the blood-brain barrier (BBB).1 Recent animal and human studies have shown that DW-ASL is able to detect water exchange rate (Kw) changes in ischemic reperfusion model and obstructive sleep apnea.2-3 However, existing Kw studies employed DW-ASL with 2D EPI readout which suffers from relatively low signal-to-noise ratio (SNR). In addition, the diffusion gradient sensitizes ASL signals to motion and other physiological noise, resulting in a relatively lengthy scan time to obtain a reliable measurement of Kw. The purpose of this work was to present a novel diffusion-prepared 3D gradient and spin echo (GRASE) pseudo-continuous ASL (pCASL) sequence to improve the reliability for mapping water exchange across the BBB.Pulse Sequence
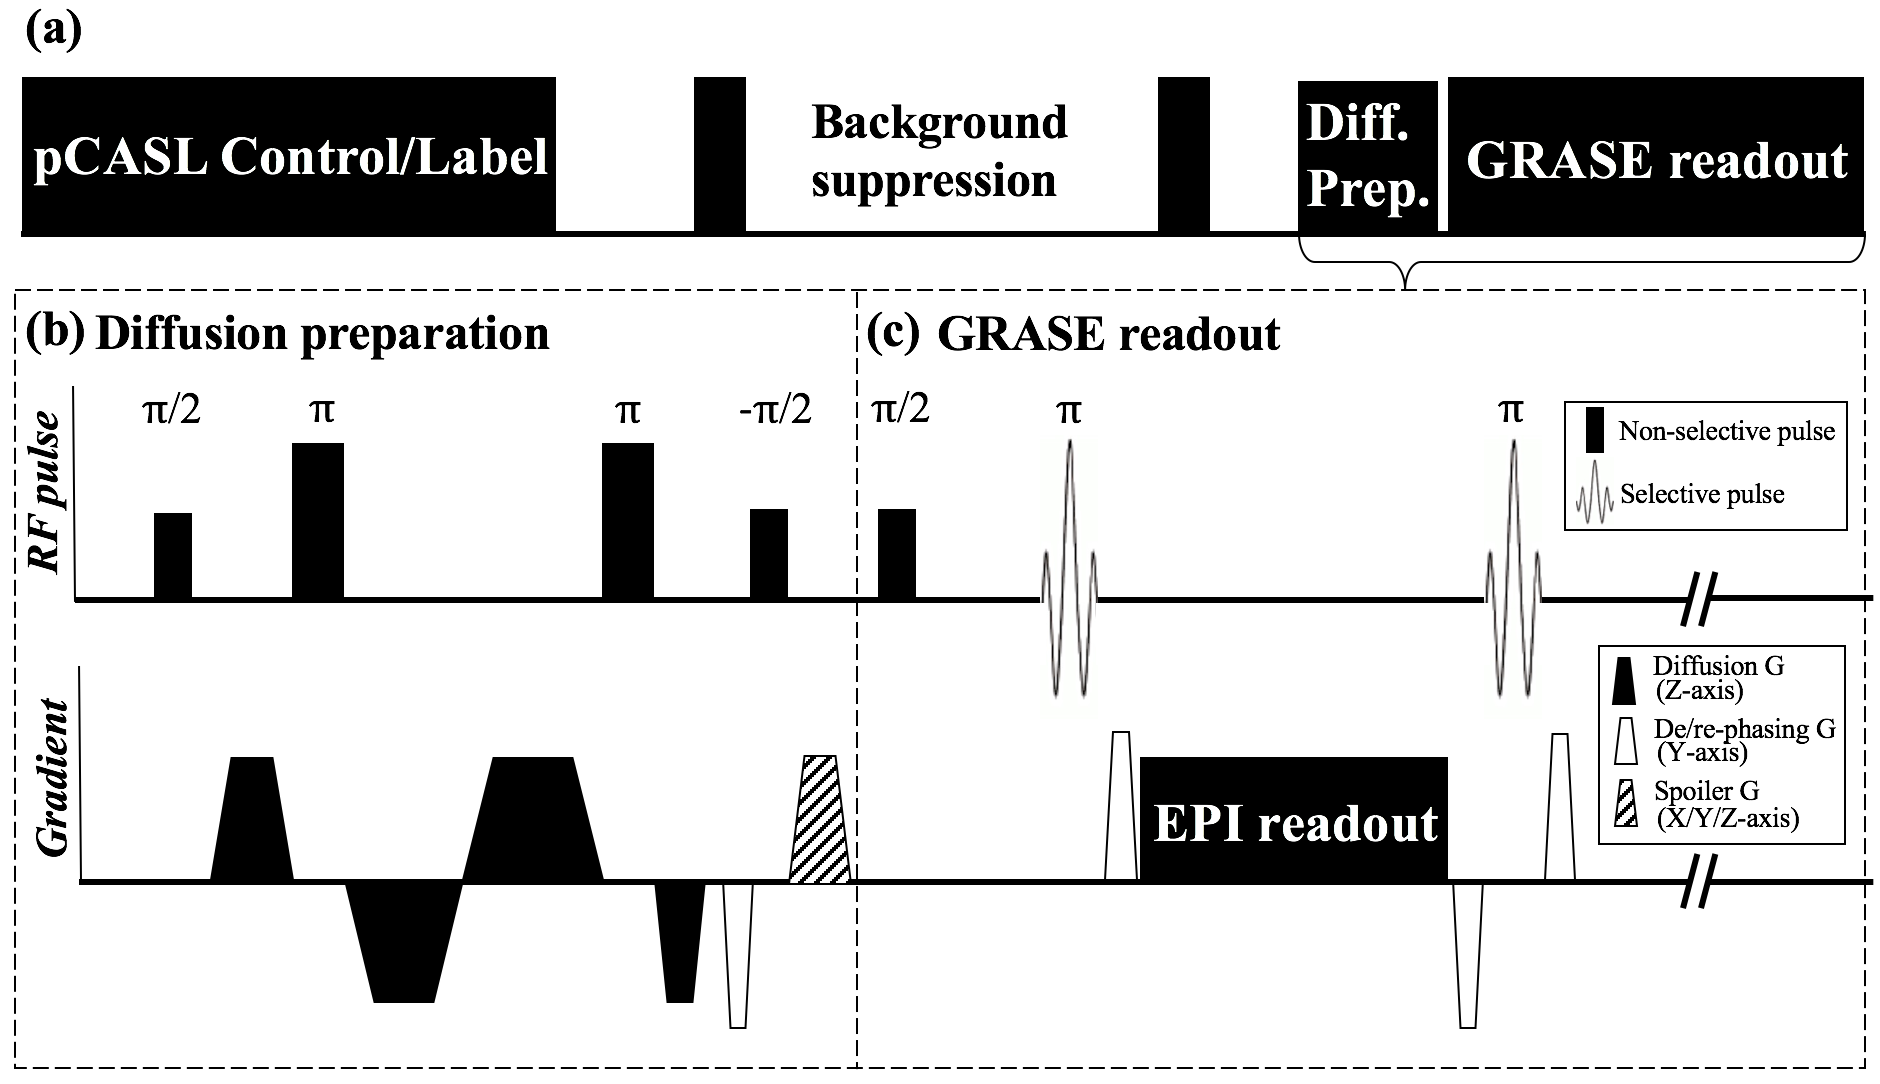
Figure 1 (a) shows the sequence diagram, which consists of pCASL labeling, background suppression/post-labeling delay (PLD), diffusion preparation and GRASE readout. Diffusion preparation was implemented by non-selective pulses and bi-polar gradients along z-direction.4 Eddy current was minimized by optimizing the timing of gradients (Fig. 1b).5 Transverse magnetization was tipped-up before GRASE readout with a spoiler to destroy residual phase. Bulk motion during the diffusion encoding induces spatially varying phase shift, which nulls GRASE signal due to violation of CPMG condition. To eliminate the phase sensitivity, spins were spread out within each voxel by de-phasing gradients before the tip-up, and re-phasing/rewinding gradients were added before and after each EPI readout, as proposed by Alsop6 (Fig. 1b, c). This non-CMPG approach can eliminate sensitivity to motion, however at the cost of half signal intensity.6 Imaging parameters were: FOV=224mm, 12 slices (10% oversampling), turbo factor=14, resolution=3.5×3.5×8mm3, TE=36.5ms, TR=4000ms, label/control duration=1500ms.Theory
Kw, defined as capillary permeability surface-area product of water (PSw) divided by distribution volume of water tracer in capillary space (Vc), was calculated based on a monotonic relationship with the fraction of capillary signal:1
$$K_{w}=f(A_{1},\tau_{a}), A_{1}=\frac{∆M_{c}(t)}{∆M_{c}(t)+∆M_{b}(t)}$$[1]
where $$$∆M_{c}(t)$$$and $$$∆M_{b}(t)$$$ are ASL contributions from the capillary and tissue space. $$$\tau_{a}$$$ is arterial transit time, which was determined by the flow-encoding arterial spin tagging (FEAST) method.7 Capillary signal would be suppressed by a small diffusion gradient due to pseudo diffusion or microvascular flow, and $$$A_{1}$$$ can be calculated by:
$$A_{1}=1-\frac{∆M(b=b_{DW})}{∆M(b=0)}$$[2]
Where $$$∆M$$$ is perfusion signal.
MR Experiment
MR scans were performed on a 3T Siemens Prisma scanner. DW-pCASL with two PLDs (1500,1800ms) and seven b-values (0,5,10,25,50,100,200s/mm2) was performed in 4 subjects (2M, age=25±3yrs) with 20 repetitions for each b-value. Bi-exponential fitting was conducted to calculate the apparent diffusion coefficients for capillary (Dc) and tissue (Db) compartment, and determine the appropriate $$$b_{DW}$$$ for suppressing capillary signal while having minimal effect on tissue signal. A 2-stage approach proposed by St Lawrence et al1 was employed for Kw measurement: 1) PLD=900ms and b=0,14 s/mm2 (VENC=7.5mm/s) for FEAST scan (15 measurements each b-value, TA=4min); and 2) PLD=1800ms and b=0,50 s/mm2 for Kw measurement (20 measurements each b-value, TA=5min20sec). Reproducibility was evaluated by intra-class correlation coefficient (ICC) of test-retest scans ~2 weeks apart in four subjects (2M, age=67±8yrs), and compared with 2D DW-pCASL in five subjects from the same study cohort (2M, age=68±6 yrs) with similar imaging parameters.Result and discussion
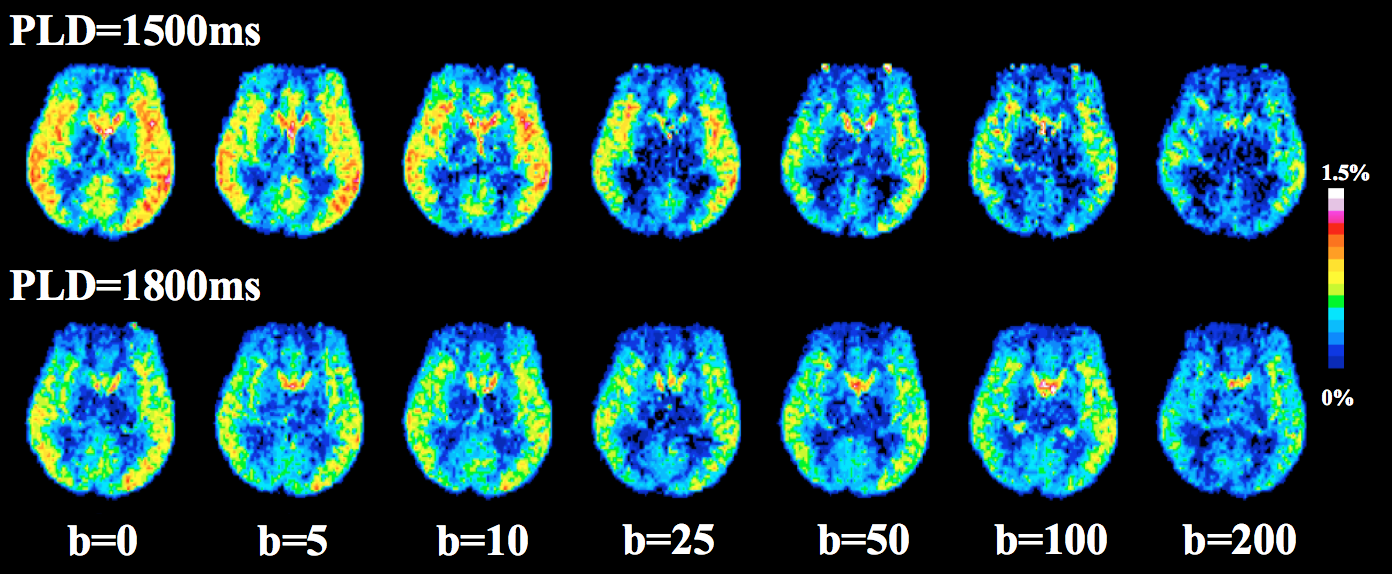
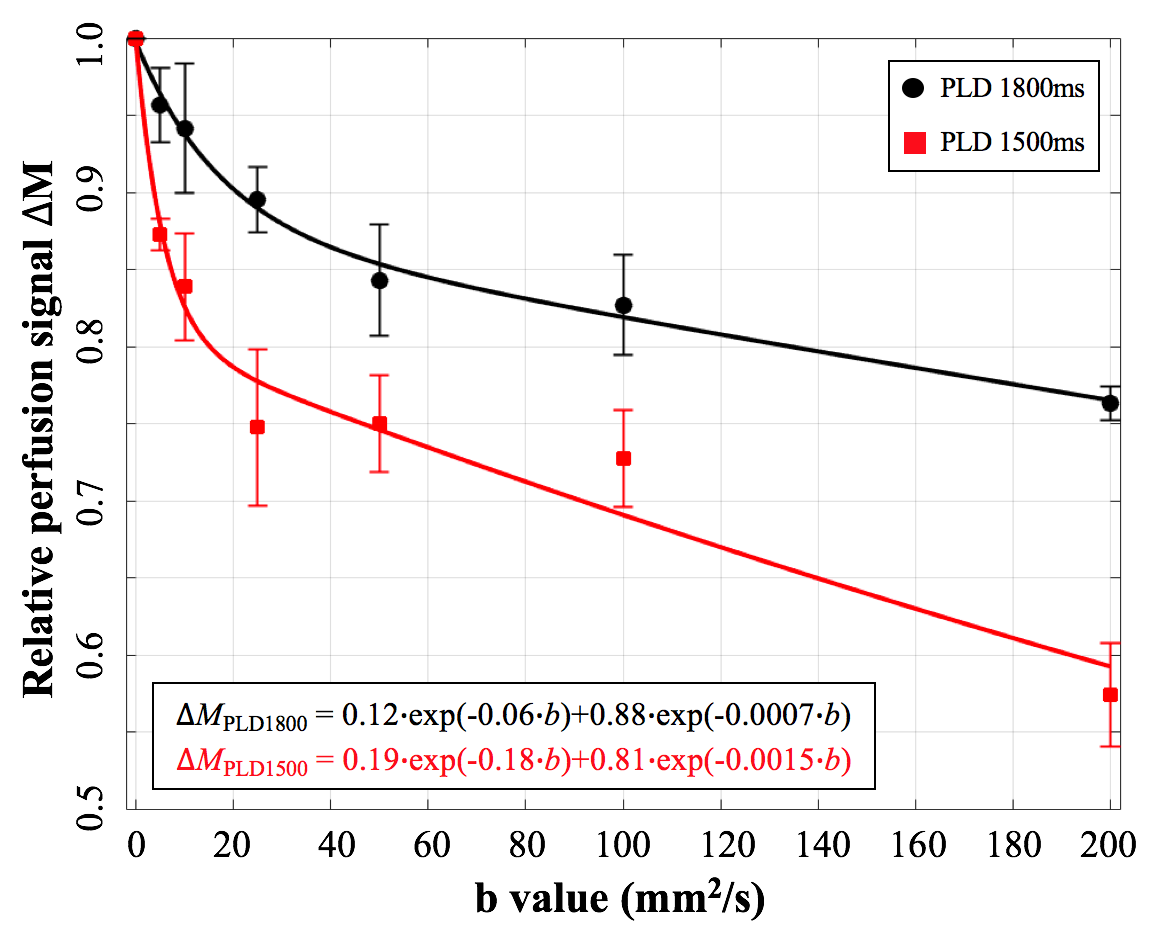
Figure 2 shows DW pCASL images with seven diffusion weightings. Figure 3 shows average signal curve from four subjects which clearly shows a pattern of bi-exponential decay. Bi-exponential fitting results are shown in the left bottom corner of Figure 3. 7% more labeled water enters into tissue with longer PLD. $$$b_{DW}$$$=50s/mm2 and PLD=1800ms were chosen for Kw measurement, since $$$∆M$$$(b=50) contains 0.7% and 99.3% of capillary and tissue signal, respectively.
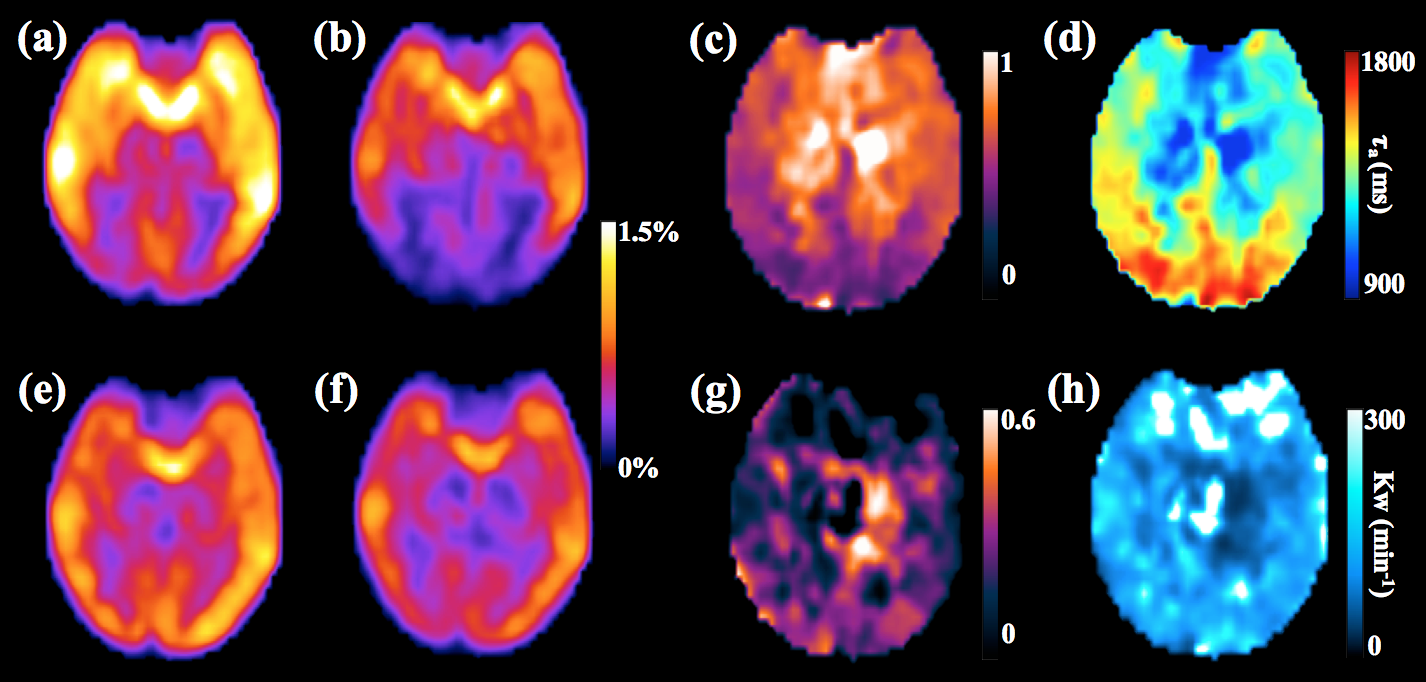
Figure 4 (a,b,e,f) show perfusion images with and without diffusion weighting using the proposed sequence at PLD of 1500 and 1800ms, respectively. Figure 4 (c,d) show the ratio image $$$∆M_{PLD900,b14}/∆M_{PLD900,b0}$$$ and $$$\tau_{a}$$$ image, respectively. Prolonged $$$\tau_{a}$$$ was observed around posterior cerebral artery (PCA) territories, which is consistent with literature results.7 Capillary fraction map A1 and Kw images are shown in Figure 4 (g,h), respectively. Kw map is relatively uniform except a few bright regions where A1 is close to or smaller than zero, likely due to noise.
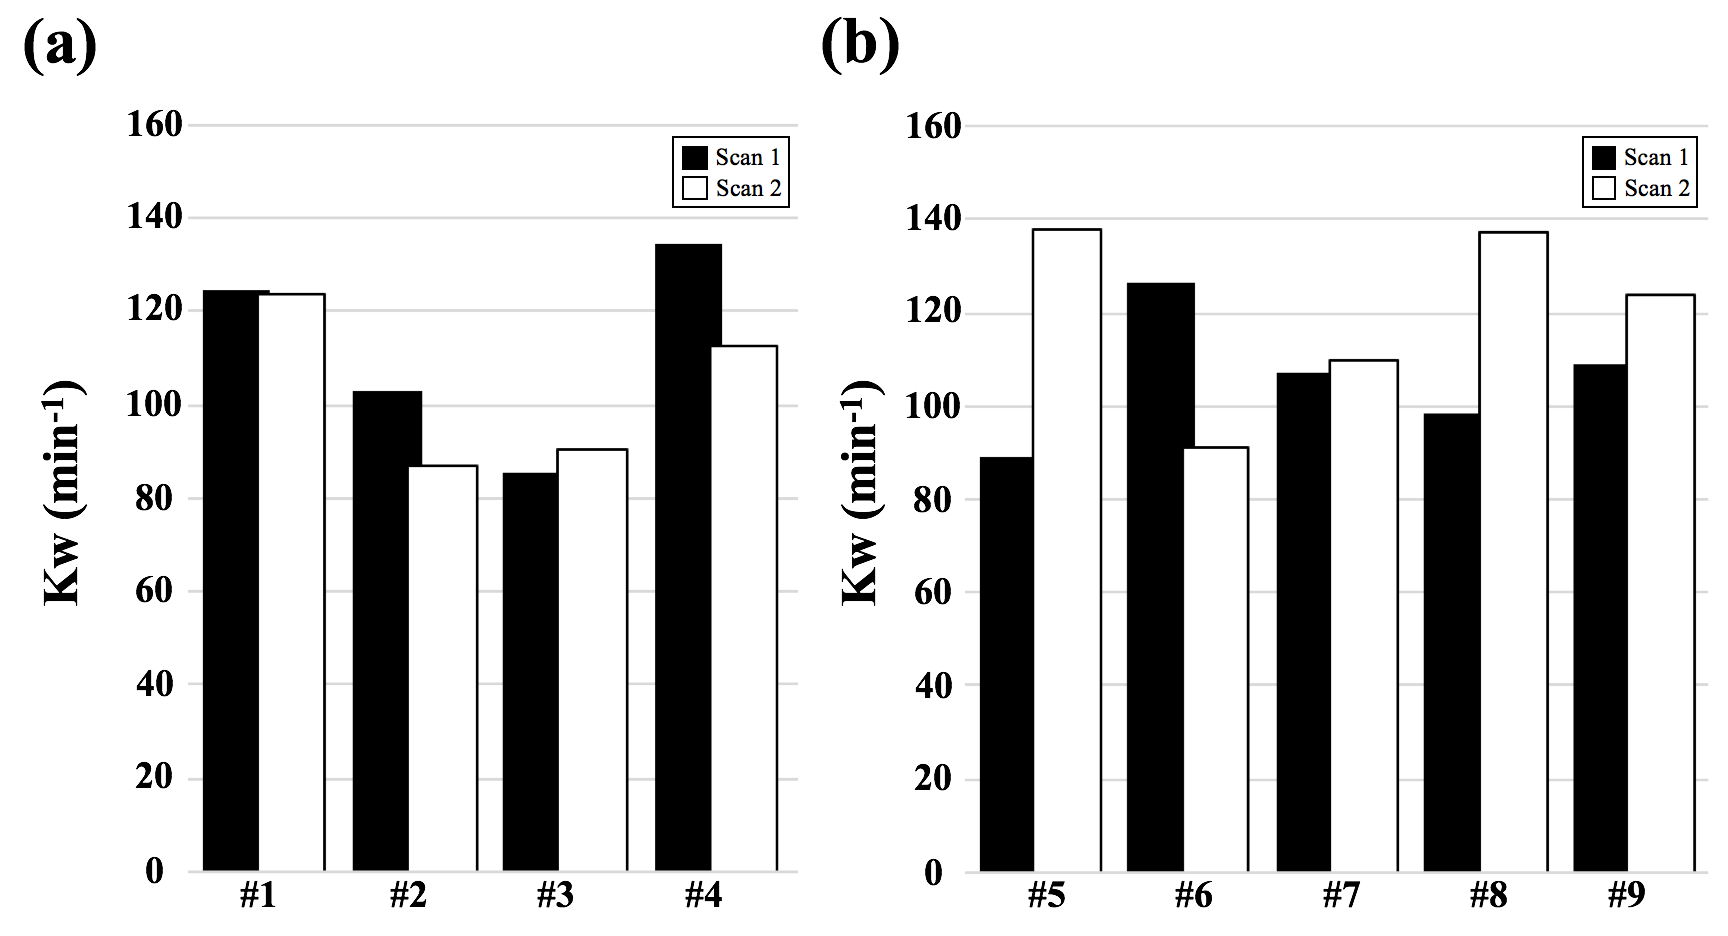
Figure 5 shows average Kw from test-retest experiments using the proposed 3D and 2D DW-pCASL sequence. Excellent reproducibility (ICC=0.87) was achieved for Kw measured by the proposed 3D sequence, while poor reproducibility was found for 2D DW-pCASL result (ICC<0). Whole brain Kw was averaged to be 107.7±19.0 min-1 and 113.0±17.8 min-1 for the proposed 3D and 2D DW-pCASL method, respectively, well matching the literature results.1
Conclusion
A 3D DW-pCASL sequence was proposed to measure BBB permeability non-invasively with high reproducibility. Its clinical use for the detection of BBB dysfunction before the leakage of large-molecule contrast agents awaits evaluation.Acknowledgements
This work was supported by National Institute of Health (NIH) grant UH2-NS100614.References
[1] St Lawrence K S, Owen D, Wang D J J. A two-stage approach for measuring vascular water exchange and arterial transit time by diffusion‐weighted perfusion MRI[J]. Magnetic resonance in medicine, 2012, 67(5): 1275-1284.
[2] Tiwari Y V, Lu J, Shen Q, et al. Magnetic resonance imaging of blood–brain barrier permeability in ischemic stroke using diffusion-weighted arterial spin labeling in rats[J]. Journal of Cerebral Blood Flow & Metabolism, 2017, 37(8): 2706-2715.
[3] Palomares J A, Tummala S, Wang D J J, et al. Water Exchange across the Blood‐Brain Barrier in Obstructive Sleep Apnea: An MRI Diffusion‐Weighted Pseudo‐Continuous Arterial Spin Labeling Study[J]. Journal of Neuroimaging, 2015, 25(6): 900-905.
[4] Nguyen C, Fan Z, Sharif B, et al. In vivo three‐dimensional high resolution cardiac diffusion‐weighted MRI: A motion compensated diffusion‐prepared balanced steady‐state free precession approach[J]. Magnetic resonance in medicine, 2014, 72(5): 1257-1267.
[5] Reese T G, Heid O, Weisskoff R M, et al. Reduction of eddy‐current‐induced distortion in diffusion MRI using a twice‐refocused spin echo[J]. Magnetic resonance in medicine, 2003, 49(1): 177-182.
[6] Alsop D C. Phase insensitive preparation of single‐shot RARE: Application to diffusion imaging in humans[J]. Magnetic resonance in medicine, 1997, 38(4): 527-533.
[7] Wang J, Alsop D C, Song H K, et al. Arterial transit time imaging with flow encoding arterial spin tagging (FEAST)[J]. Magnetic resonance in medicine, 2003, 50(3): 599-607.
Figures