0498
Evaluation of UTE for improved contrast enhanced DCE MRI at 7T1Center for Magnetic Resonance Research, Department of Radiology, University of Minnesota, Minneapolis, MN, United States
Synopsis
We investigated the feasibility of using an ultrashort echo time (UTE) technique for DCE MRI imaging of prostate cancer patients at 7T to minimize the impact of the increased R2* relaxivity on signal enhancement curves and pharmacokinetic parameter assessment. The Gd concentration-time curves and pharmacokinetic parameter maps were compared to clinical DCE MRI at 3T. The proposed method achieved DCE MRI at 7T with a signal time course comparable to 3T DCE MRI but with increased SNR for improved spatial resolution and no R2* effects, which are exacerbated with increasing field.
Purpose
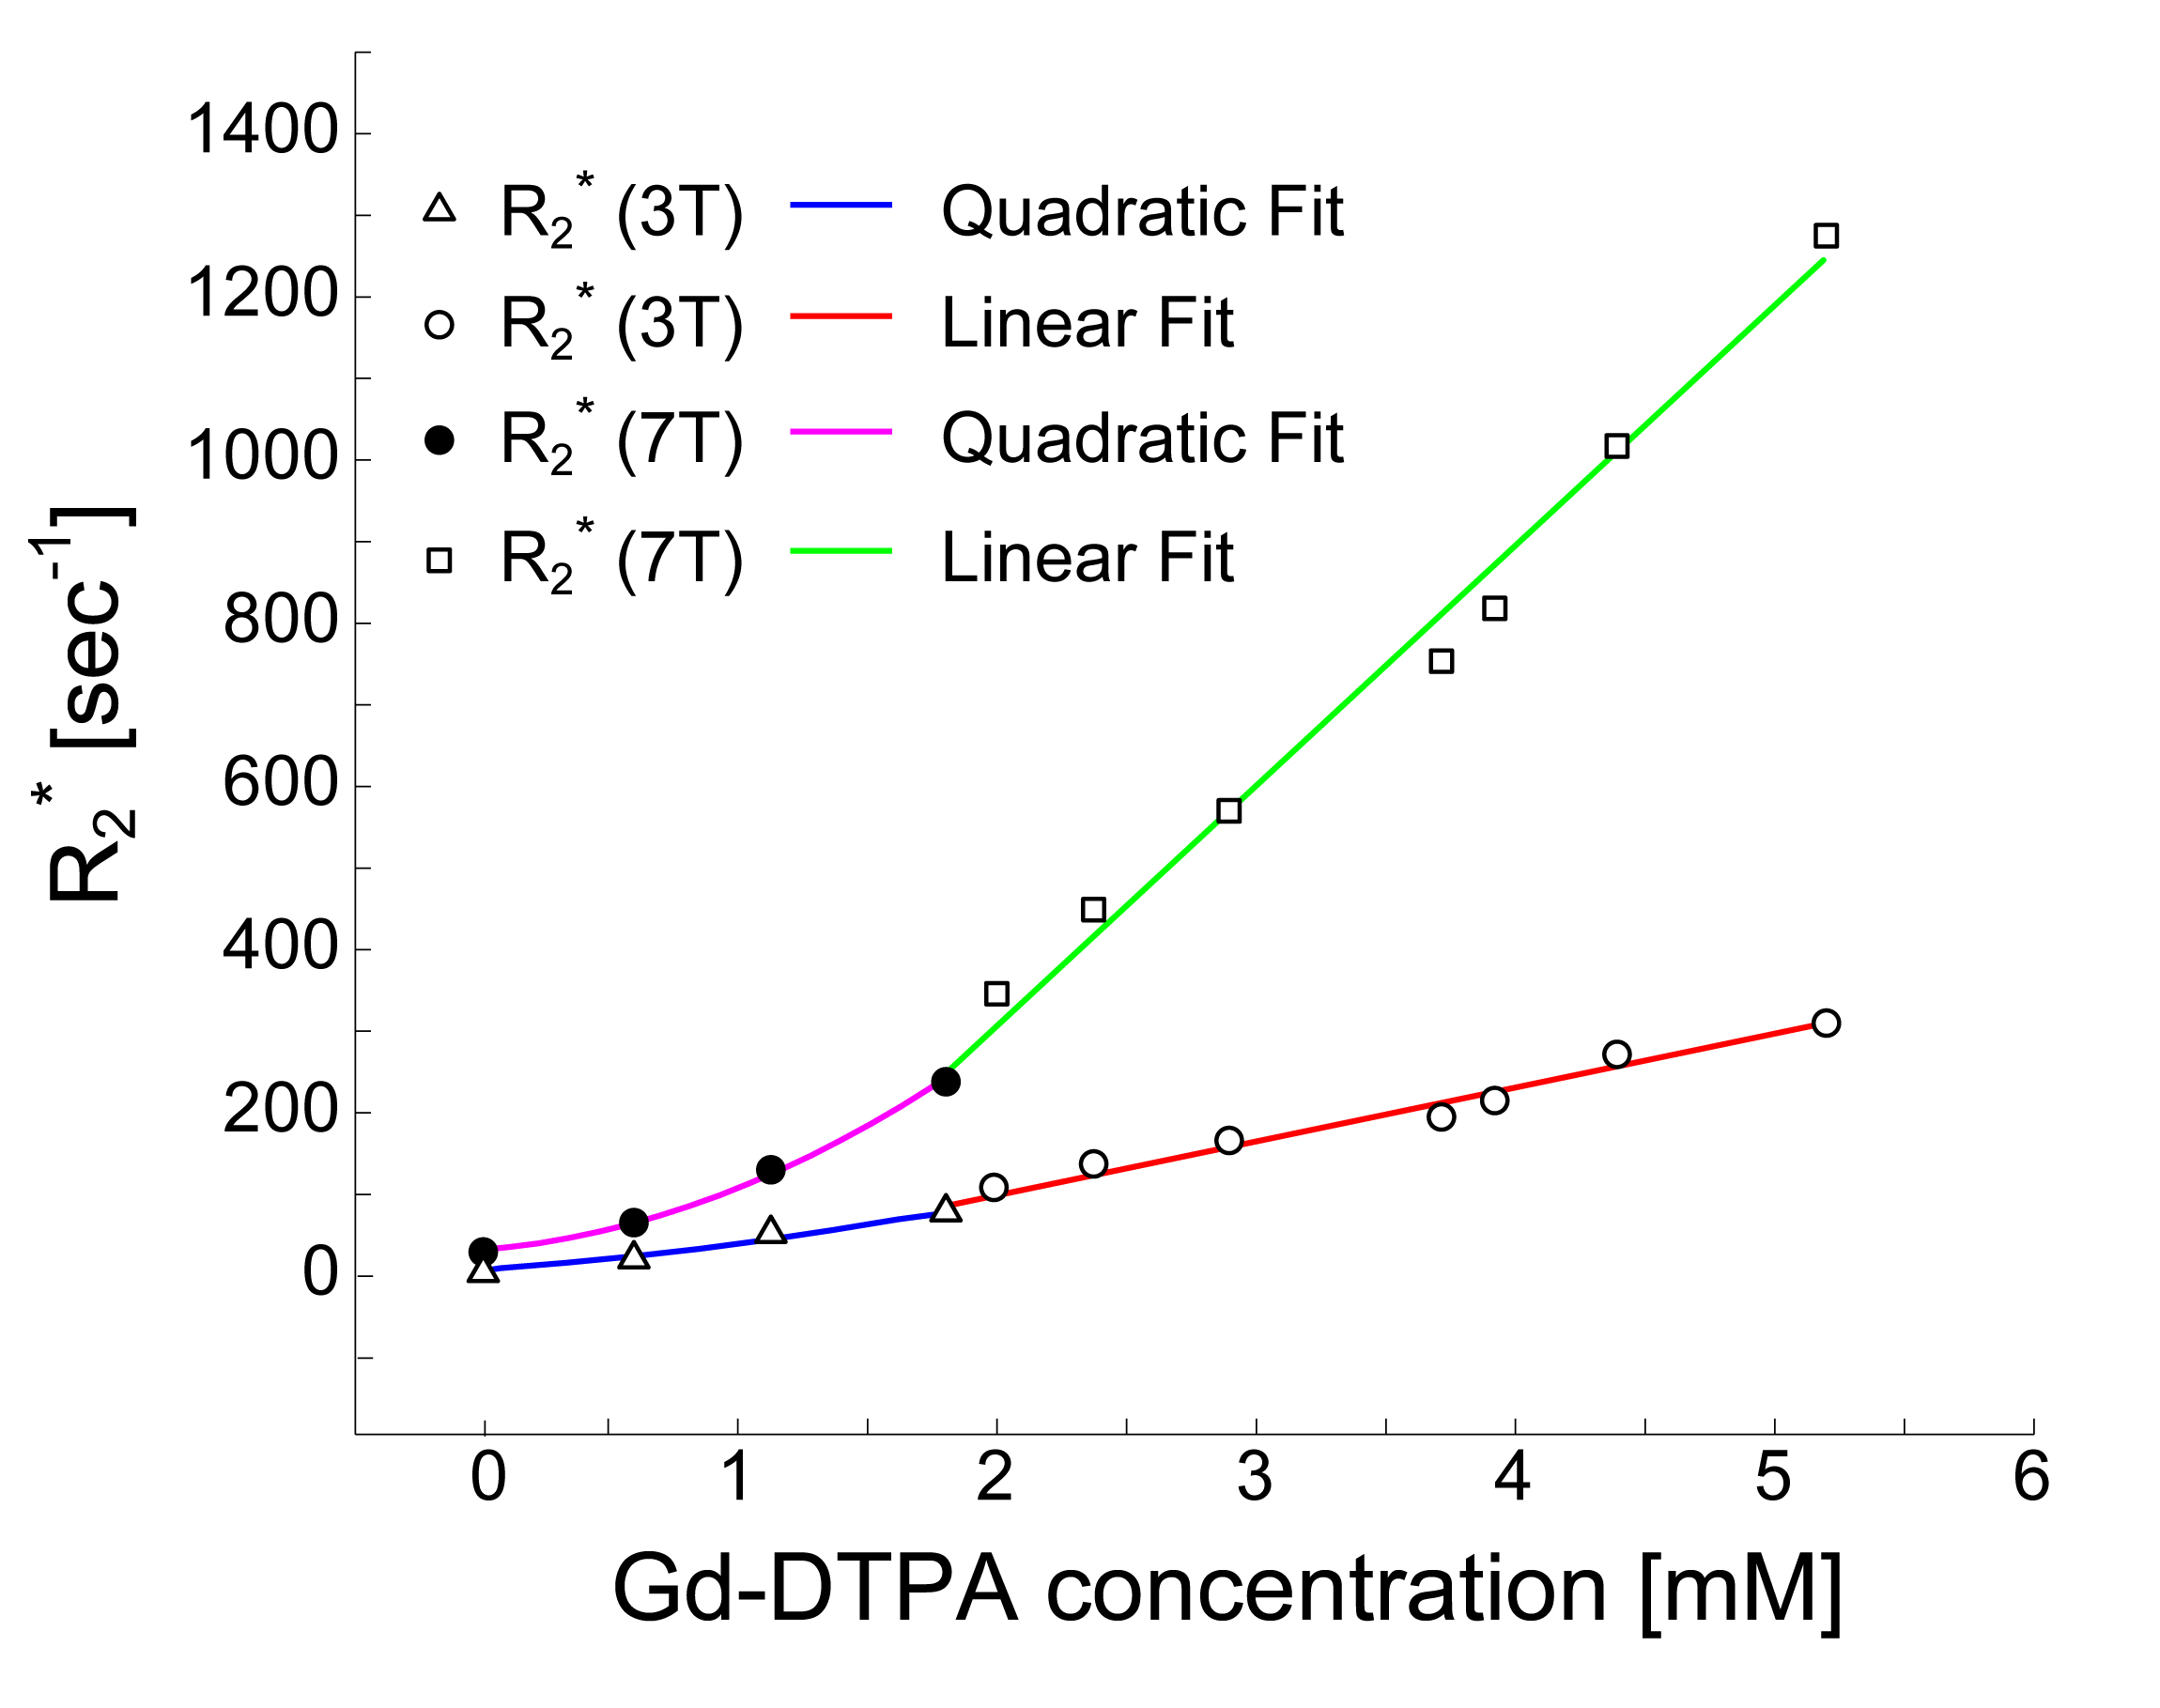
While MR imaging at 7T can provide increased SNR and higher spatial resolution, a drastic increase of R2* (r2*) relaxivity at 7T presents a major challenge in dynamic contrast enhanced (DCE) MRI1. The large R2* impact of the contrast agent competes with the desired T1 based signal enhancement and results in the underestimation of pharmacokinetic parameters2 when using standard gradient echo imaging techniques (Fig.1). In this study, we investigated the feasibility of using an ultrashort echo time (UTE) technique for DCE MRI imaging of prostate cancer patients at 7T to minimize the impact of the increased R2* relaxivity on signal enhancement curves and pharmacokinetic parameter assessment while increasing the resolution compared to 3T.Methods
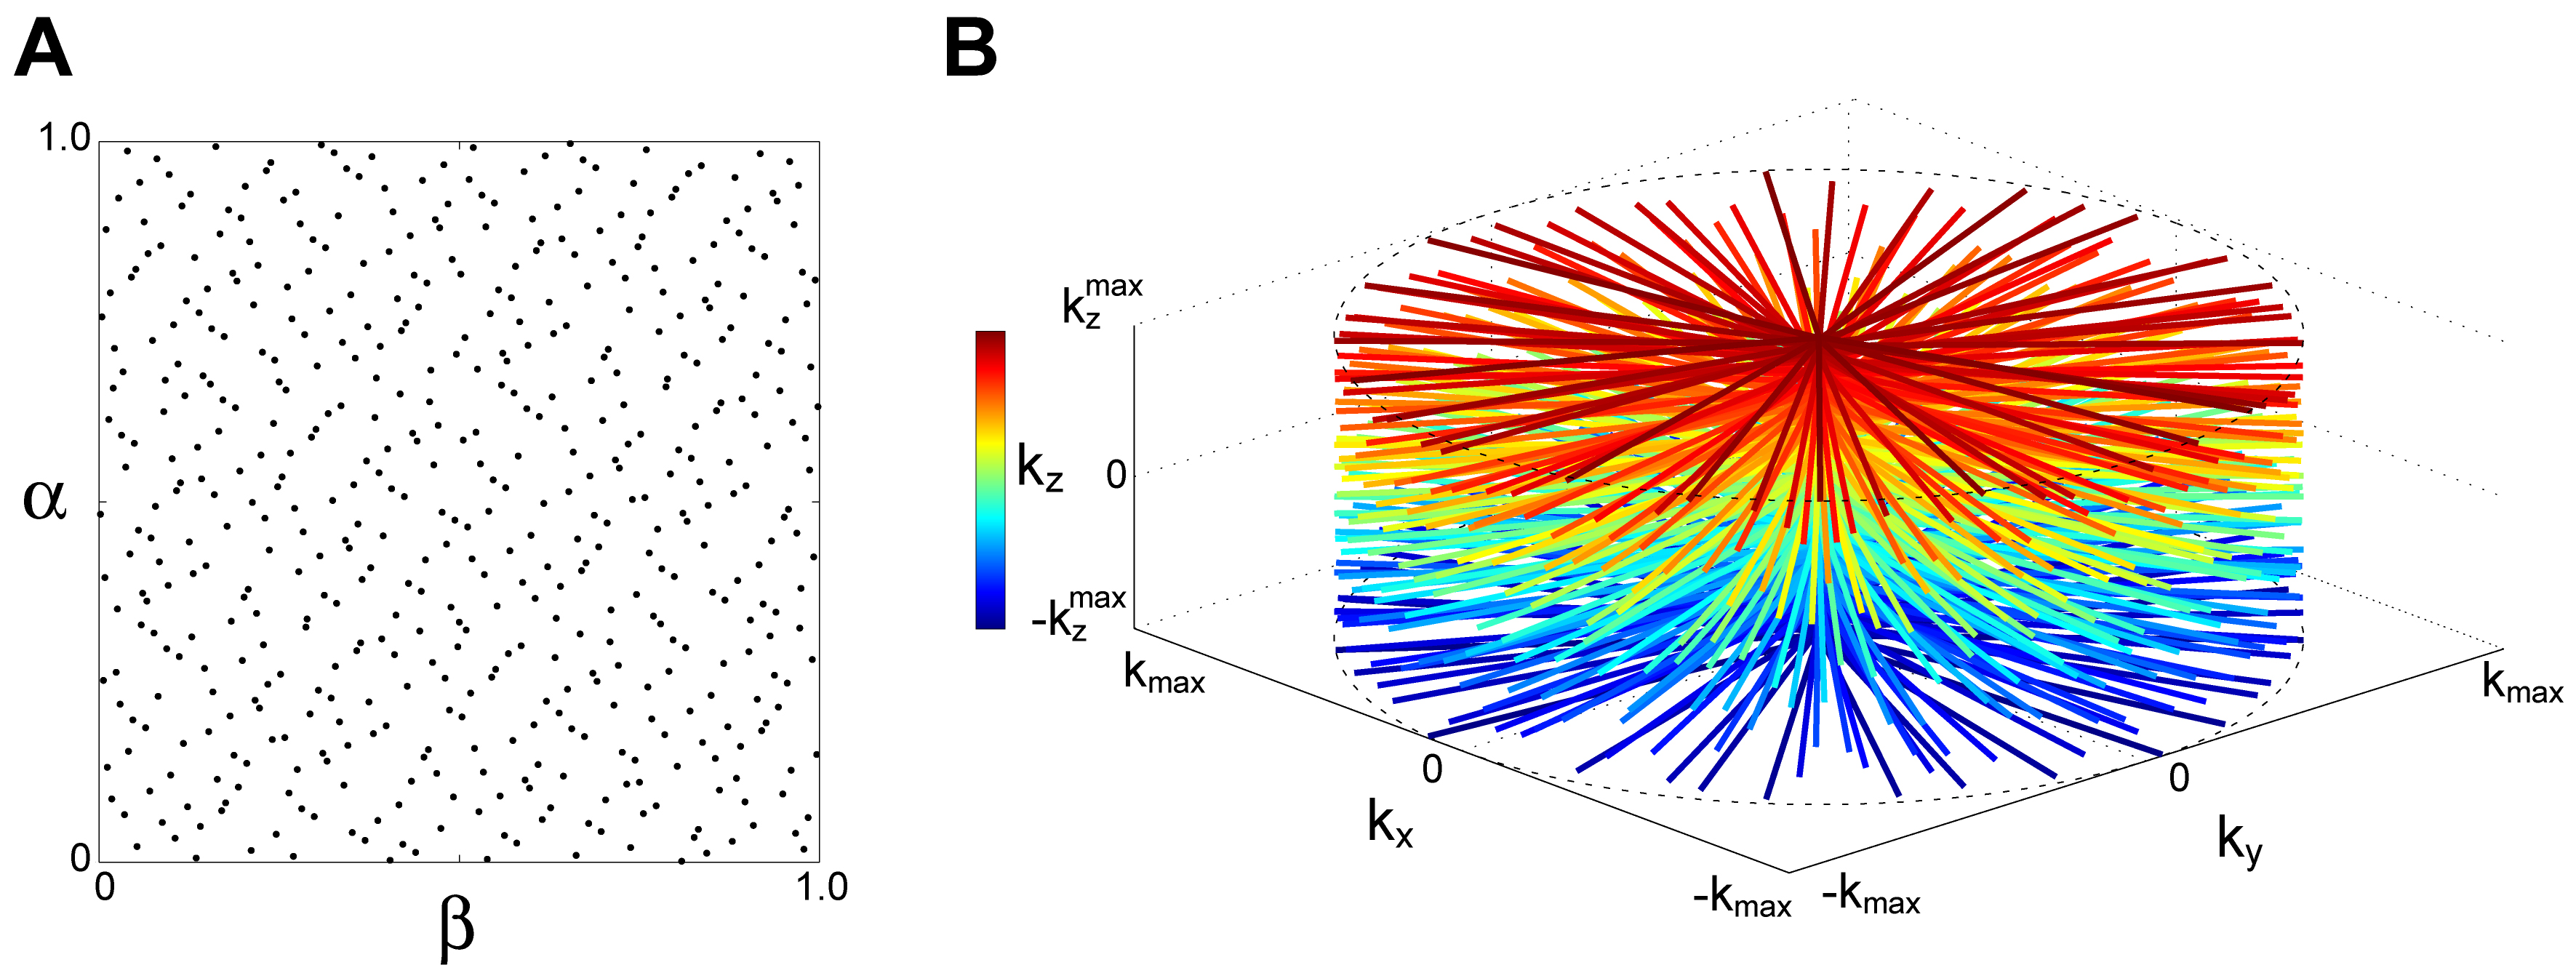
MR imaging of prostate cancer patients (N=8) was conducted on a Siemens 3T Prima and 7T Magnetom systems under an approved IRB approved protocol. Contrast administration consisted of the injection of 0.2 mmol/kg gadobutrol at a rate of 2.0 ml/s followed 60 ml flush of saline at same rate. In UTE DCE MRI acquisitions at 7T, slab selective excitation was performed to cover the entire prostate (9.6 cm thickness along the z direction) using a minimum phase Shinnar-Le Roux pulse3. After excitation, a 2D radial readout with ramp sampling was performed following slab refocusing and phase encoding along the z axis. A 3D cylindrical k-space was sampled in a pseudo-random manner (Fig.2). Sequence parameters for UTE included: TR/TE=2.6/0.45 ms, flip angle=7° and 116,736 acquisitions. For reconstruction, the data were segmented into 57 dynamic frames, each of which consisted of 2,048 acquisitions (i.e, 5.3 sec temporal resolution). The segmented k-space data were reconstructed to a 3D dynamic time series image, I, by iteratively minimizing the following equation: $$$I=\arg\min_{x}\left\{\frac{1}{2}\cdot\mid s-Ex\mid_2^2+\lambda_sTV_s(x)+\lambda_tTV_t(x)\right\}$$$, where s is the acquired k-space data, E is the encoding matrix and TVs,t and λs,t are total variation operators and regularization parameters along spatial and time dimensions, respectively. Since the time course usually shows higher sparsity in DCE-MRI, stronger regularization was applied in this dimension. The reconstructed images had a nominal spatial resolution of 0.83x0.83x3.0 mm. Image reconstruction was performed offline with a routine written with C++/CUDA. With the reconstructed dynamic images, pharmacokinetic parameters were calculated using a general kinetic model (GKM) and a population averaged arterial input function (AIF) yielding standard parameters including Ktrans (forward volume transfer constant). The results from DCE MRI at 7T were compared with clinical DCE MRI studies conducted on the same patients using the following parameters: TR/TE=4.06/1.39 ms, flip angle=10°, four-fold acceleration (2 in the phase encode directions and 2 in the slice encode with CAIPIRAHNIA), 1.1x1.3x4.5 mm spatial resolution and 5.3s temporal resolution.Results
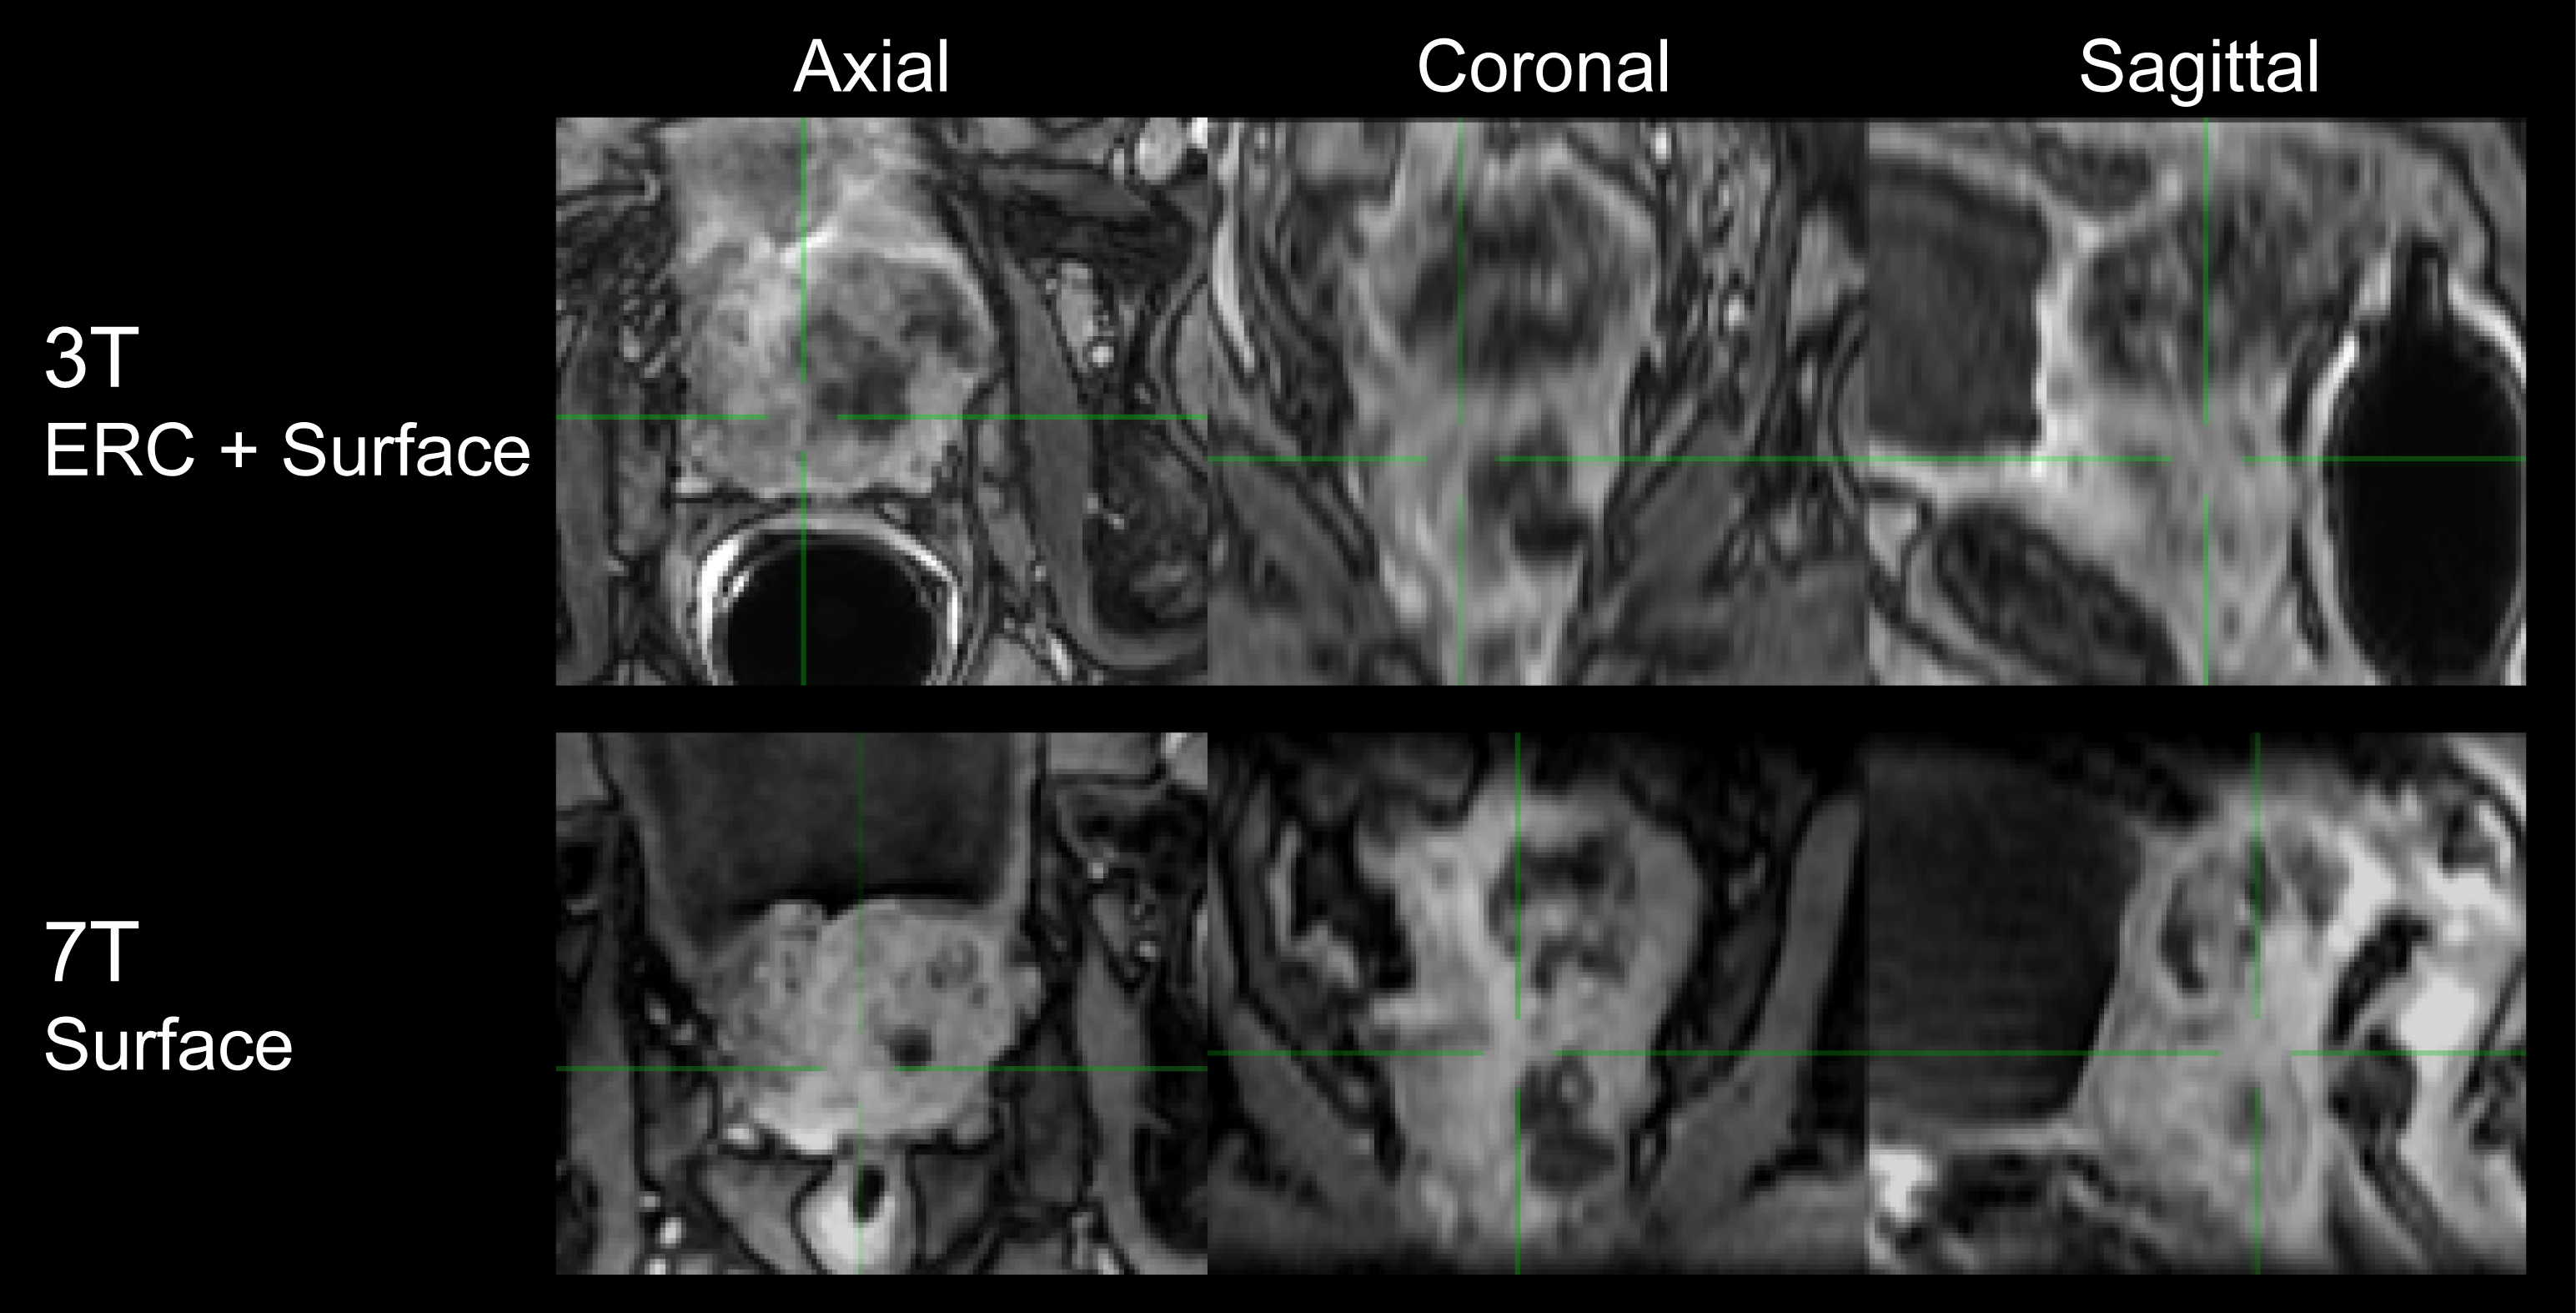
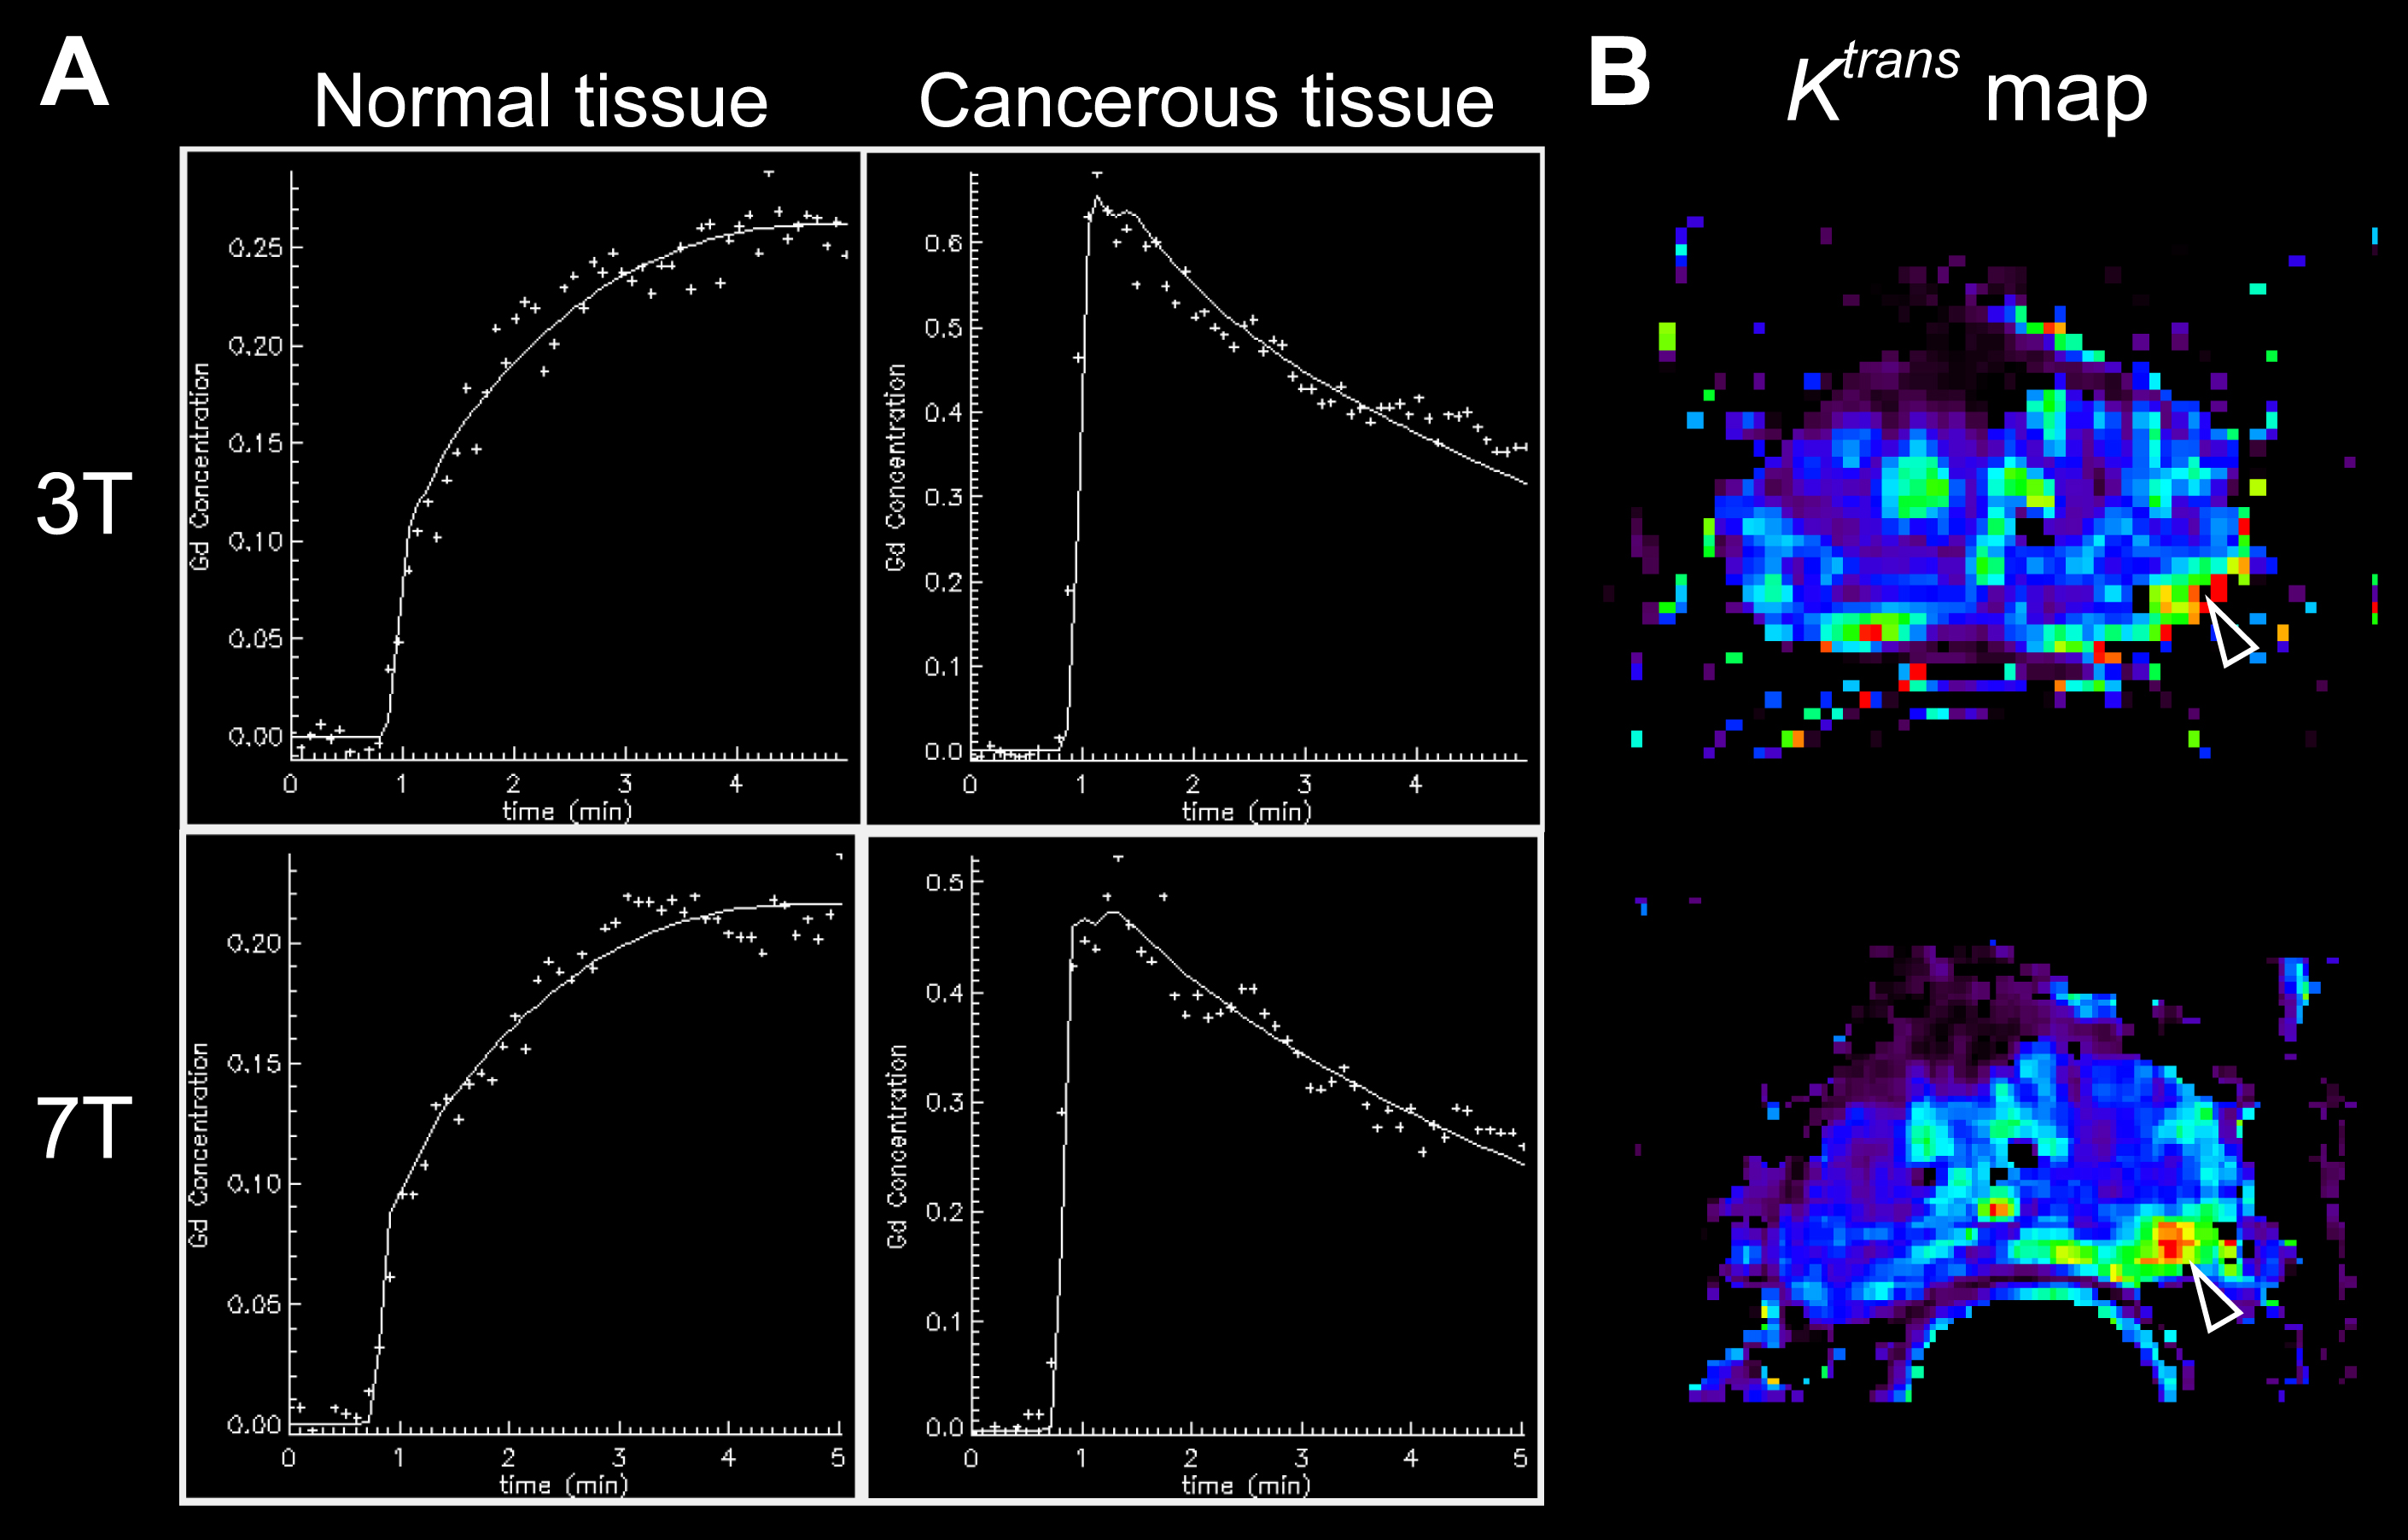
In a patient with extensive disease extending beyond the prostate and under the bladder, the DCE MRI images at 7T clearly visualized the cancer and its involvement with the rectal wall. The UTE images at 7T acquired with a surface array coil have a similar appearance in-plane and readily apparent higher resolution through-plane despite the use of an endorectal coil at 3T (Fig.3). In a second case where endorectal coils were used at both 3T and 7T, the in-plane resolution of the 7T data is apparent and the data yielded similar Gd concentration-time curves at 3T and 7T in both normal and cancerous tissues (Fig.4). In the pharmacokinetic parameter maps from 7T, fast uptake (Ktrans) and wash-out (kep) of contrast agent were more clearly delineated in the left peripheral zone.Discussion
In this study, we employed a combination of 2D radial readout and 1D phase encoding to achieve the short TE (0.45 ms) and anisotropic image resolution. Although the TE is not as short as the standard 3D radial UTE sequence due to phase encoding, the consistent Gd concentration-time curves in the 7T and 3T examinations validated that the TE is reasonably short to suppress the effects from the increased R2* in tissue. However, it would not be sufficiently short for AIF measurement. A further reduced TE with 3D radial readout and ellipsoid (anisotropic) k-space sampling may be one solution to measure AIF accurately. As previously demonstrated, an alternative strategy to avoid the increased R2* effects is to acquire multiple echoes and to correct the T2* signal decay effects but at the expense of temporal resolution2.Conclusions
The proposed method achieved DCE MRI at 7T comparable to clinical DCE MRI in terms of the signal time course while taking advantage of the increased SNR for improved spatial resolution and avoiding R2* effects which are exacerbated with increasing field.Acknowledgements
This study was supported by NIH grants P41EB015894 and R01CA155268.References
1. Kalavagunta C, Michaeli S, Metzger GJ. In vitro Gd-DTPA relaxometry studies in oxygenated venous human blood and aqueous solution at 3 and 7 T. Contrast media & molecular imaging 2014;9(2):169-176.
2. Metzger GJ, Bolan P. Influence of contrast-dependent T2* effects on DCE-MRI of the prostate at 7T. Proc Intl Soc Mag Reson Med 2009;17:#5920.
3. Pauly J, Le Roux P, Nishimura D, Macovski A. Parameter relations for the Shinnar-Le Roux selective excitation pulse design algorithm [NMR imaging]. IEEE transactions on medical imaging 1991;10(1):53-65.
Figures