0497
Quantitative assessment of exercise-stimulated muscle perfusion: a comparison between DCE and DSC imaging1Radiology and Imaging Sciences, University of Utah, Salt Lake City, UT, United States, 2Division of Geriatrics, University of Utah, Salt Lake City, UT, United States, 3Epidemiology, University of Utah, Salt Lake City, UT, United States, 4Cardiovascular Medicine, University of Utah, Salt Lake City, UT, United States, 5Vascular Surgery, University of Utah, Salt Lake City, UT, United States
Synopsis
For one group of healthy subjects, we measured exercise-stimulated perfusion in calf muscles using both DCE and DSC MRI, and found that the muscle perfusion estimates by the two methods were comparable, but the vascular-fraction estimates were not. Without confounding contribution from extravascular signals, DSC data has the potential of characterizing tissue vasculature more precisely. Acquisition of both DCE and DSC data in one exam can be achieved with either two injections of low contrast dose or acquisition techniques of interleaved T1 and T2* imaging.
Introduction
One most established capability of MRI is noninvasive quantification of tissue perfusion by contrast-enhanced MRI. The technique has been widely adopted in assessing organ function1-3, and in monitoring tumor treatment4-6. Depending on the imaging sequence used, the acquired signals can be from solely vascular space or both vascular and extra-vascular spaces. For example, T1-weighted sequence used in DCE imaging is sensitive to T1-shortening effect of gadolinium contrast that is distributed by diffusing protons in both intra- and extra-vascular compartments7; T2*-based DSC imaging is based on magnetic susceptibility effect of the blood vessels filled with gadolinium contrast molecules8. While the former provides both perfusion and permeability status of the tissue, the latter could potentially estimate vascular parameters with higher accuracy by avoiding confounding contribution from extravascular signals. In this study, we performed both DCE and DSC acquisitions for calf muscles of a group of human subjects. By the study we aim to compare the performance of the methods, and to test the feasibility of acquiring both data in one exam.Methods
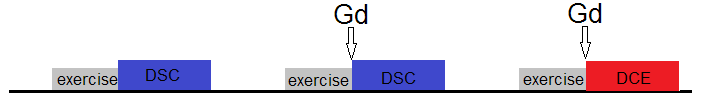
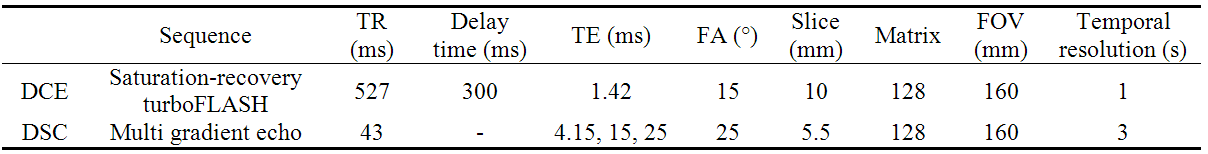
This IRB approved experiment recruited 9 healthy subjects (4 male, 22-43 years). For each subject, one calf was scanned with a 4-channel flex coil in a 3T MRI scanner (TimTrio; Siemens). To enhance muscle perfusion, the subject performed plantar flexion immediately prior to scan. The plantar flexion with 8-lb load was done at rate of 1 Hz for 3 minutes. Each exam (Figure 1) included two DSC scans (without and with contrast injection) and one DCE scan. The non-Gd DSC was to correct for dHb-induced R2* changes. Each contrast injection used 0.05 mmol/kg gadoteridol injected at the end of the exercise. Table 1 shows the sequence parameter values. For two subjects, the procedure was repeated on two separate days.
To process DCE data, signals of medial and lateral gastrocnemius (MG, LG) and soleus (SL) were converted to contrast concentration [Gad]. Arterial input function (AIF) was sampled from tibial or peroneal artery. For each muscle, the contrast enhancement curve was de-convolved with the AIF using a curve-fitting approach based on the adiabatic tissue homogeneity (ATH) model9. By this deconvolution, four parameters were estimated: perfusion (F), vascular fraction (Va), extraction fraction (E), and an exchange rate (ke). From the DSC data, we obtained contrast-induced temporal course of R2* for MG, LG and SL. In the initial uptake period, contrast agent is in the vascular compartment only, so contrast enhancement should be the same for DCE and DSC scans. Based on this assumption, we converted R2* curve of each muscle to [Gad] curve. To further quantify the [Gad] curve, we used the same method as for the DCE data, except that we did not use the ATH model but a vascular-only function that included first a plateau then an exponential decay. From this curve fitting, we obtained perfusion (F) and vascular fraction (Va). To compare a parameter (F or Va) estimated by DCE and DSC, we computed percentage difference between two estimates, computed as the ratio of difference over average of the two estimates. The percentage difference was then averaged across all 33 data points (11 scans and 3 muscles). The parameter estimates were also compared using correlation plots.
Results
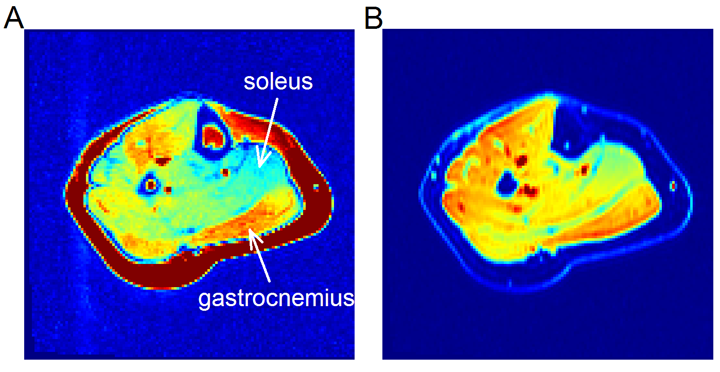
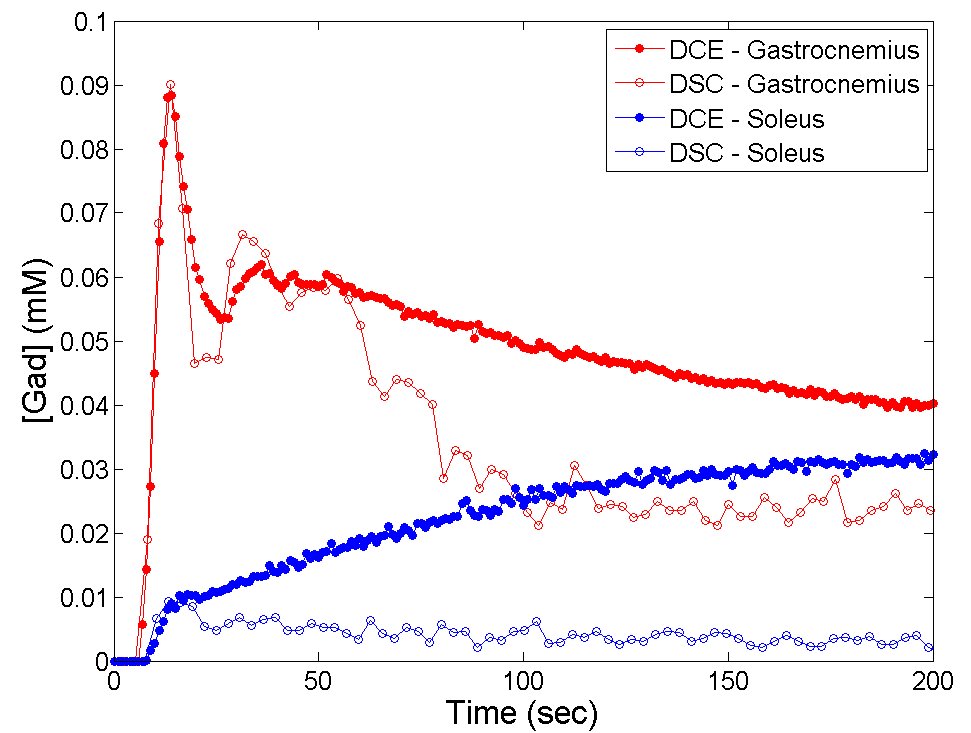
Figure 2 shows examples of contrast-enhanced images from DCE and DSC, and Figure 3 examples of contrast enhancement in different muscles. Due to the signal contribution from extravascular space, the DCE-measured curves were consistently higher than the DSC curves in their late segments.
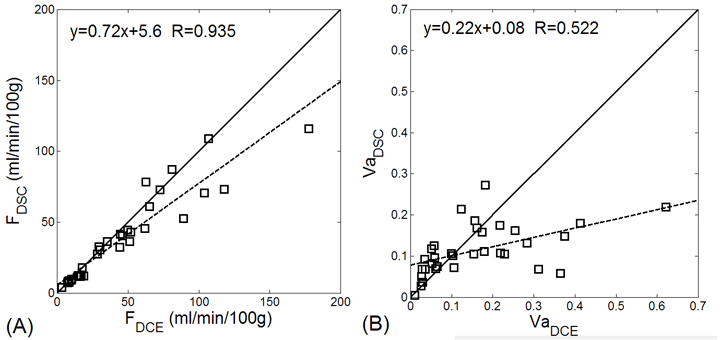
The muscle perfusion estimates from DCE and from DSC method were comparable, with percentage difference of -12.4%±19.9% and correlation coefficient of 0.935. Figure 4A shows the correlation plot for the perfusion estimates. For vascular fraction, the percentage difference between the DCE and DSC estimates was -9.6%±64.4%, and correlation coefficient 0.522 (Figure 4B). The low agreement was mostly due to a few cases where the DCE estimates were much higher (0.2~0.6 vs. 0.1~0.2).
Discussion and conclusion
By applying both DCE and DSC imaging to a same group of human subjects, we found that the two methods provided comparable perfusion estimates for exercise-stimulated calf muscles. Sensitive to only intravascular signals, DSC imaging measures vascular mean transit time or vascular fraction with more confidence. In contrast, with DCE the mixture of vascular and extravascular signals in the same data could make it challenging to precisely estimate vascular fraction. For high-perfusion organs where low contrast dosage is adequate, one can perform two injections in one exam, or use advanced MRI techniques to perform dynamic T1 and T2* imaging in an interleaved manner10-12.Acknowledgements
No acknowledgement found.References
1. Schalkx HJ, van Stralen M, Coenegrachts K, et al. Liver perfusion in dynamic contrast-enhanced magnetic resonance imaging (DCE-MRI): comparison of enhancement in Gd-BT-DO3A and Gd-EOB-DTPA in normal liver parenchyma. Eur Radiol 2014; 24: 2146-2156.
2. Marx C, Konig M, Luck R, et al. [Perfusion parameters in MRI diagnosis of pancreas transplants]. Rofo 2000; 172: 38-42.
3. Lee VS, Rusinek H, Bokacheva L, et al. Renal function measurements from MR renography and a simplified multicompartmental model. American journal of physiology 2007; 292: F1548-1559.
4. Ludemann L, Warmuth C, Plotkin M, et al. Brain tumor perfusion: comparison of dynamic contrast enhanced magnetic resonance imaging using T1, T2, and T2* contrast, pulsed arterial spin labeling, and H2(15)O positron emission tomography. European journal of radiology 2009; 70: 465-474.
5. Yankeelov TE, Niermann KJ, Huamani J, et al. Correlation between estimates of tumor perfusion from microbubble contrast-enhanced sonography and dynamic contrast-enhanced magnetic resonance imaging. J Ultrasound Med 2006; 25: 487-497.
6. Collins DJ, Padhani AR. Dynamic magnetic resonance imaging of tumor perfusion. Approaches and biomedical challenges. IEEE engineering in medicine and biology magazine : the quarterly magazine of the Engineering in Medicine & Biology Society 2004; 23: 65-83.
7. Kershaw LE, Buckley DL. Precision in measurements of perfusion and microvascular permeability with T1-weighted dynamic contrast-enhanced MRI. Magn Reson Med 2006; 56: 986-992.
8. Speck O, Chang L, DeSilva NM, et al. Perfusion MRI of the human brain with dynamic susceptibility contrast: gradient-echo versus spin-echo techniques. J Magn Reson Imaging 2000; 12: 381-387.
9. St Lawrence KS, Lee TY. An adiabatic approximation to the tissue homogeneity model for water exchange in the brain: II. Experimental validation. J Cereb Blood Flow Metab 1998; 18: 1378-1385. 10. Stokes AM, Semmineh N, Quarles CC. Validation of a T1 and T2* leakage correction method based on multiecho dynamic susceptibility contrast MRI using MION as a reference standard. Magn Reson Med 2016; 76: 613-625.
11. Heilmann M, Walczak C, Vautier J, et al. Simultaneous dynamic T1 and T2* measurement for AIF assessment combined with DCE MRI in a mouse tumor model. Magma 2007; 20: 193-203.
12. de Bazelaire C, Rofsky NM, Duhamel G, et al. Combined T2* and T1 measurements for improved perfusion and permeability studies in high field using dynamic contrast enhancement. Eur Radiol 2006; 16: 2083-2091.
Figures