0494
Comparison of Cerebral Blood Volume Estimates using Quantitative Susceptibility Mapping, and R2* relaxometry1Department of Medical Physics, University of Wisconsin-Madison, Madison, WI, United States, 2Department of Radiology, University of Wisconsin-Madison, Madison, WI, United States, 3Department of Radiology, Basel University Hospital, Basel, Switzerland
Synopsis
Intracranial vascularity is modified in a wide array of diseases, including various forms of dementia, cancer, and stroke. When assessment of the vascular architecture is needed, one potential approach is steady state imaging with ferumoxytol to estimate cerebral blood volume (CBV). Building upon recent work, in this study we investigate the correlation between QSM and R2* based CBV estimates. Results from 19 healthy volunteers show that the QSM based CBV estimates demonstrated a high degree of correlation in gray and white matter, but larger variance than R2* based measures.
INTRODUCTION:
Increasing evidence exists indicating pathologic alterations of the cerebral vasculature in Alzheimer’s disease (AD).1 In chronic neurodegenerative diseases such as AD, characterized by the loss of neurons in the cerebral cortex, disease may be diffuse such that drawing reference regions of interest to estimate relative cerebral blood volume (CBV) is not practical. Absolute CBV quantification may enable the identification of global and regional pathologic CBV with higher reproducibility. However, blood volume concentration is highly challenging to relate to MRI signal characteristics such as the observed R1 or R2*, which are sensitive to factors such as water exchange, compartmentalization, flow, and vascular architecture. Quantitative Susceptibility Mapping is an independent technique which, in principle, can be used to obtain images of local tissue magnetic susceptibility, and hence estimate changes after administration of a contrast agent. While QSM has been demonstrated for DSC-MRI2, it is based on an ill-posed deconvolution procedure, and thus may be sensitive to the image quality achievable with dynamic imaging. In this work, we explore the use of QSM for CBV estimation using ferumoxytol enhanced MRI and compare to R2* based results.METHODS:
This is a retrospective re-analysis of data previously acquired for comparison of R2* and T1 based measures.3 Subjects: 19 healthy subjects (age range 20-61y, mean=32y, 10F). MRI: 3.0T scanner (MR750, GE Healthcare Waukesha, WI, USA) with a 32ch brain coil (Nova Medical, Wilmington, MA, USA). For all patients, scanning was performed before and after the administration of two doses of ferumoxytol (AMAG Pharmaceuticals, Inc., Cambridge, MA). Ferumoxytol was diluted to 60 ml and injected as a slow infusion. Images were acquired at 3 time points: pre-contrast, after a first injection (1mg/kg) and a second injection (4mg/kg), for a total ferumoxytol dose of 5mg/kg. 3D multi-echo, gradient echo images were acquired with: TR= 32.5 ms, 8 echo times ranging from 2.2ms to 29.8ms, flip angle = 15 degrees, 1mm isotropic resolution, and FOV=256x180x240 mm3.
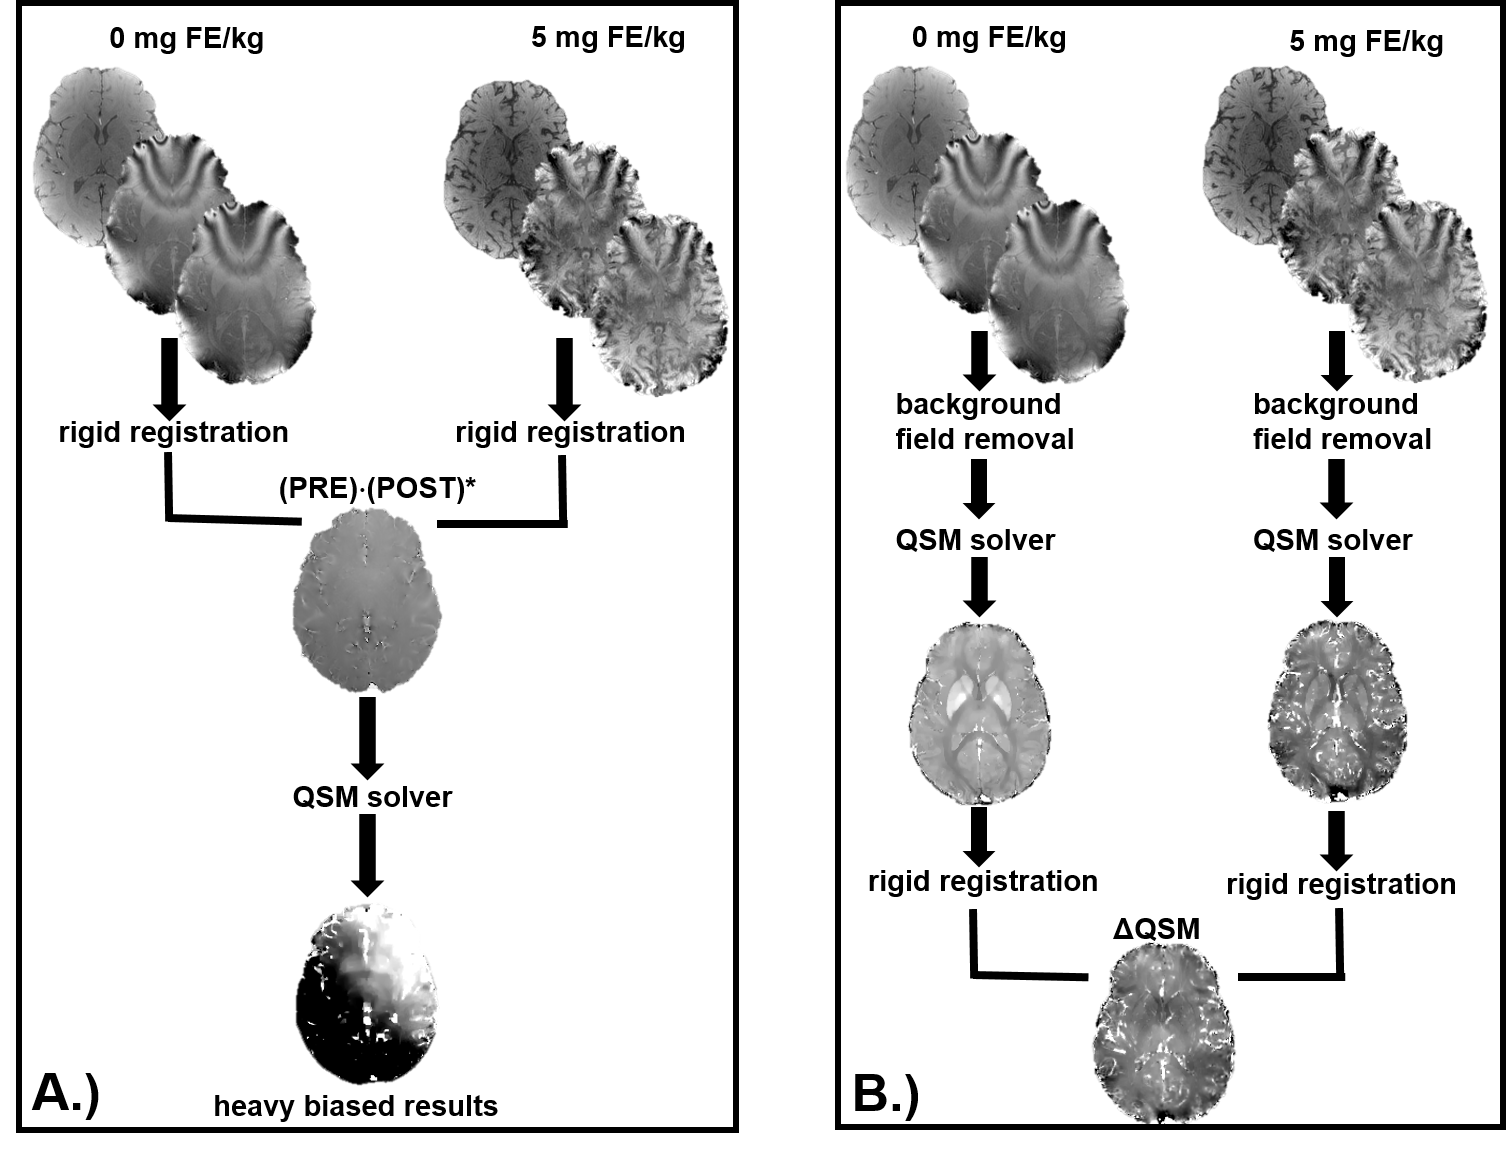
R2* images were generated from complex fitting the multi-echo images. For each subject, partial volume masks (PVMs) of gray matter (GM) and white matter (WM) were generated as previously described.3 QSM images were generated after exploring different approaches (figure 1). Background field removal was performed using a projection onto dipole fields approach4, and the magnetic susceptibility of tissue was determined using morphology enable dipole inversion (MEDI)5. QSM images pre- and post-contrast were co-registered using a rigid body registration utilizing the source images, and then subtracted to obtain ΔQSM. Pixel wise changes were cumulated from the registered images into a 2D histogram of measures. This data was projected for along the Δχ and ΔR2* values at the 5mg FE/kg dose. The change in magnetic susceptibility (Δχ) in blood estimated in previous work3 using Nadler equation and R1 measurements were used. In addition, Δχ in blood was estimated from QSM images from observations in ROI’s in the superior sagittal sinus.
RESULTS:
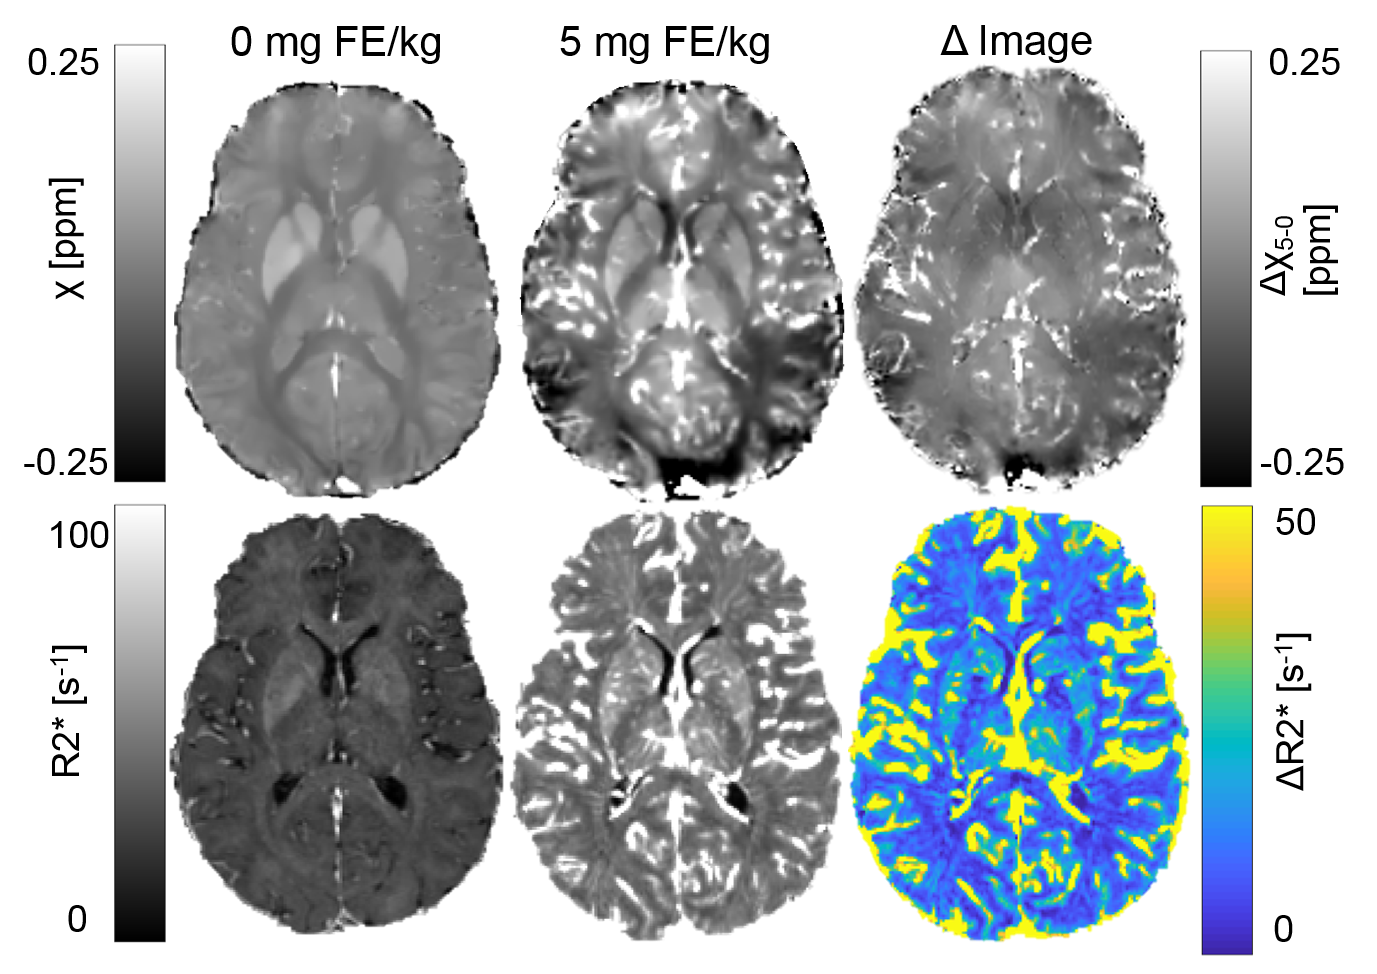
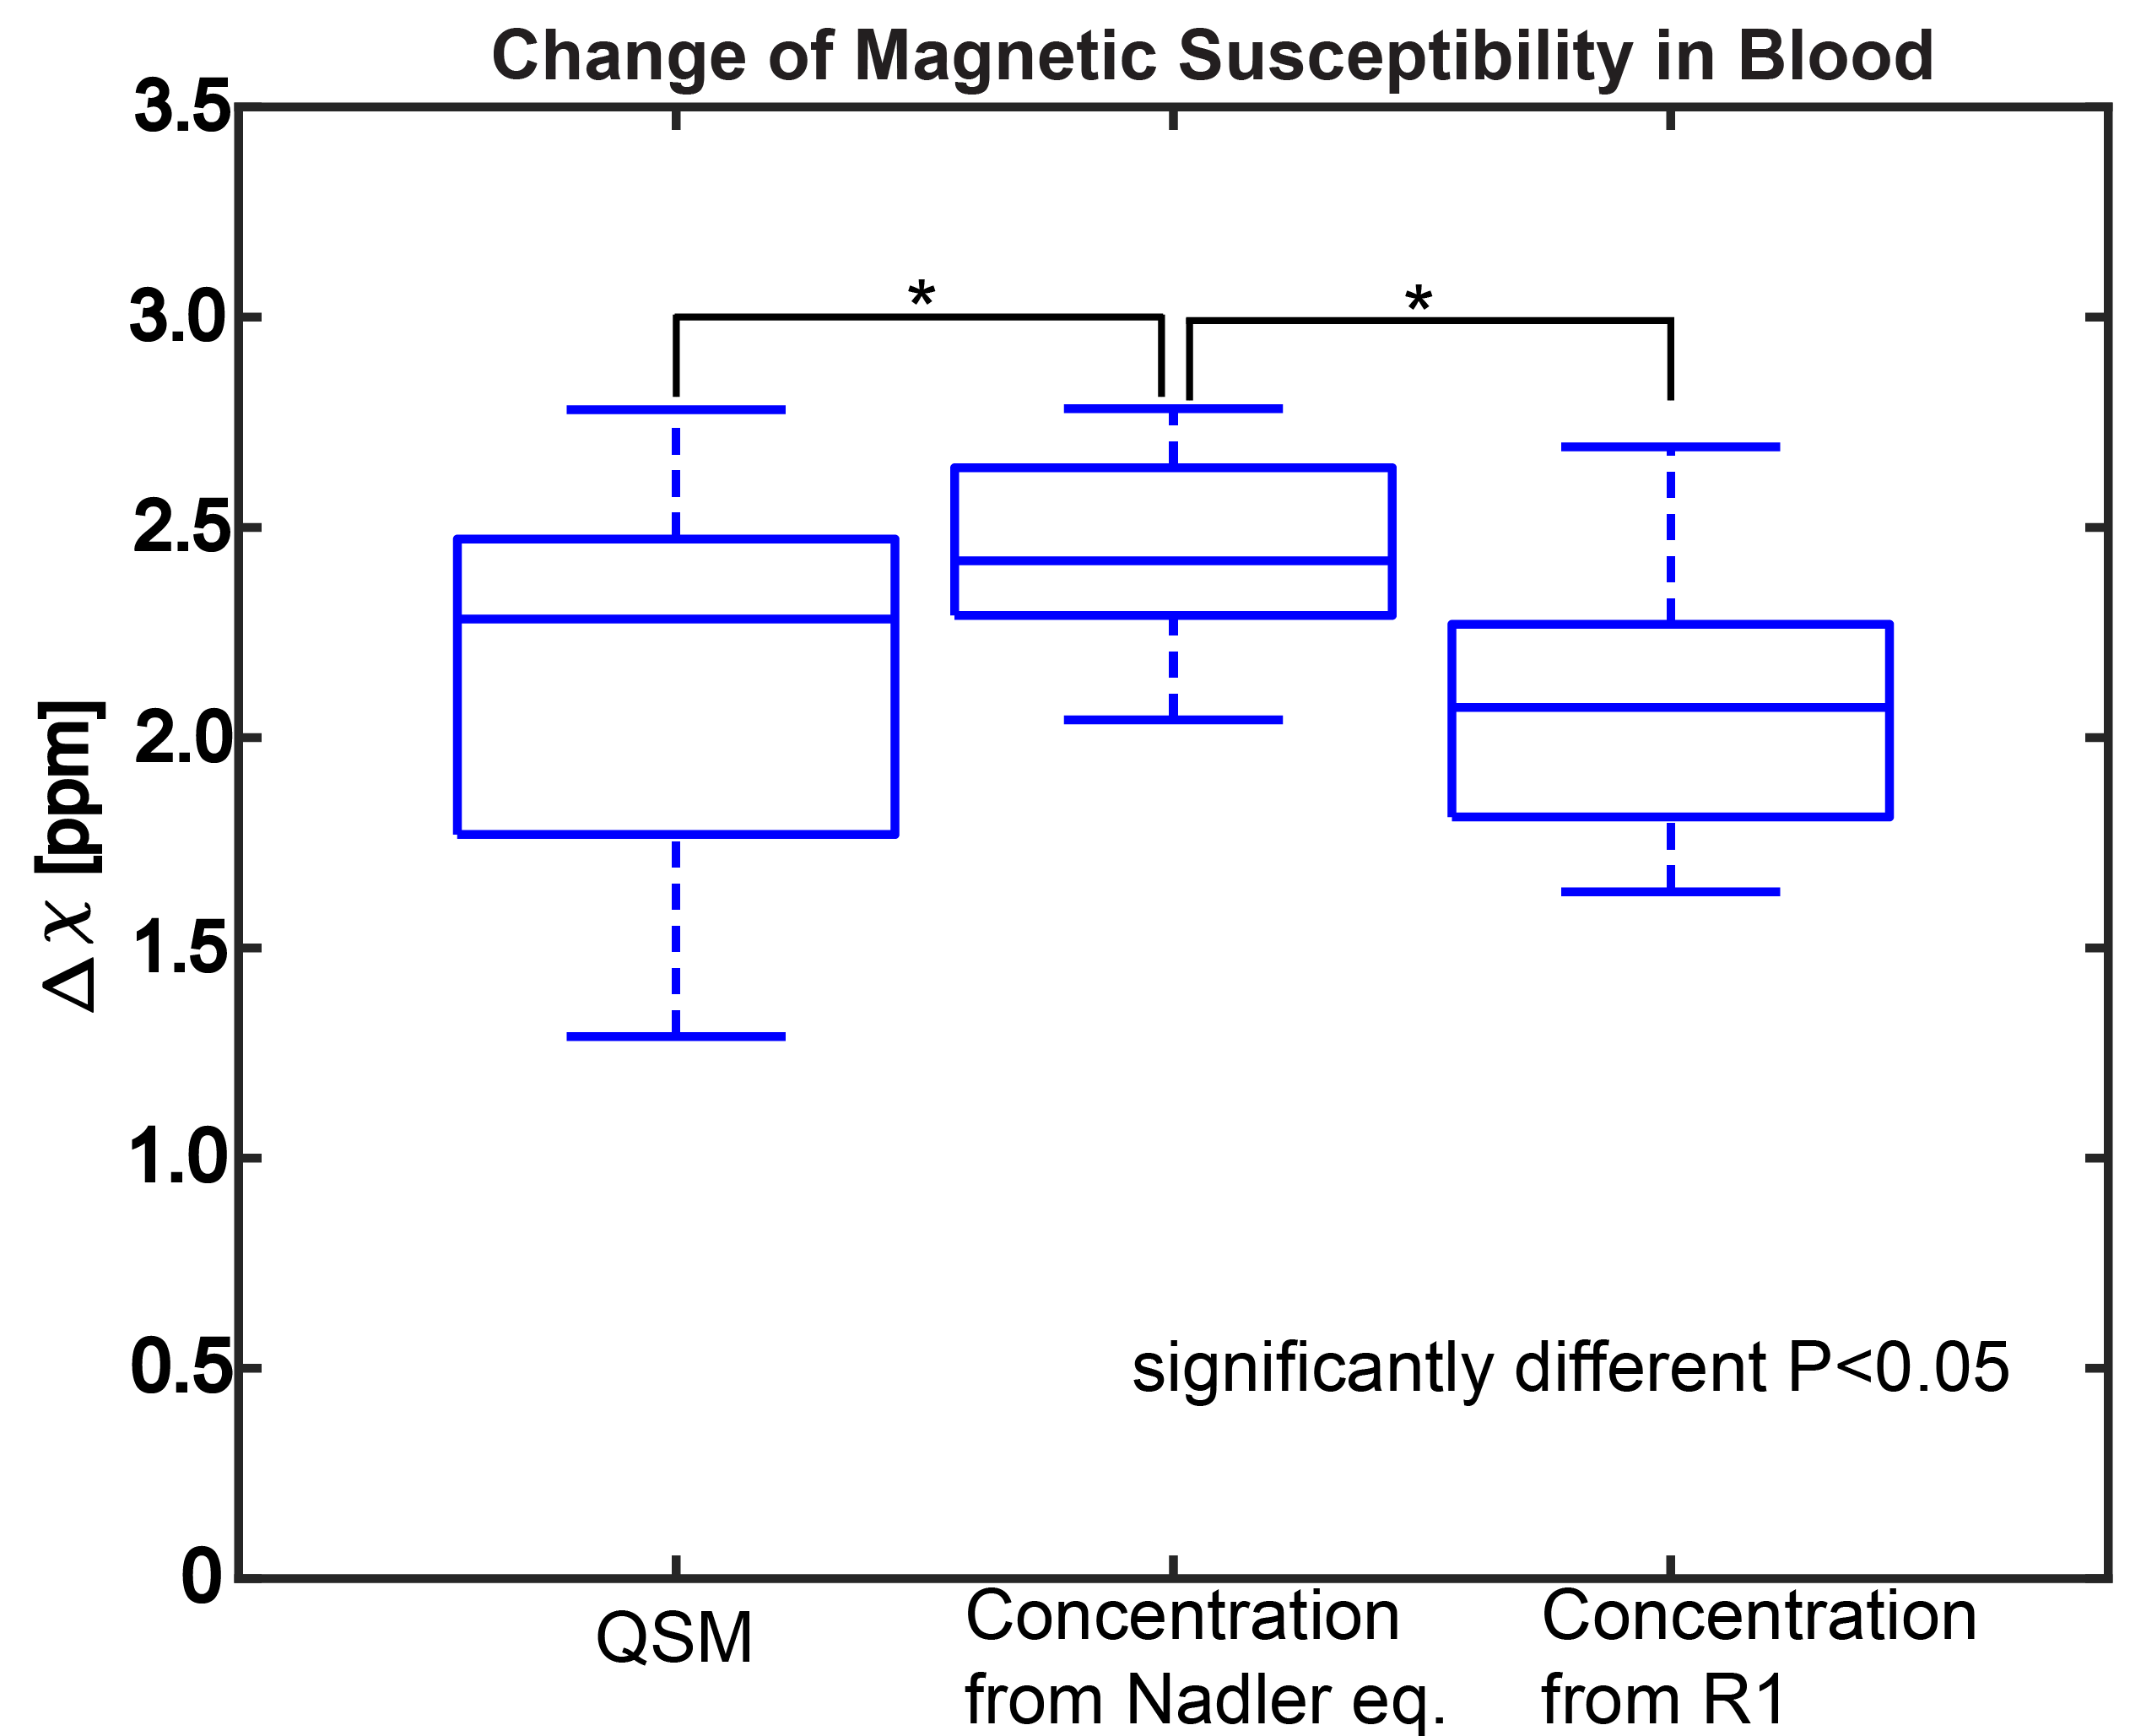
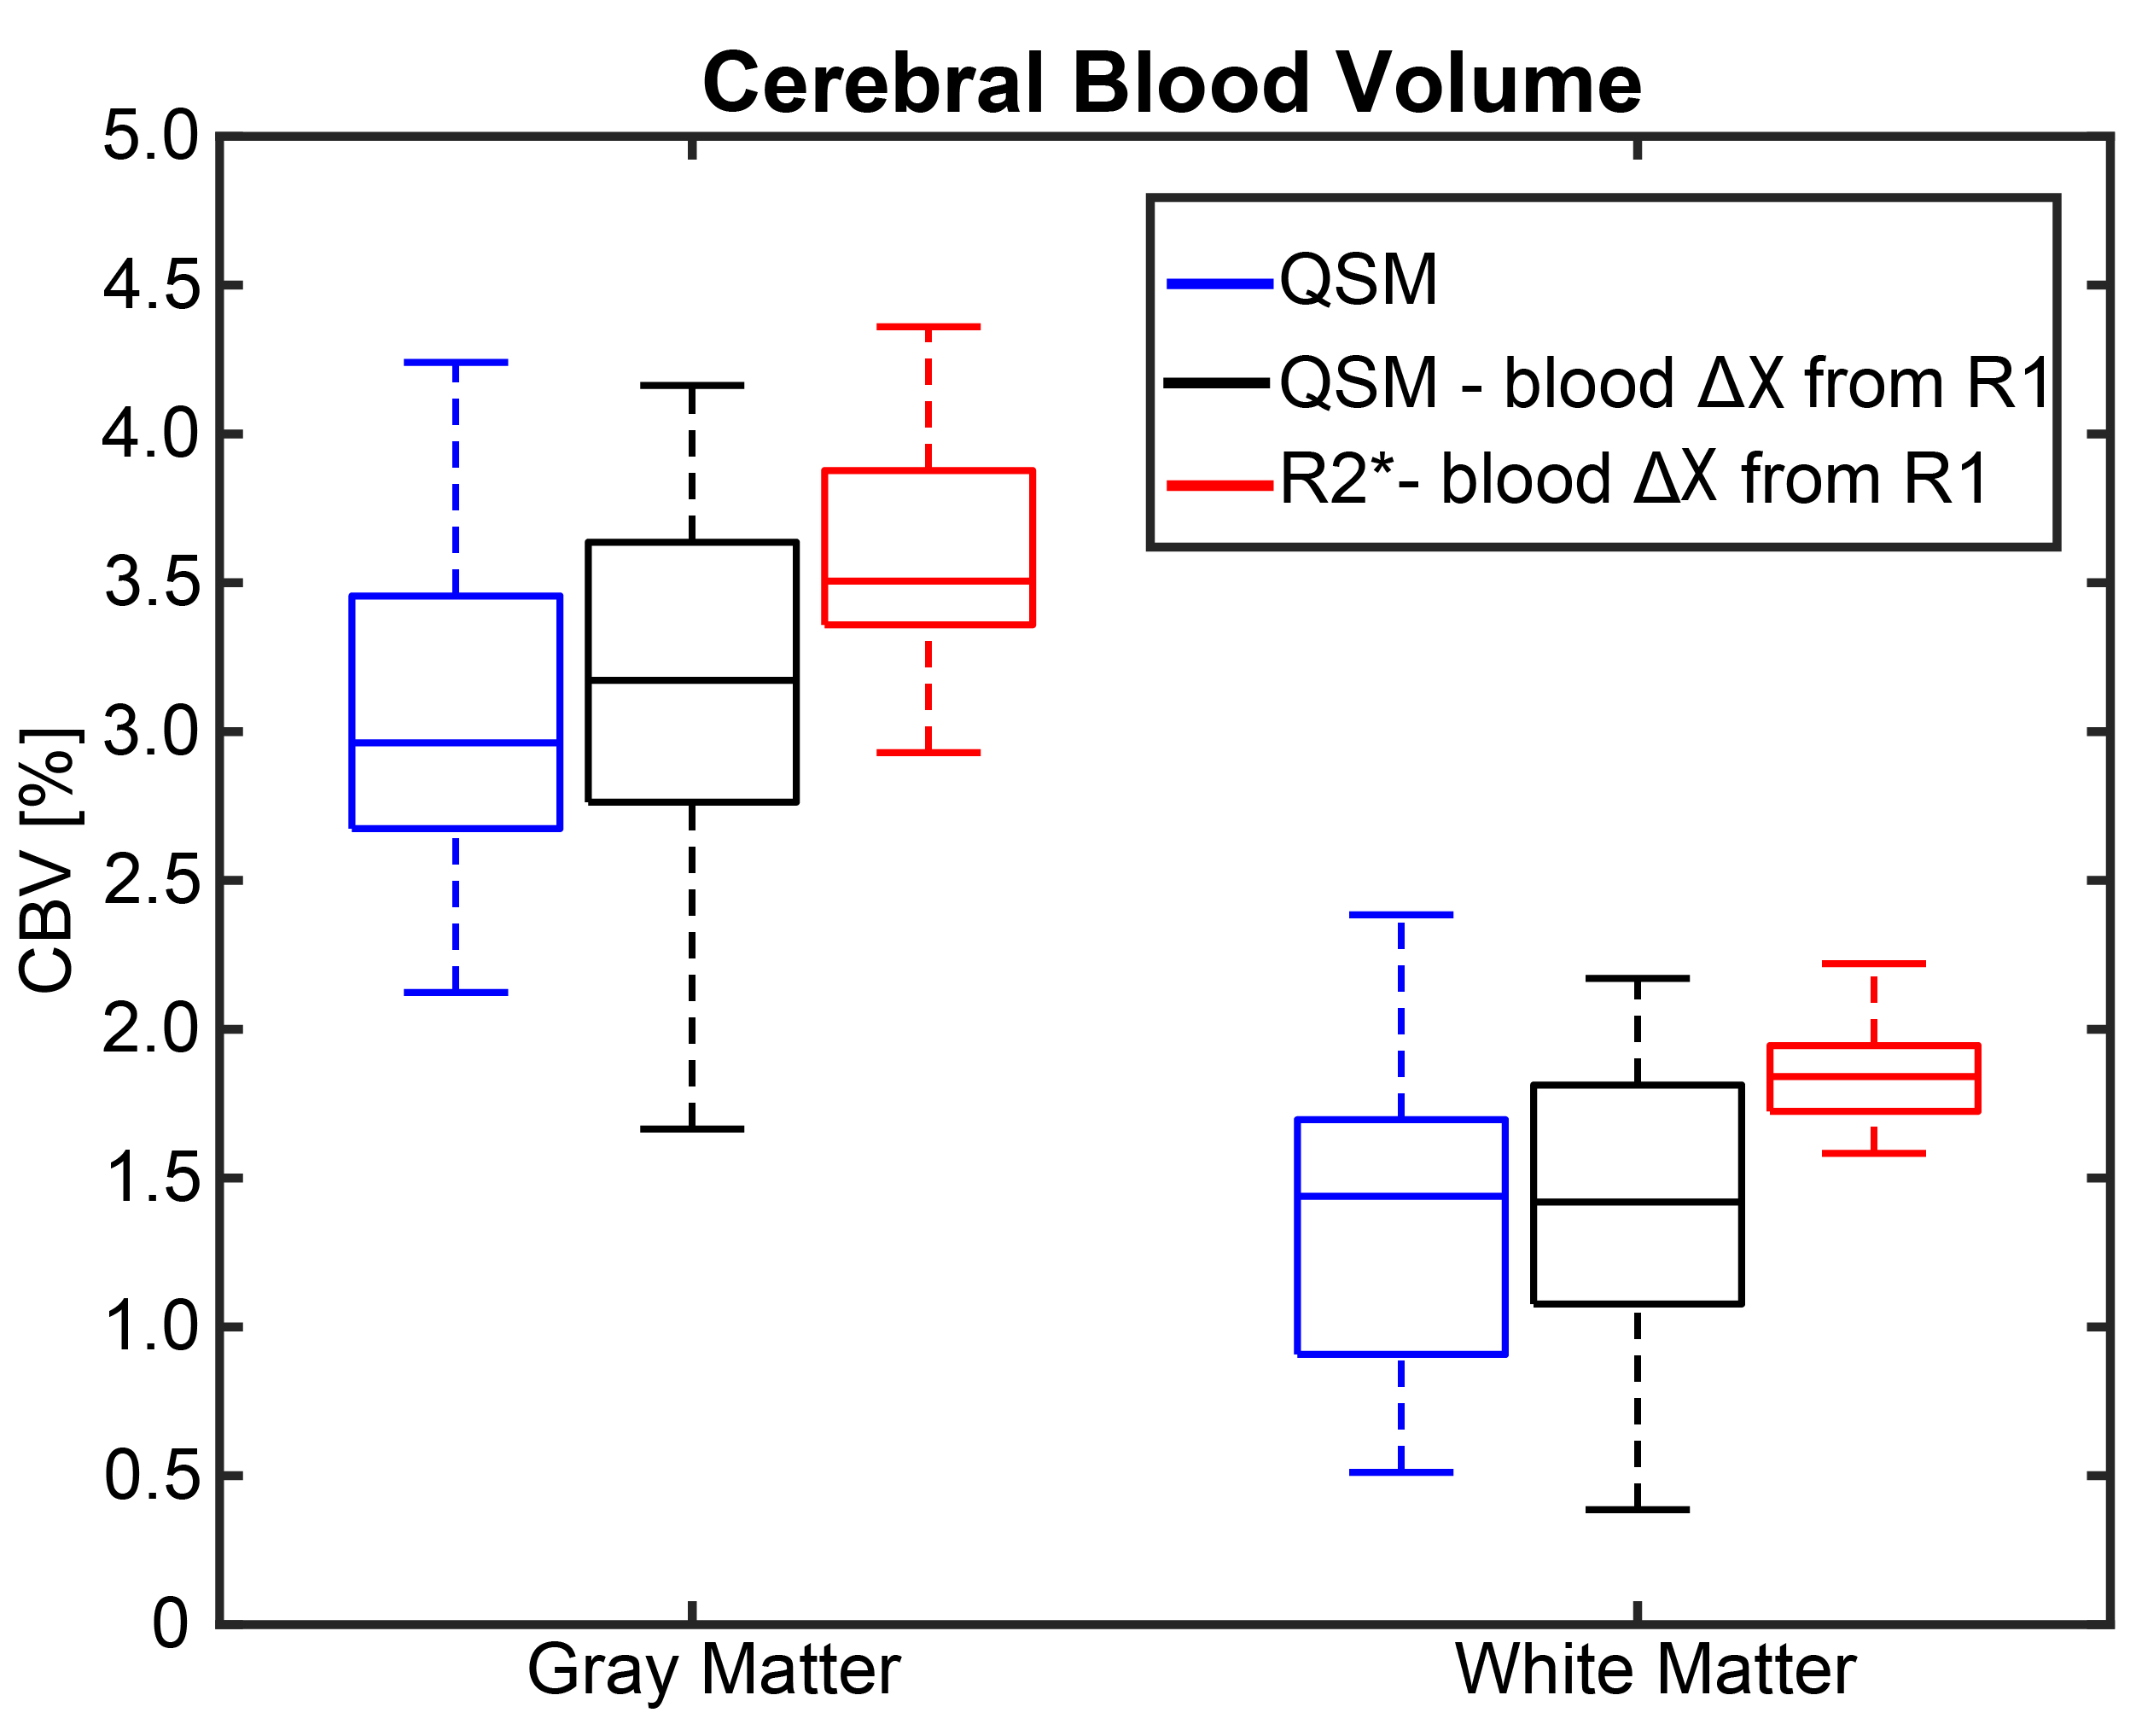
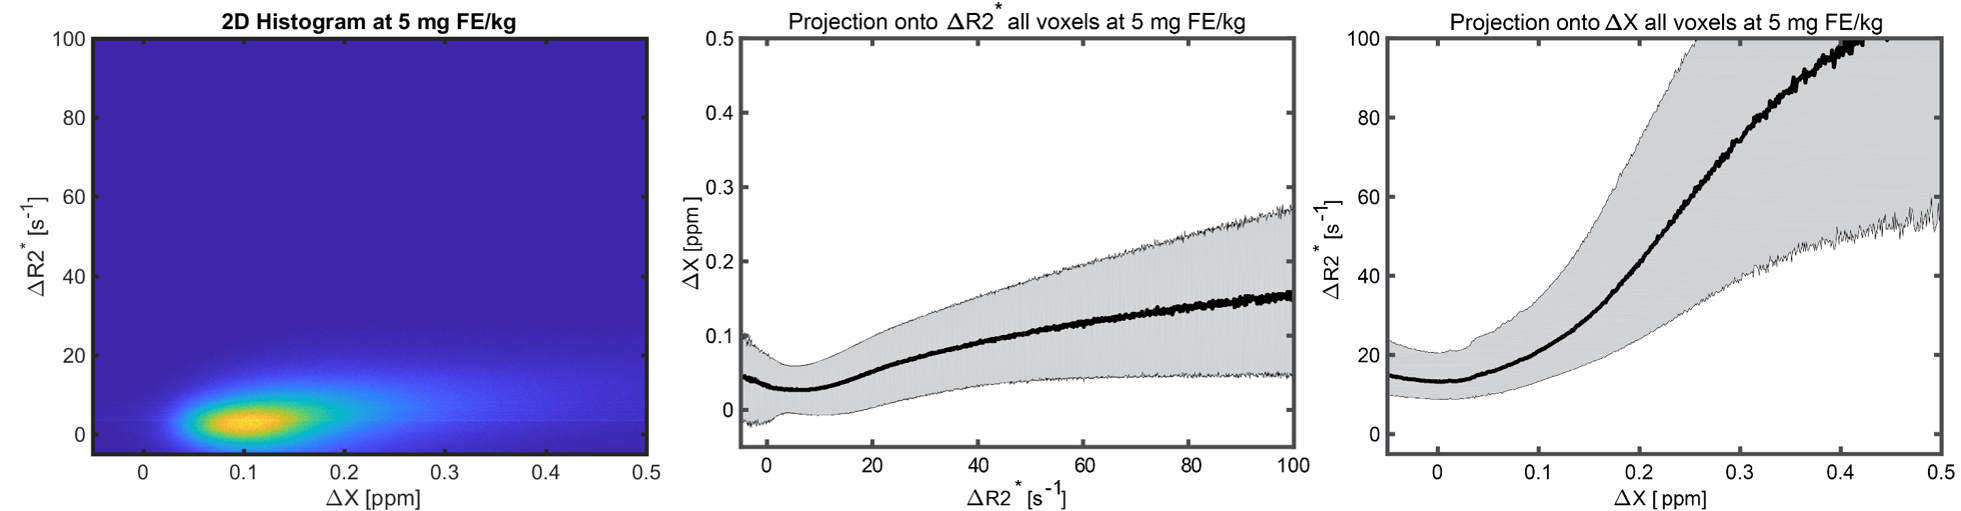
Figure 2 shows representative χ, R2*, Δχ, and ΔR2* images from a single slice of the volume from one subject. QSM images show GM and WM demarcation; however, some variation can be seen in the post contrast images, especially in white matter. R2* images show higher SNR. Figure 3 shows the comparison between the Δχ in blood from QSM, Nadler equation and R1 approaches. QSM and R1 Δχ measures are similar, but QSM shows a larger variance. As shown in Figure 4, QSM based CBV estimates are lower that R2* measures, the variance in WM suggest inherent challenges to remove the background field and to solve the ill posed problem in QSM. Figure 5 shows pixel wise relationship between χ and R2* measures for all subjects. The pixel wise correlation shows a slow increase when projected onto R2*. As projected onto Δχ, the ΔR2* tends to exhibit changes where the QSM does not, potentially indicating background field effects.DISCUSSION AND CONCLUSION:
In this work, we compare QSM and R2* based CBV measurements after the administration of ferumoxytol. The average QSM based measurements correlate well with R2* results, although inherent challenges persist to disentangle the background field effects from contrast enhancement. Ferumoxytol is delivered widely throughout the brain and may result in non-local susceptibility effects. The ideal approach of subtracting phase image prior to QSM processing (Fig1a) failed in our study. This technique potentially is challenged by the considerable time between pre and post contrast images (~40min). Further investigation is required of the solver and potential challenges relating to the complex distribution of contrast.Acknowledgements
We gratefully acknowledge R01NS066982, and GE Healthcare for assistance and support.References
- Roher AE. Cardiovascular system participation in Alzheimer's disease pathogenesis. J Intern Med 2015; 277: 426–428.
- Wang Y, et al. Quantitative susceptibility mapping (QSM): Decoding MRI data for a tissue magnetic biomarker. Magn Reson Med. 2015 Jan; 73(1): 82–101.
- Rivera-Rivera, et al. Comparison of ferumoxytol-based cerebral blood volume estimates using quantitative R1 and R2* relaxometry. Magn Reson Med. 2017 Nov 2. doi: 10.1002/mrm.26975.
- Liu T, et al. A novel background field removal method for MRI using projection onto dipole fields (PDF). NMR Biomed. 2011 Nov;24(9):1129-36 5.
- Liu J, et al. Morphology enabled dipole inversion for quantitative susceptibility mapping using structural consistency between the magnitude image and the susceptibility map. Neuroimage. 2012 Feb 1;59(3):2560-8.
Figures