0493
Flow Compensation in Dynamic Susceptibility Contrast MRI for an Increase in Arterial Input Function Precision1Centre d’imagerie moléculaire de Sherbrooke, Département de médecine nucléaire, Université de Sherbrooke, Sherbrooke, QC, Canada, 2MR Clinical Science, Philips Healthcare Canada, Markham, ON, Canada, 3Service de neurochirurgie, Département de chirurgie, Université de Sherbrooke, Sherbrooke, QC, Canada
Synopsis
Arterial input functions (AIF) measured inside major arteries in perfusion MRI are derived from the contrast agent induced changes in the blood signal. Such signal measurements of flowing blood are prone to (in)flow induced effects. Here, the effects of pulsatile blood flow are studied for AIF measurement in dynamic susceptibility contrast (DSC) with dual-echo single-shot EPI. First moment flow compensation is shown to partially recover the noise attributed to flow effects. The resulting signal-to-noise ratio is increased by a factor of 14 (2) in the middle (internal) carotid artery providing a more precise AIF for cerebral blood flow calculation.
Introduction
A major
challenge in dynamic susceptibility contrast (DSC) is the measurement of an
accurate and precise arterial input function (AIF). Such measurements can be
obtained from the blood signal inside the internal carotid artery (ICA) using a
dual-echo sequence to avoid arterial signal saturation, and using a partial
volume correction method (PVCM)1. Blood flow and inflow effects were
shown to be the main source of dynamic noise for AIF measurements in the aorta2. However, the extent of these effects
is unknown for the AIF measured in major brain arteries and no study has shown the
potential of flow compensation (FC) to mitigate these effects. This study aims
to quantify and to correct by first moment FC the error associated with
pulsatile blood flow in the middle cerebral artery (MCA) and the ICA.Methods
Cohort: The study was approved by the institutional ethics committee. Two healthy volunteers participated in this study.
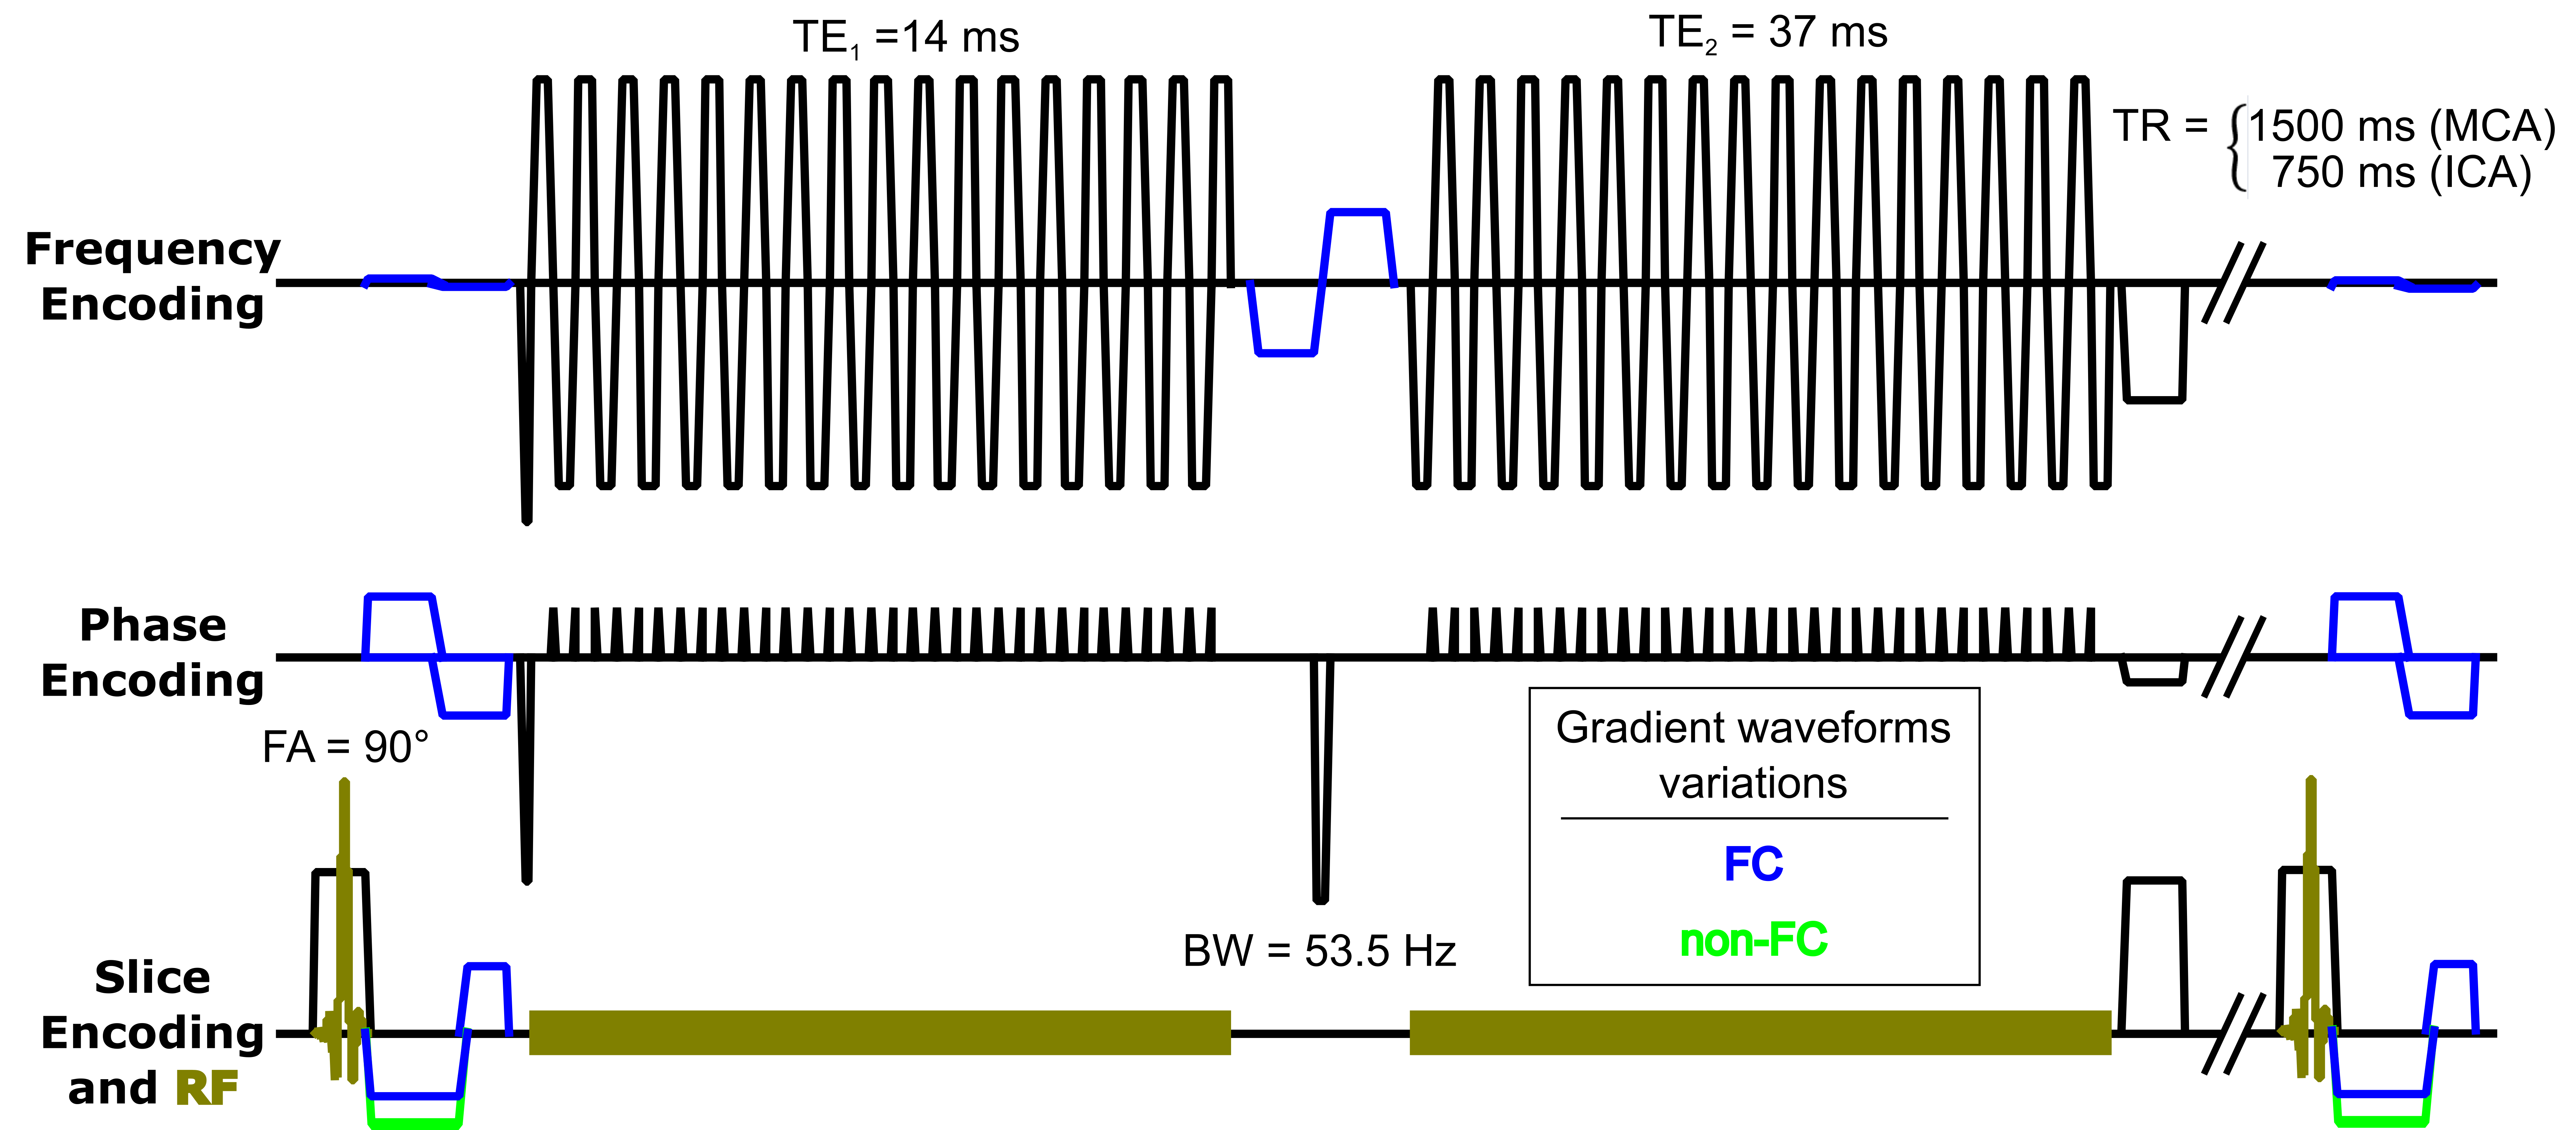
Acquisition: Imaging was performed on an Ingenia 3.0T scanner with a 32-channel head receiver coil (Philips Healthcare, Best, Netherlands). A single-slice 2D single-shot EPI dual gradient echo sequence (figure 1) was designed for the MCA signal measurements. Dynamic signal variations were assessed while recording the electrocardiogram (ECG) with automatic R-peak detection and acquisition trigger; the frames were then sorted by ECG trigger delay. Images were acquired with (FC) or without (non-FC) first moment FC. For FC, gradient waveforms were added to provide gradient first moment nulling in all encoding directions. FC reduces the phase dispersion and offset caused by a constant blood velocity between slice excitation and acquisition3. This sequence was extended to multi-slice for the ICA measurements and brain coverage during Gd-DO3A-butrol injection (0.05 mmol/kg). The gradient waveforms were alternated between the FC and the non-FC sequences for each dynamic frame to compare the effect of FC during the same injection. In addition, a single slice quantitative flow sequence measured the arterial pulsatile flow velocities perpendicular to the arteries.
Processing: AIF concentration curves were computed from the phase of the first echo signal curve ($$$S_1(t)$$$) after complex differences PVCM1. Cerebral tissue concentration was computed using the ratio of the first echo signal ($$$S_1(t)$$$) over the second echo signal ($$$S_2(t)$$$):
$$C_T(t)=\frac{1}{\textrm{TE}_2-\textrm{TE}_1}\textrm{ln}\left(\frac{S_1(t)S_2(t_0)}{S_2(t)S_1(t_0)}\right)/r_2^*$$
where $$$S_{1,2}(t_0)$$$ are the mean pre-injection signals of the first and second echoes, assuming a linear CA relaxivity of $$$r_2^*=87{\,}(\textrm{s}{\cdot}\textrm{mM})^{-1}$$$. Cerebral blood flow (CBF) was computed by solving the basic tracer kinetic equation with deconvolution using Tikhonov’s regularization and cubic B-spline constraint on the tissue impulse response function4.
Results and discussion
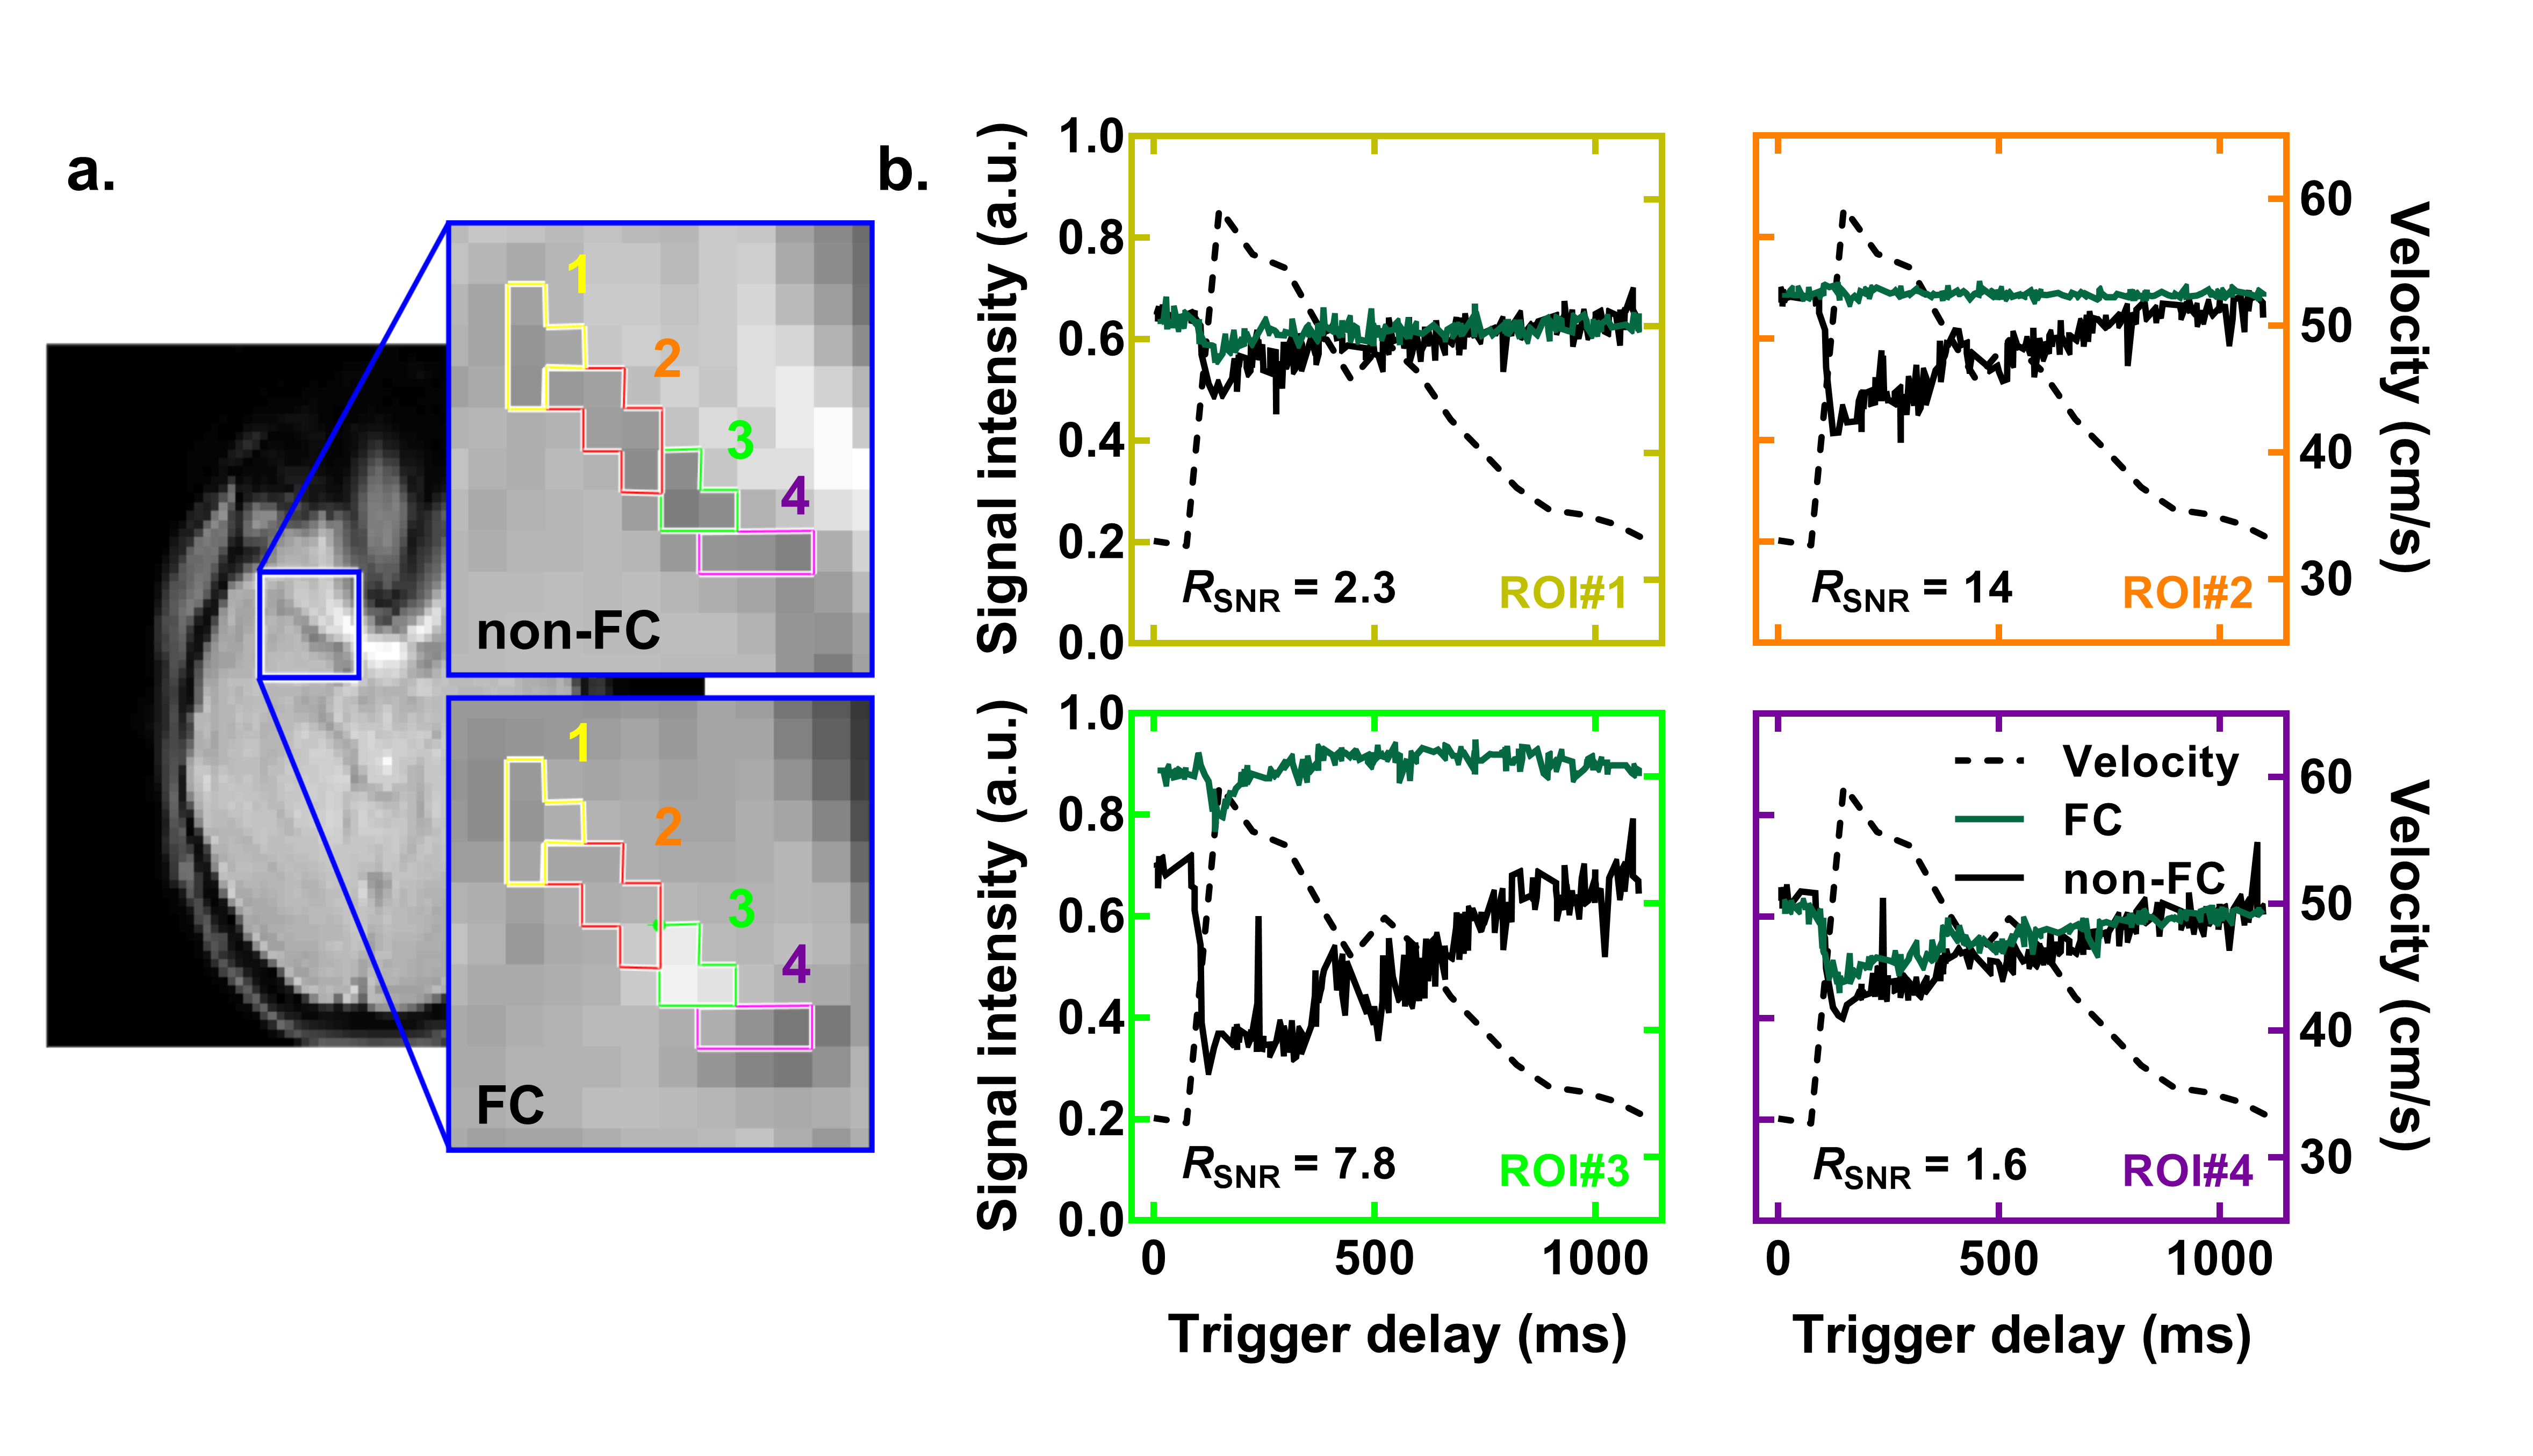
For ROI#2 in figure 2, FC increases the SNR by a factor of 14 with a complete recovery of the signal that exhibits a strong variation without FC, which indicates that the first order flow effects are the main source of noise for this region. The SNR improvement in other ROIs is lower – ROI#1 suffers from partial volume effect (smaller MCA) and higher order velocity effects (MCA curvature), and the upstream ROI#3 and ROI#4 suffer from inflow effects.
These results give additional insights on whether the AIF should be measured inside or outside the MCA. The noise seen without FC in ROI#2 is of similar amplitude as the expected blood signal fraction for the MCA. Thus, without FC, contrast agent-induced “intra-arterial” signal variations would mostly be due to a susceptibility effect on surrounding tissues fraction (partial volume effect) with a noisy blood contribution.
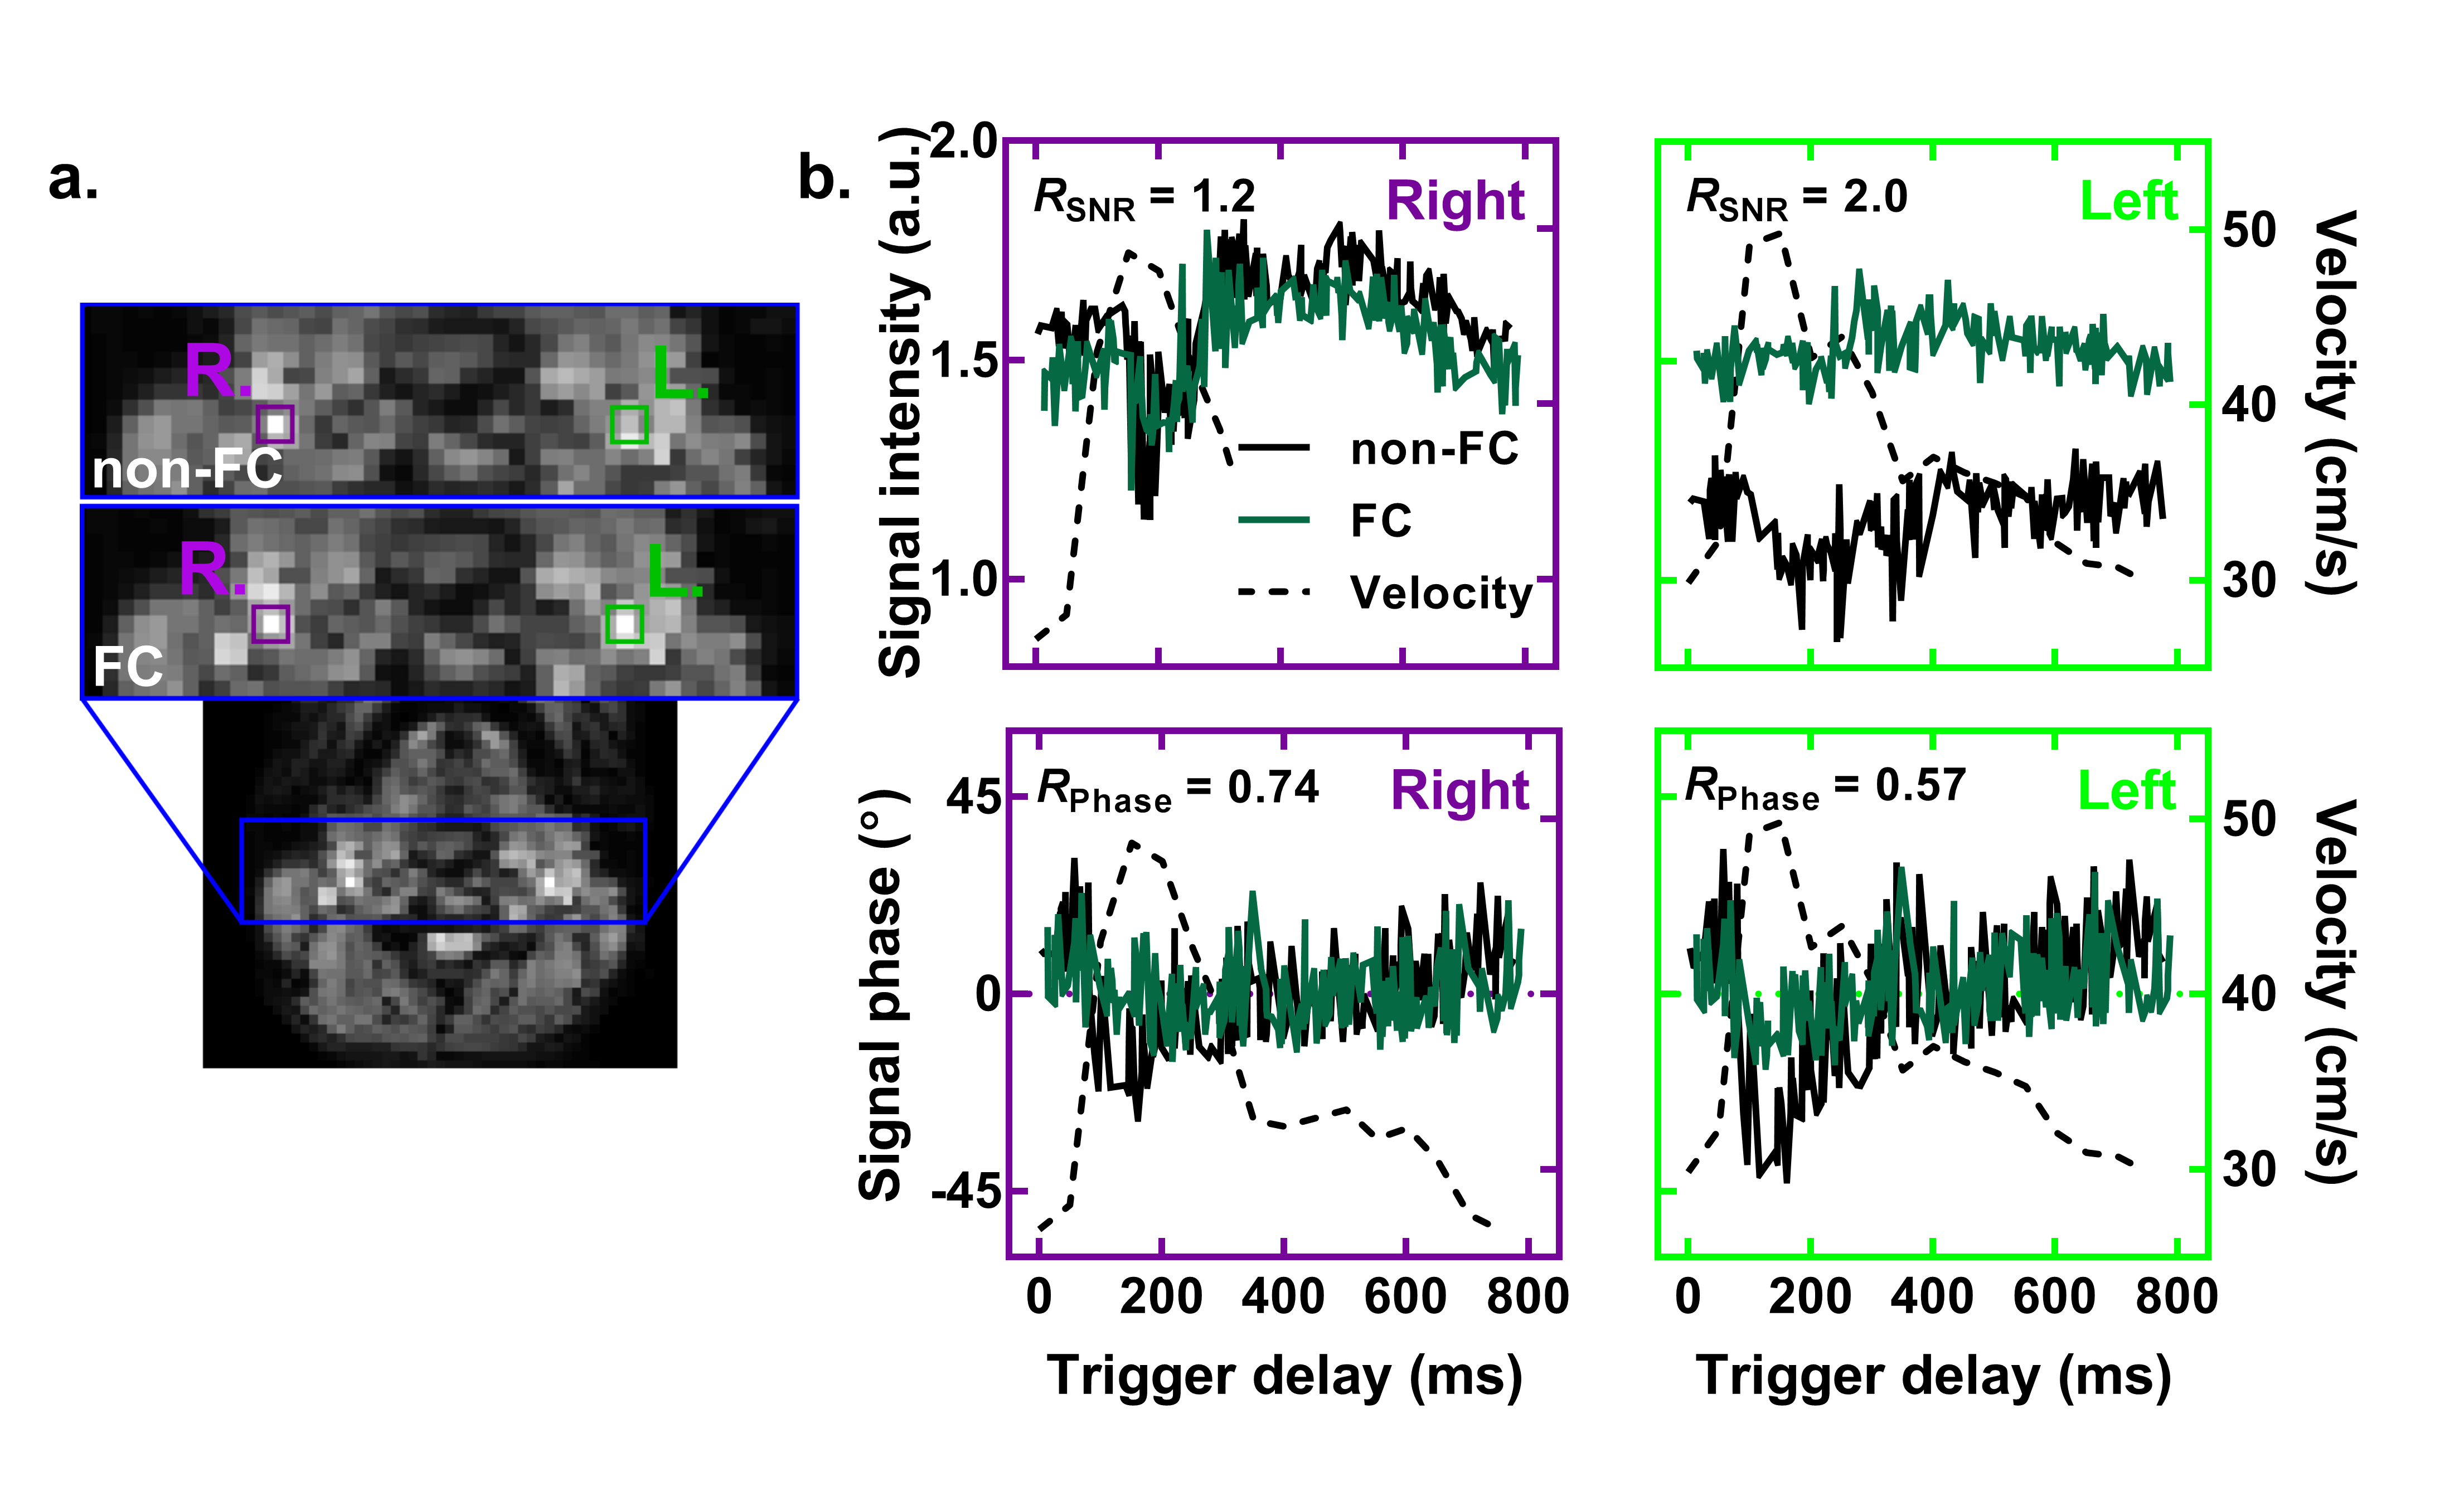
Next, ICA signal variations attributed to flow effects were smaller (figure 3) since the blood flow is almost parallel to the slice encoding direction, while FC mostly corrects in the phase encoding direction (for single-shot-EPI). FC still improves the SNR by a factor of 2.0 and reduces dynamic noise of the signal phase by a factor of 0.57 for the left ICA. The lower performance of FC for the right ICA might be explained by its larger curvature or its proximity to the bifurcation which might create higher order flow effects.
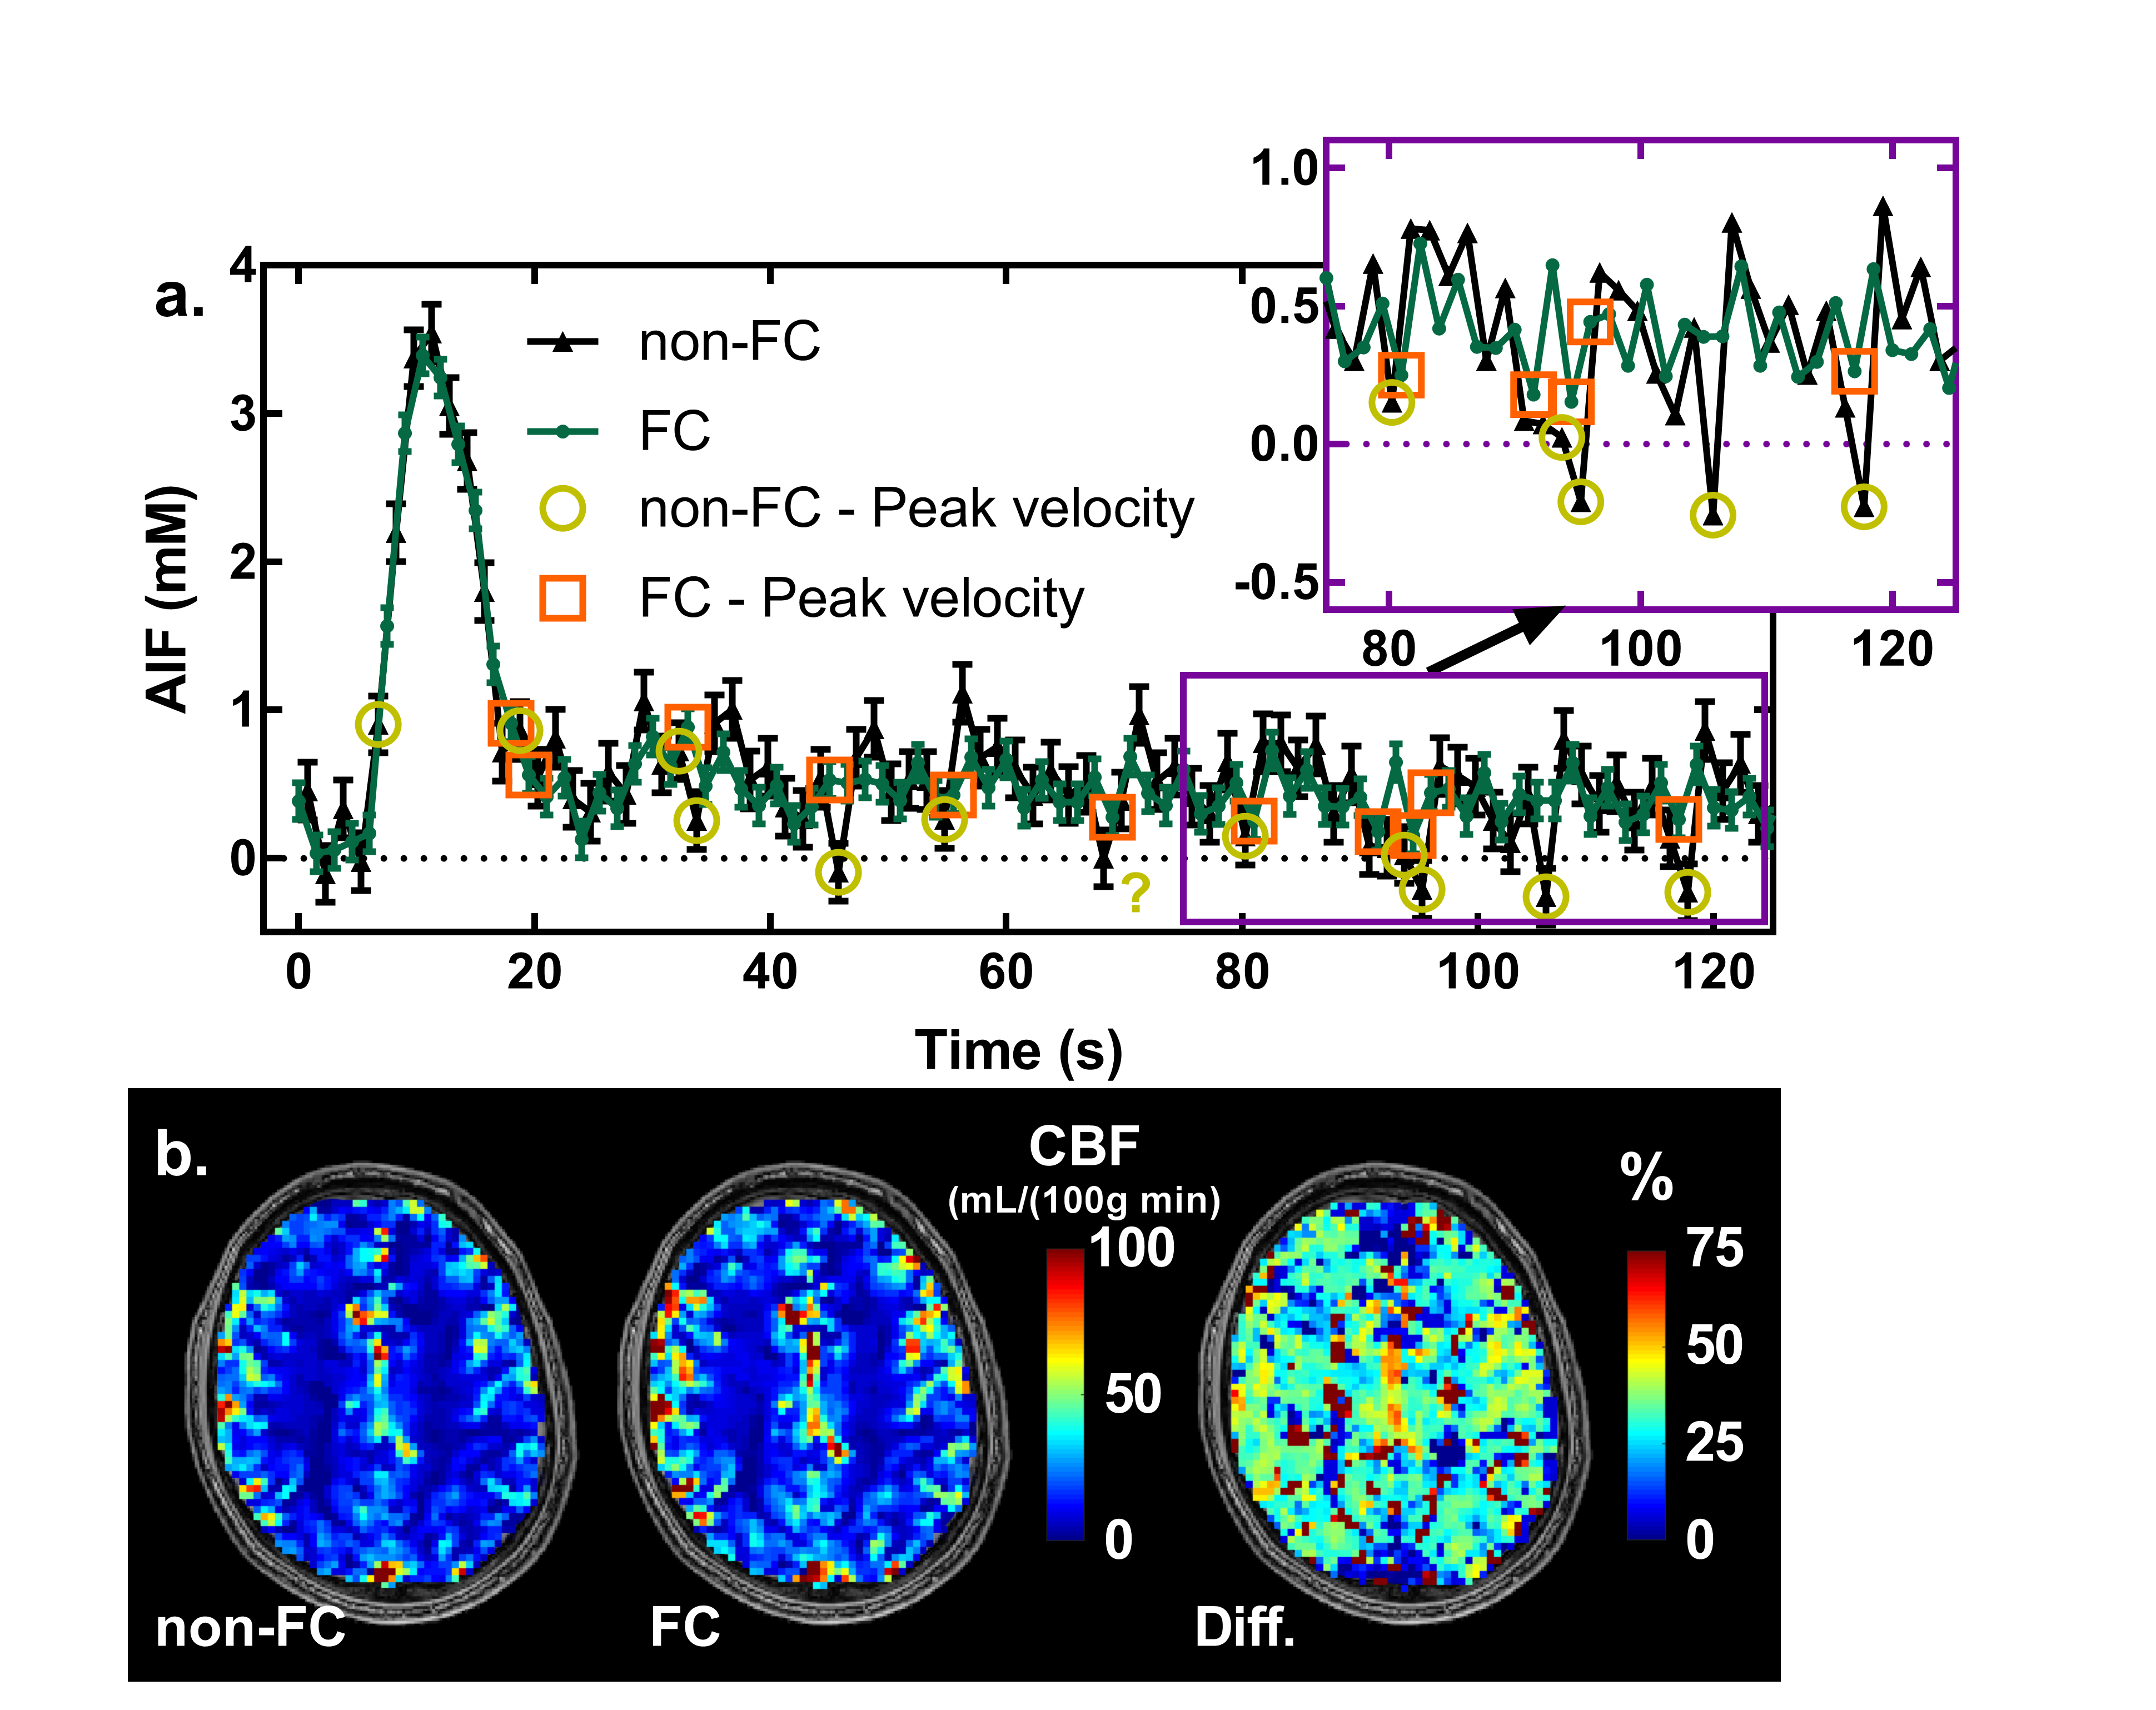
In figure 4a, reduced dynamic variations in signal intensity and phase during the bolus improved the complex data for the PVCM and the resulting phase based AIF. The differences between AIFs are mostly within error bars except for data measured during peak velocity, which are lower for non-FC. This AIF improvement resulted in a 32% median increase in the calculated CBF (figure 4b).
Conclusion
Blood signal dynamic noise is largely correlated with pulsatile blood flow in the MCA and ICA. FC short bipolar gradients reduced the noise in blood signal intensity and phase, which improved the AIF precision in the ICA and increased the calculated CBF by 32%.Acknowledgements
Benoît Bourassa-Moreau is supported by a NSERC Alexander-Graham-Bell PhD Graduate Scholarship.
References
1. Van Osch MJP, Vonken EPA, Viergever MA, Van der Grond J, Bakker CJG. Measuring the arterial input function with gradient echo sequences. Magn Reson Med. 2003;49(6):1067-1076.
2. Akbudak E, Conturo TE. Arterial input functions from MR phase imaging. Magn Reson Med. 1996;36(6):809-815.
3. Nishimura DG, Jackson JI, Pauly JM. On the nature and reduction of the displacement artifact in flow images. Magn Reson Med. 1991;22(2):481-492.
4. Larsson HBW, Hansen AE, Berg HK, Rostrup E, Haraldseth O. Dynamic contrast-enhanced quantitative perfusion measurement of the brain using T1-weighted MRI at 3T. J Magn Reson Imaging. 2008;27(4):754-762.
Figures