0491
Intraplaque Hemorrhage and Calcification Detection with Quantitative Susceptibility Mapping1Wellcome Centre for Integrative Neuroimaging, FMRIB, Nuffield Department of Clinical Neurosciences, University of Oxford, Oxford, United Kingdom, 2The MRI Institute for Biomedical Research, Detroit, MI, United States, 3Center for Functional and Metabolic Mapping, Robarts' research institute, Western University, London, ON, Canada, 4Biomedical Imaging Research Institute, Cedars-Sinai Medical Center, Los Angeles, CA, United States, 5Xuanwu Hospital, Capital Medical University, Beijing, China
Synopsis
In carotid atherosclerosis, the vulnerable feature that has drawn the most attention is intraplaque hemorrhage (IPH). Clinically, MPRAGE has been used to detect IPH. However, IPH has several drawbacks. The
susceptibility difference between arterial blood, vessel wall and different
types of plaque makes QSM a potential tool for carotid plaque imaging. The purpose of this
work was to develop an optimized protocol for both intraplaque hemorrhage and
calcification imaging using Quantitative Susceptibility Mapping (QSM) and demonstrate
initial clinical validation of QSM as a tool for characterizing components of carotid
plaque.
Introduction
Vulnerable plaque has been recognized as the most important biomarker when assessing the patient risk for future ischemic events. Several vulnerable features have been proposed over the years, while the vulnerable feature that has drawn the most attention is intraplaque hemorrhage (IPH) [1]. Previous studies have demonstrated that IPH accelerates the growth of carotid plaque and is also considered to be a proinflammatory stimulus that degrades the fibrous cap, thus, casing ischemic events [2]. Besides, micro calcification is another vulnerable plaque feature which may cause plaque rupture. Clinically, multicontrast black-blood methods such as T1WI, T2WI and MPRAGE have been used to detect IPH and calcification in carotid plaques. Quantitative susceptibility mapping (QSM) is a novel technique that quantifies tissue magnetic susceptibility [3] and the susceptibility difference between arterial blood, vessel wall and different types of plaque makes QSM a potential tool for carotid plaque imaging. The purpose of this work was to develop an optimized protocol for both intraplaque hemorrhage and calcification imaging using Quantitative Susceptibility Mapping (QSM) and demonstrate initial clinical validation of QSM as a tool for characterizing components of carotid plaque.Methods
Proposed data acquisition strategy
We propose to college three echoes at TEs of 5.1ms (water/fat in-phase), 4.47ms (water/fat 270° out-of-phase), and 5.73ms (water/fat 90° out-of-phase) using 3D SWI sequence. Imaging parameters for 3T scan are shown in Table 1.
Proposed phase post-processing method
The following steps were performed to reconstruct susceptibility maps:
1. A mask was generated from original magnitude images with unity inside the vessels and zero for outside regions. The unity region is then dilated by 48 pixels to cover the surrounding area.
2. Original magnitude and phase images were manually reviewed to locate plaques and evaluate the phase behavior of the plaque. In the case of no plaque or no phase aliasing inside the plaque, a spatial domain Laplacian unwrapping algorithm [4] was applied to the phase images from water/fat in-phase (TE=5.1ms) echo. In the case of plaque with high susceptibility, thus, causing phase aliasing inside the plaque, a temporal domain phase unwrapping algorithm [5] was performed to unwrap the phase images.
3. Sophisticated harmonic artifact reduction for phase data (SHARP) [6] with kernel size=4 was subsequently applied to the unwrapped TE=5.1ms phase to remove background field induced by the air/tissue interface.
4. Dipole inversion Susceptibility maps were generated from the local phase information using the truncated k-space division approach [7].
In vivo MR data acquisition
Ten healthy controls and six patients (2 female and 8 males, age ranged from 23 to 66 years, mean age 37 years) were included in this study, with known atherosclerotic plaque in carotid arteries. QSM were collected on 3T scanners (Siemens Healthcare, Erlangen, Germany). Four scans were performed including 3D SWI, 3D magnetization prepared rapid acquisition gradient echo (MPRAGE), 3D T1 variable-flip-angle refocusing radio-frequency (RF) pulses (SPACE), and 3D “Time-of-Flight” (TOF) sequences.
Quantitative analysis
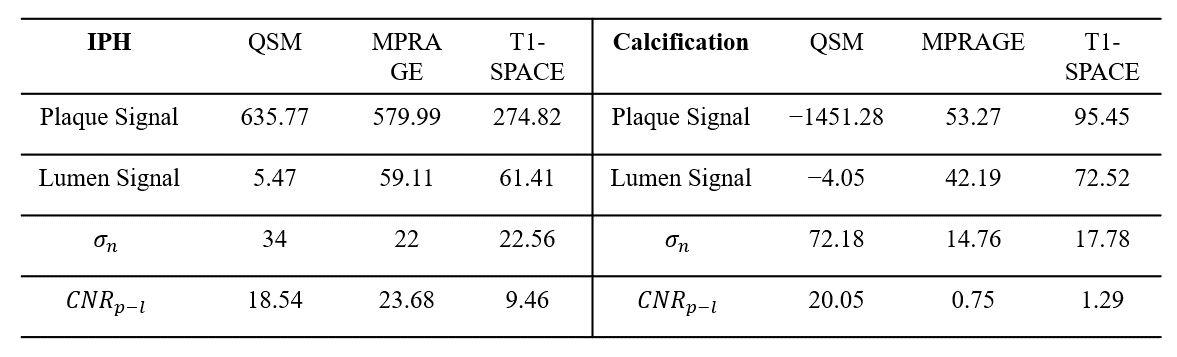
Lumen signal (Sl) was measured as the mean signal intensity of the entire lumen region. Plaque signal (Sp) was measured as the mean signal intensity of the plaque region. Noise level (σn) was measured as the standard deviation (STD) of signal intensity in the adjacent sternocleidomastoid muscle region. Thus, the plaque-lumen contrast to noise ratio (CNR) could be calculated as
CNRp-l=|Sp-Sl|/σn
Results
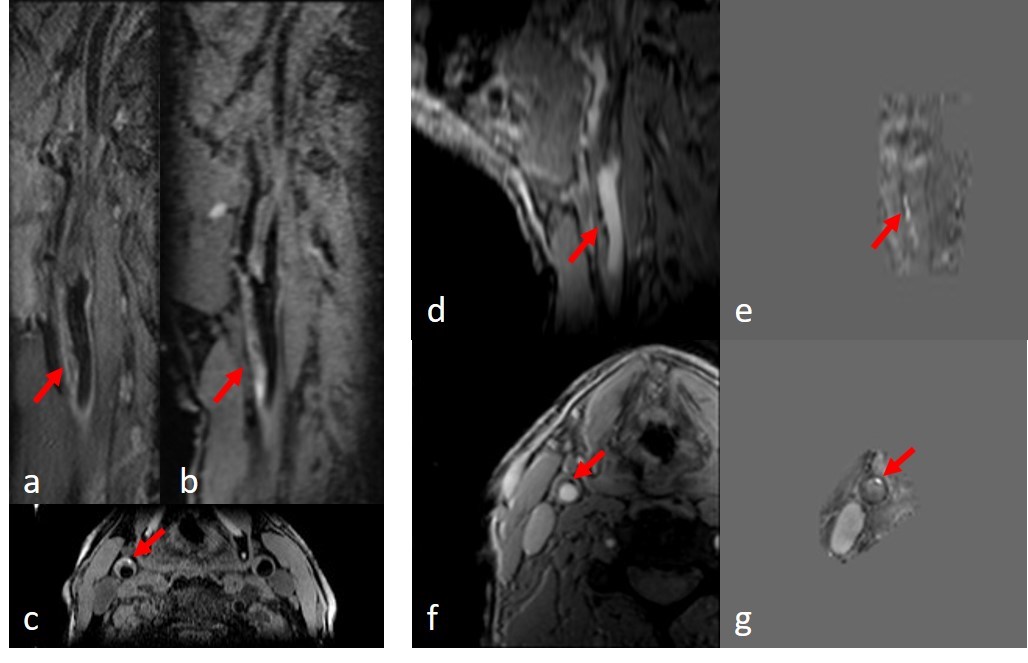
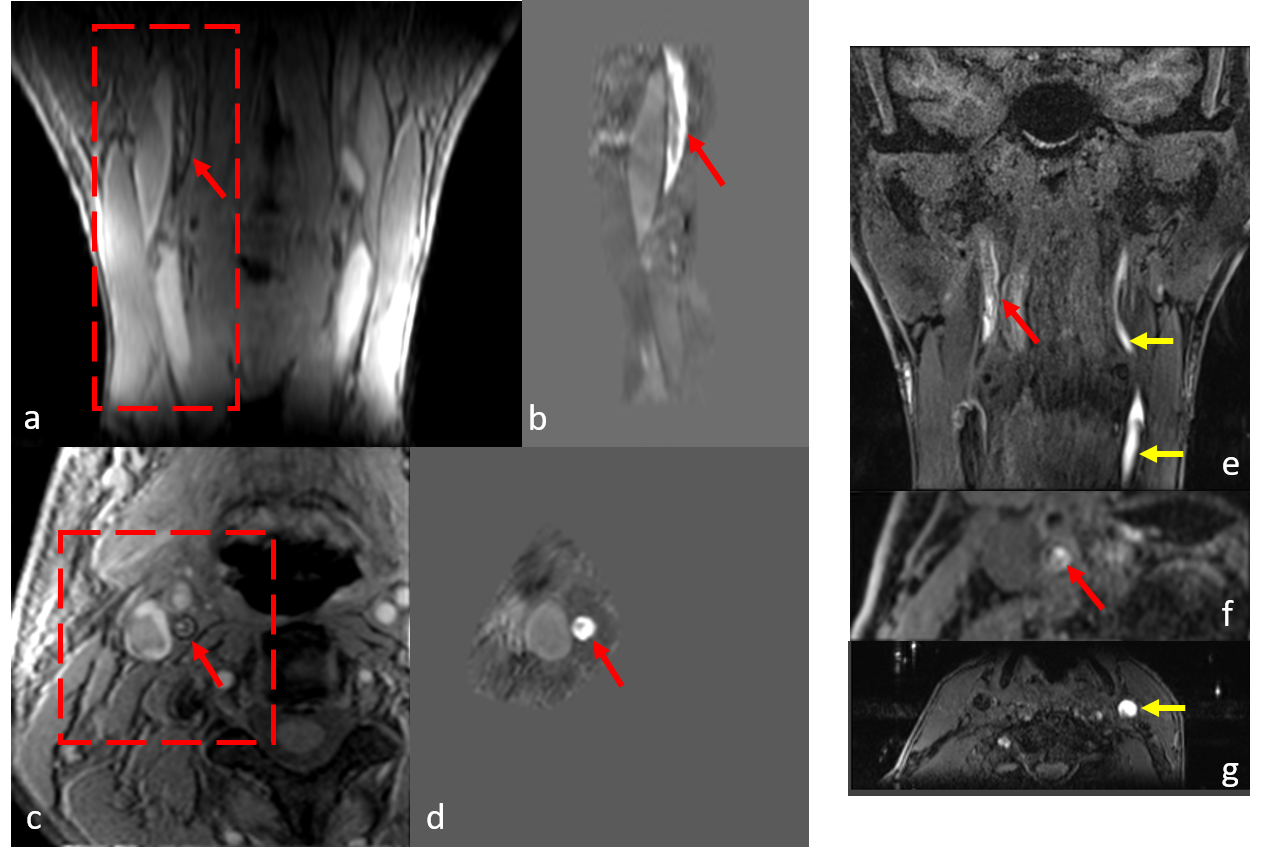
Iron laden features such as IPH or thrombus were found to have high positive susceptibility values on generated susceptibility maps, as shown in Figure 1 and Figure 2. QSM showed good agreement with T1-SPACE and MPRAGE methods in terms of detecting IPH location and size. However, as seen in Figure 2, MPRAGE might be hampered by flow and motion artifacts.
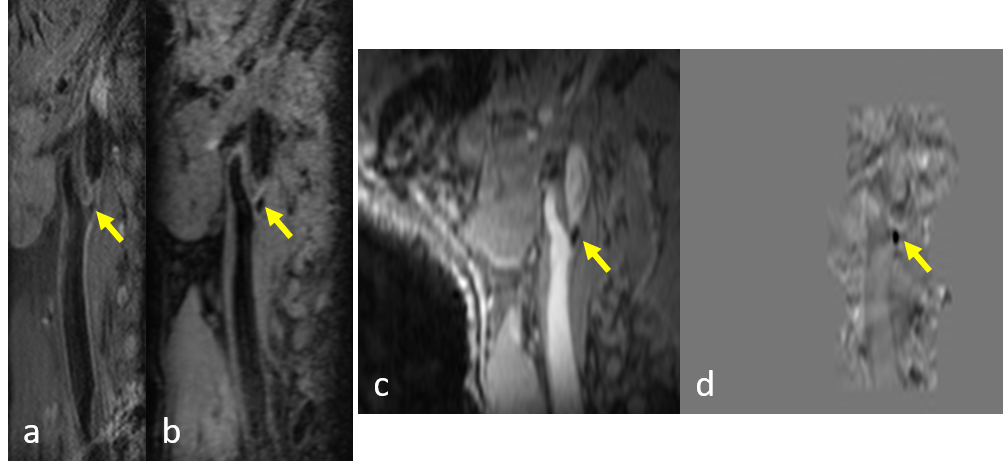
As shown in Figure 3, plaque calcification showed negative susceptibility on QSM images and isointense with blood signal on MPRAGE and T1-SPACE, thus, calcification and surrounding blood can be clearly differentiated on QSM.
The results of quantitative analysis were shown in Table 2, QSM has shown similar plaque-lumen CNR with MPRAGE for IPH. However, for calcification, QSM has shown substantially higher plaque-lumen CNR than MPRAGE and T1-SPACE.
Conclusions
In conclusion, we have successfully developed and demonstrated the feasibility of QSM for depicting both IPH and calcification in the carotid artery. Comparing to conventional black-blood techniques, the proposed technique is less sensitive to motion artifacts and flow artifacts and it is promising to serve as a reliable and straightforward tool for vessel wall imaging.Acknowledgements
No acknowledgement found.References
1. F. D. Kolodgie, H. K. Gold, A. P. Burke et al. Intraplaque hemorrhage and progression of coronary atheroma. The New England Journal of Medicine, vol. 349, no. 24, pp. 2316– 2325, 2003.
2. R. Virmani, F. D. Kolodgie, A. P. Burke et al. Atherosclerotic plaque progression and vulnerability to rupture: angiogenesis as a source of intraplaque hemorrhage. Arteriosclerosis, Thrombosis, and Vascular Biology, vol. 25, no. 10, pp. 2054– 2061, 2005.
3. Haacke, E. M., Liu, S., Buch, S., Zheng, W., Wu, D., & Ye, Y. (2015). Quantitative susceptibility mapping: current status and future directions. Magnetic resonance imaging, 33(1), 1-25.
4. Schofield MA, Zhu Y. Fast phase unwrapping algorithm for interferometricapplications. Opt Lett 2003;28(14):1194–6.
5. Feng, W., Neelavalli, J., & Haacke, E. M. (2013). Catalytic multiecho phase unwrapping scheme (CAMPUS) in multiecho gradient echo imaging: removing phase wraps on a voxel‐by‐voxel basis. Magnetic resonance in medicine, 70(1), 117-126.
6. Schweser F, Deistung A, Lehr BW, Reichenbach JR. Quantitative imaging of intrinsic magnetic tissue properties using MRI signal phase: An approach to in vivo brain iron metabolism? NeuroImage 2011;54(4):2789-2807
7. Schweser F, Deistung A, Lehr BW, Reichenbach JR. Quantitative imaging of intrinsic magnetic tissue properties using MRI signal phase: An approach to in vivo brain iron metabolism? NeuroImage 2011;54(4):2789-2807
Figures