0488
Preliminary study of PET/MR 18F-NaF imaging combined with CATCH sequence of high-risk plaque1Department of Nuclear Medicine, Chinese PLA General Hospital, Beijing, China, 2Department of Cardiology, Chinese PLA General Hospital, Beijing, China, 3Cedars Sinai Medical Center, Los Angeles, CA, United States, 4Siemens Shenzhen Magnetic Resonance Ltd. China, Beijing, China
Synopsis
This study aimed to investigate the value of PET/MR 18F-NaF combined with CATCH technology in the diagnosis of high-risk plaque preliminarily. We compared if it had the statistical difference of PMR and TBRmax between the culprit vascular plaque and the control,and evaluated if it had correlation between PMR and TBRmax. There were higher PMR and TBRmax in culprit plaque. PMR and TBRmax had a weak correlation. PET/MR 18F-NaF combined with the CATCH technique can noninvasively determine the location of high-risk plaque in coronary artery, and is valuable for the diagnosis of high-risk plaque.
Introduction
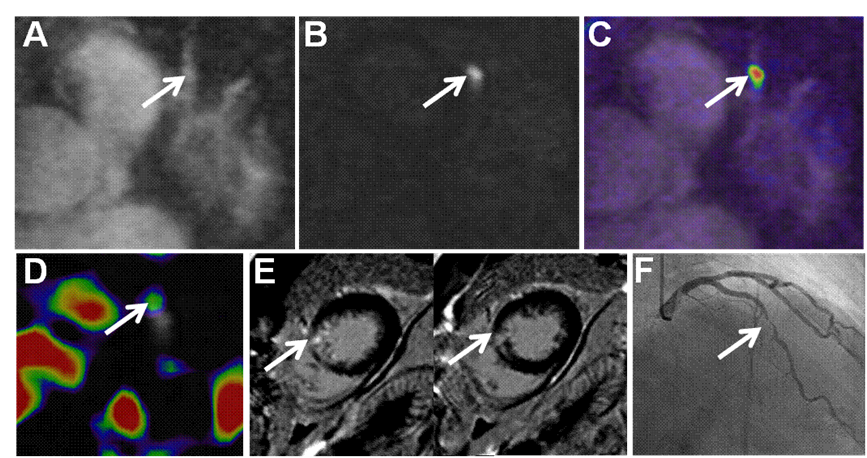
18F-NaF PET [1]is a promising non-invasive imaging method to identify ruptured or high-risk coronary plaque with active calcification. Its CMR counterpart, coronary atherosclerosis T1-weighed characterization with integrated anatomical reference, CATCH, has the capability to detect high-risk plaque features such as hemorrhage[2]. The combination of both techniques from a PET/MR scan may provide unique complementary information regarding the disease status. This paper preliminarily investigated the value of PET/MR 18F-NaF combined with CATCH imaging technology in the diagnosis of high-risk plaque.Methods
10 patients with clinically suspected acute myocardial infarction underwent cardiac 18F-NaF combined with CATCH and Gd MR delayed enhancement (LGE) gated imaging. All patients underwent coronary angiography within 1 day after PET/MR (Siemens Healthcare,Erlangen,Germany)examination. CATCH bright-blood images can provide anatomical localization for PET images and dark-blood images. According to the location of the plaque which was defined by coronary angiography, plaque to myocardium signal intensity ratio (PMR) of the lesion was measured in CATCH dark-blood images. Focal 18F-NaF uptake of each lesion was quantified using maximum tissue-to-background ratio (TBRmax). PET quantification was performed by delimiting 3‐dimensional regions of interest on fused PET/MR angiography using FusionQuant software (Cedars‐Sinai Medical Center, Los Angeles, CA)[3]. Rank sum test was used to compare the statistical difference of PMR and TBRmax between the culprit and non-culprit lesions. Pearson correlation analysis was performed between PMR and TBRmax.Results
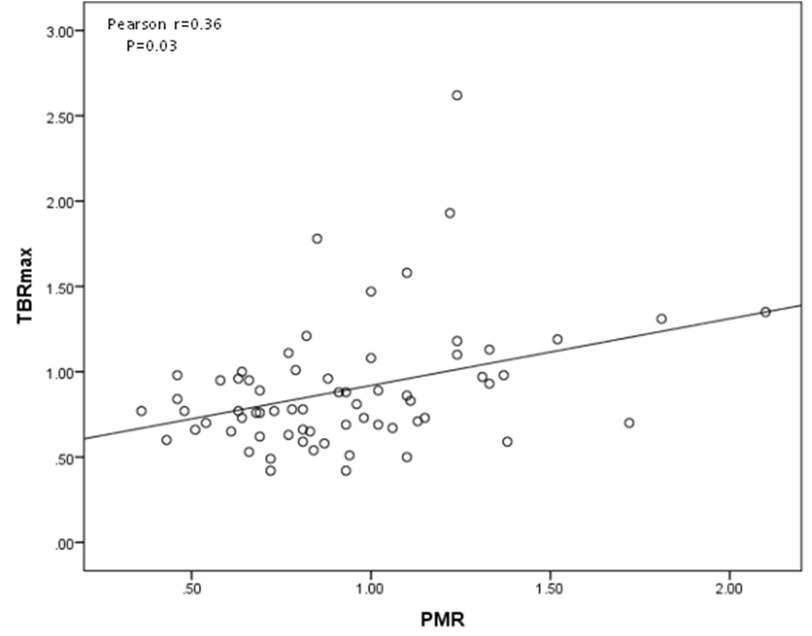
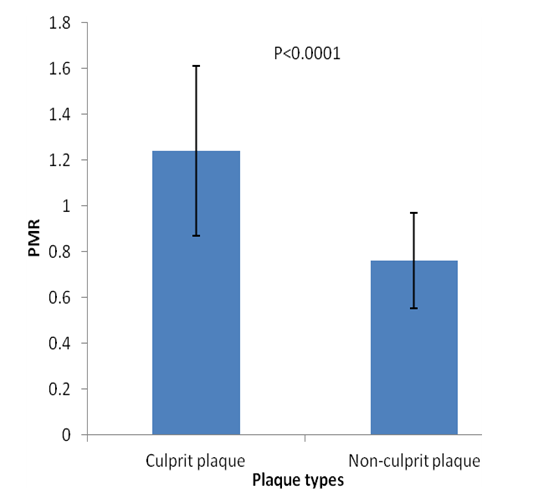
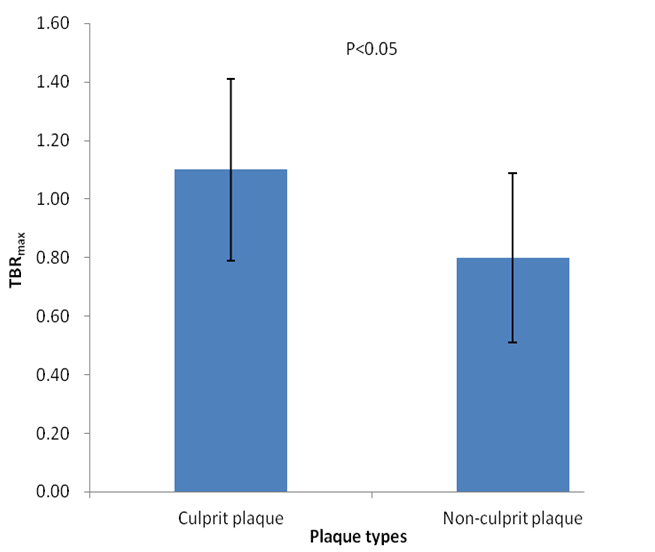
All of the 10 patients were successfully examined. A total of 45 plaques were identified in all patients in coronary angiography. According to the clinical symptoms, ECG, echocardiography, coronary angiography and delayed myocardial enhancement, 15 culprit vessels were identified and 18 plaques were found. The plaques in culprit vessels showed a higher PMR than the plaques in non-culprit vessels (1.24±0.37 versus 0.76±0.21, P<0.0001). The plaques in culprit vessels showed a higher TBRmax than the plaques in non-culprit vessels (1.10± 0.31 versus 0.80±0.29, P<0.05).There was a weak correlation between PMR and TBRmax (r=0.36, P=0.03).Conclusions
We demonstrated that PET/MR 18F-NaF combined with the CATCH technique is a feasible noninvasive method to provide multi-parametric evaluation of coronary plaque. PMR derived from CATCH and TBRmax derived from 18F-NaF PET can be used as diagnostic biomarkers for high-risk plaque. TBRmax is weakly correlated with PMR, suggesting a potentially different pathological information rendered by the two modalities. A larger cohort is needed to further elucidate their overlap and difference.Acknowledgements
References
[1] Joshi NV, Vesey AT, Williams MC, et al. 18F-fluoride positron emission tomography for identification of ruptured and high-risk coronary atherosclerotic plaques: a prospective clinical trial. Lancet. 2014;383:705–713.
[2] Xie Y, J, Kim YJ, Pang et al. Coronary atherosclerosis T1-weighed characterization with integrated anatomical reference: comparison with high-risk plaque features detected by Invasive Coronary Imaging. JACC Cardiovascular imaging. 2017; 10:637–648.
[3]Mhairi K Doris,Mathieu Rubeaux,Tania Pawade,et al.Motion‐corrected imaging of the aorticvalve with 18 F‐NaF PET/CT and PET/MR: afeasibility study. J Nucl Med.2017; doi:10.2967/jnumed.117.194597
Figures