0472
Segmentation of the brain using direction averaged signal in DWI images1Psychological and Brain Sciences, Indiana University, Bloomington, IN, United States
Synopsis
A novel segmentation method using the direction-averaged DWI signal is proposed. Two images can be obtained from the fitting of the direction-averaged DWI signal: one with superior contrast between the gray matter and white matter; one with prominent CSF contrast. A pseudo T1 weighted image can be constructed and standard segmentation tools can be applied. The method was tested on the HCP subjects in SPM12 and FSL, and showed good agreement with segmentation using the T1 weighted image with the same resolution.
Introduction
Brain segmentation can provide useful information for anatomically-constrained tractography to improve the reliability for fiber tracking 1. Usually, the segmentation is performed on the T1 weighted (T1w) image and warped to the diffusion weighted imaging (DWI) image space. It is well known that DWI images suffer from severe distortion in some area with susceptibility artifact, which can introduce errors in the warping of T1w image to the DWI image space. Therefore, segmentation directly on the DWI image is desirable. Another great value of DWI based segmentation is delineating the brain lesions in clinical applications. Methods have been proposed to segment on the DWI image using different DWI derived maps such as mean diffusivity (MD), fractional anisotropy (FA) 2. In the meanwhile, more advanced algorithm was proposed to tackle DWI based segmentation 3.
Because of the complex microstructure that affects the diffusion properties, the classification of brain tissues solely based on the DWI derived indices can be challenging. For instance, FA at the voxels with fiber crossing can be similar to the FA in the gray matter. Recently, it was found that a power law relationship exists between the direction-averaged signal and the diffusion weighting for b-values between 1000 and 6000 s/mm2 4. Here we present a new method of segmentation based on the power law of averaged signal over different directions, which is less sensitive to the underlying fiber configuration.
Methods
The empirical power law can be descried by the following equation 4:
$$\log{\frac{\overline{S}}{S_0}} = \alpha\cdot\log{\frac{{b_1}}{b}}-\beta$$
where $$$\overline{S}$$$ is the direction averaged signal for b-value b, $$$S_0$$$ is the non-diffusion weighted signal, b1 = 1000 s/mm2 is the reference b-value. Both α and β are dimensionless constants that can be fit from the signal.
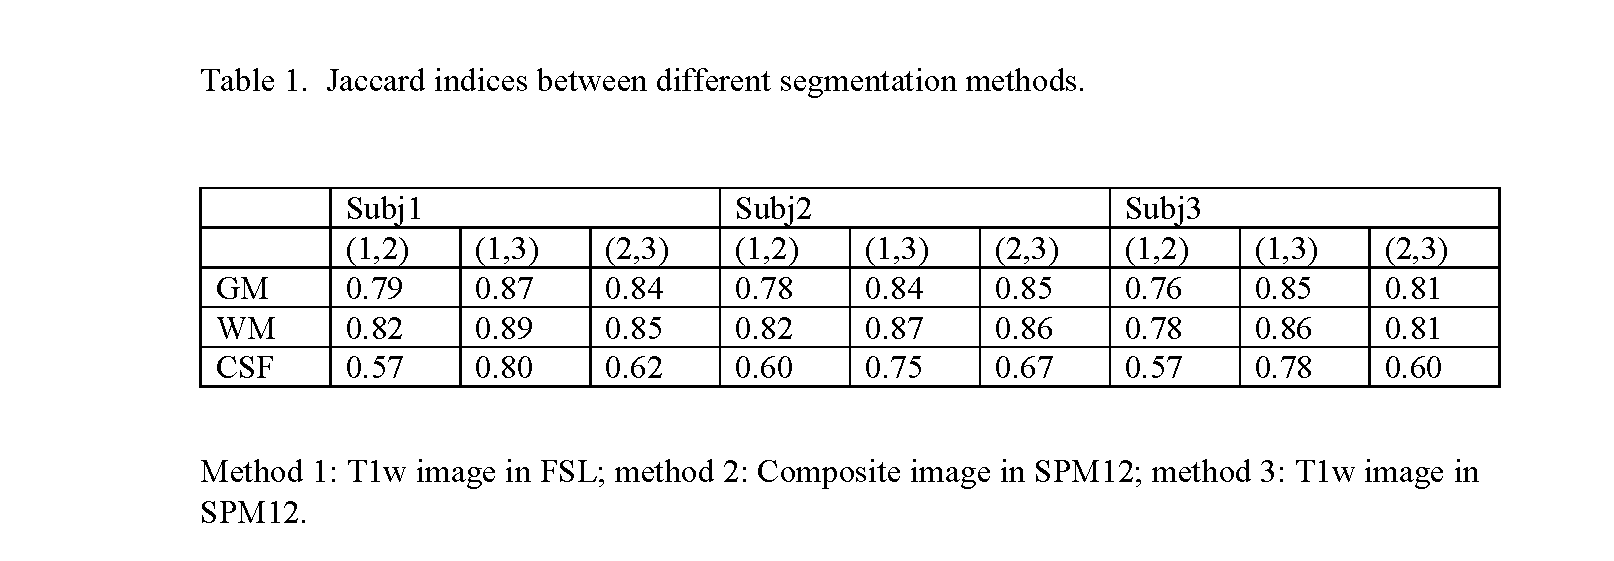
We used three subject in the Human Connectome Project (HCP) dataset to test the segmentation. Each subject has 288 DWI images with isotropic resolution of 1.25 mm and b value 0f [1000, 2000, 3000] s/mm2. We first fit the data to obtain α and β. Then we used β image to extract CSF components by applying a threshold of 1.5. The CSF component was anchored into the α image by multiplication of the CSF mask. The new image was further inverted the contrast by changing the sign and adding a constant. The new composite image is like a T1w image. The composite image was exported to SPM12 to do the segmentation. Because there is no ground truth about the segmentation, the T1w image from the HCP data that was resampled and coregistered to the DWI image was processed in SPM12 for segmentation and on FSL as well. The segmentation of the composite image is compared with the T1w based segmentation using the Jaccard index, defined as the ratio of the overlap to the union of the two images.
Results
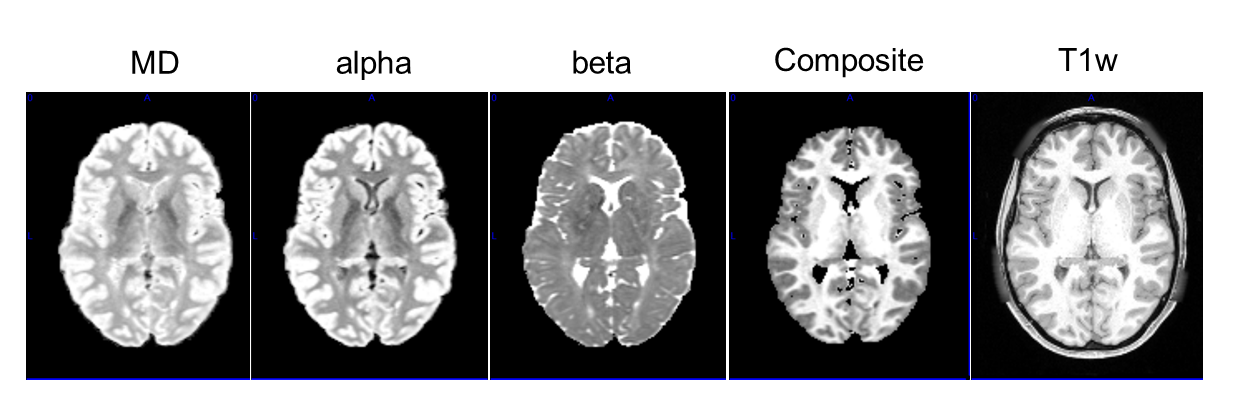
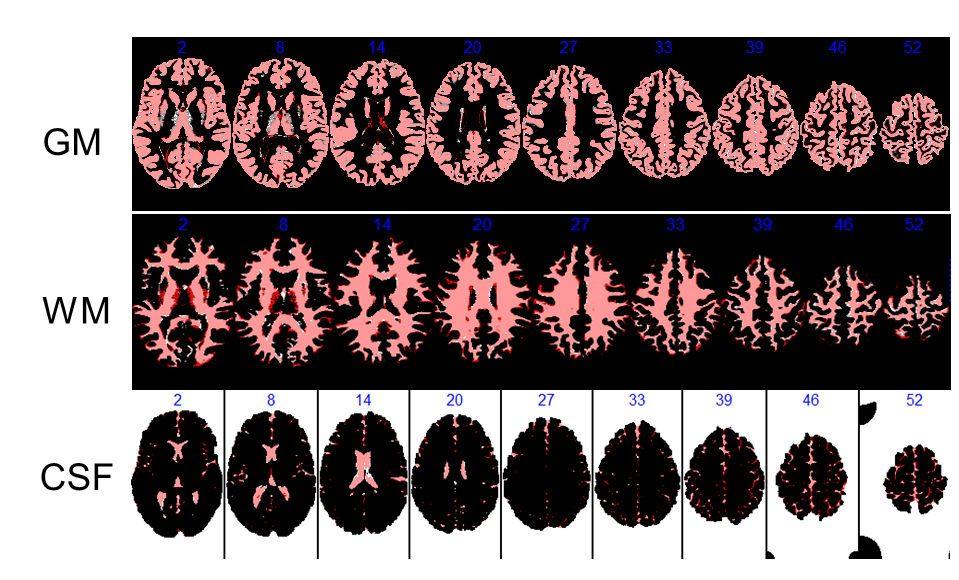
Results Fig. 1 show the image of MD, alpha, and beta, the composite image, and the T1w image. The α image showed better contrast between the gray matter (GM) and white matter (WM) as compared to the MD. The MD image shows good GM/WM contrast but the CSF has similar signal as the GM. The β image doesn’t have much contrast for GM/WM, but shows a distinct CSF component, making it very useful in extracting the CSF. The composite image looks like the T1w image. Fig. 2 compares the results of segmentation in SPM12 using the composite image and T1w image. The segmentation from the composite image is overlaid by the segmentation using the T1w image. There is some mismatch at the edge, but not on any large continuous anatomy.
The Jaccard indices between different methods are listed in Table 1. The overlap is around 0.8 for GM and WM, with WM slightly higher. Using the same algorithm of SPM12, the overlap for WM classification is nearly equal to the overlap between SPM12 and FSL.
Discussion
We have developed a novel method of classifying the three types of brain tissues based on the direction-averaged signal of the DWI images. A pseudo-T1w image can be constructed for segmentation. One advantage of this approach is that no bias field needs to be estimated. The performance is very good even without using any advanced segmentation tools. Although the results were derived from three shell DWI data, the fitting of α and β only needs two shells, making this approach very practical. Further evaluation of this method on the dependence of number of directions is needed. The beta image is exclusively sensitive to the CSF, that feature might be valuable in detecting the edema.Acknowledgements
No acknowledgement found.References
1. Smith, R. E., Tournier, J.-D., Calamante, F., & Connelly, A. (2012). Anatomically-constrained tractography: Improved diffusion MRI streamlines tractography through effective use of anatomical information. NeuroImage, 62(3), 1924–1938.
2. H. Li, T.M. Liu, G. Young, L. Guo, S.T.C. Wong. Brain tissue segmentation based on DWI/DTI data. 3rd IEEE international Symposium on BiomedicalImaging (2006), pp. 57-60.
3. Wen Y, He L, von Deneen KM, Lu Y. Brain tissue classification based on DTI using an improved fuzzy C-means algorithm with spatial constraints. Magn Reson Imaging. 2013; 31:1623-30.
4. McKinnon ET, Jensen JH, Glenn GR, Helpern JA. Dependence on b-value of the direction-averaged diffusion-weighted imaging signal in brain. Magn Reson Imaging. 2017; 36:121-127.
Figures