0471
Cross-vendor and Cross-protocol harmonisation of diffusion MRI data: a comparative study1CUBRIC, School of Psychology, Cardiff University, Cardiff, United Kingdom, 2Queen Square MS Centre, UCL Institute of Neurology, Faculty of Brain Sciences, University College London, London, United Kingdom, 3Centre for Medical Image Computing, Department of Computer Science, University College London, London, United Kingdom, 4Harvard Medical School, Boston, MA, United States, 5Image Sciences Institute, Department of Radiology, University Medical Center Utrecht and Utrecht University, Utrecht, Netherlands, 6Mint Labs Inc, Barcelona, Spain, 7Department of Radiology, University of Pennsylvania and the Children's Hospital of Philadelphia, Philadelphia, PA, United States, 8Institute of Imaging & Computer Vision, RWTH Aachen University, Aachen, Germany, 9Machine Intelligence and Perception group, Microsoft Research Cambridge, Cambridge, United Kingdom, 10New York University, New York, NY, United States
Synopsis
We present a comparison of five different methods that estimate mappings between scanners for diffusion MRI data harmonisation. The methods are evaluated on a dedicated dataset of the same subjects acquired on three distinct scanners with ‘standard’ and ‘state-of-the-art’ protocols, with the latter having higher spatial and angular resolution. Our results show that cross-vendor harmonisation and spatial/angular resolution enhancement of single-shell diffusion data sets can be performed reliably, although some challenges remain. The dataset is available upon request and can serve as a useful testbed for future method development in cross-site/cross-hardware and cross-vendor diffusion MRI harmonisation.
Introduction
MRI data harmonisation is the process of finding a mapping between data sets acquired with different scanners/protocols and making them as comparable as possible. Harmonisation has become a pressing need in the current era of “big data” and multi-center studies, as it can enable the combination of data sets from different MRI scanners1,2,3. This could dramatically increase the statistical power and sensitivity of clinical studies, with obvious benefits in clinical trials and multi-center research, and enable the transfer of rich information content from state-of-the-art acquisitions to lower quality data4, e.g. to enhance resolution.
This work reports a comparison of five different algorithms for diffusion MRI (dMRI) data harmonisation. The algorithms were trained and evaluated on a data set of 14 subjects scanned on three scanners from different vendors and with varying hardware specifications. This study presents details of the dataset which can be used for benchmarking new harmonisation algorithms, and shows the promises and shortcomings of today’s data harmonisation techniques.
Methods
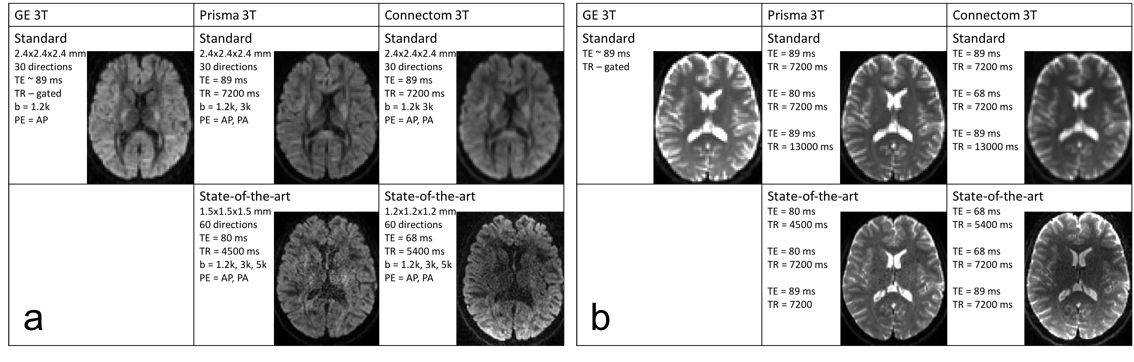
Data: 14 healthy volunteers were scanned on a 3T GE Excite-HDx, 3T Siemens Prisma, and 3T Siemens Connectom scanner. dMRI images were acquired with a ‘standard’ protocol on all three scanners, and a ‘state-of-the-art’ protocol on the latter two (Fig.1a). For the state-of-the-art protocol, we exploited multiband-acquisition and stronger gradients to shorten TE and improve the spatial- and angular resolution per unit time. Additional b=0s/mm2 images were acquired with TE and/or TR matching between protocols (Fig.1b), as well as structural MPRAGEs for each scanner. The data is available for researchers upon request.
Tasks: This work focuses on the harmonisation of the lowest b-value shell. The b=0 and 1200s/mm2 data from 10 randomly selected subjects were used as training data (all scanners/protocols). The data sets from remaining 4 subjects were used for testing, two tasks were evaluated: 1) scanner-to-scanner harmonisation, predicting the Prisma and Connectom standard data from the GE data; and 2) spatial- and angular resolution enhancement, predicting the Prisma and Connectom state-of-the-art data from the GE data.
Preprocessing: All data were corrected for motion and eddy current-distortions using EDDY5, the Prisma and Connectom data were corrected for susceptibility distortions using TOPUP6, and the Connectom data corrected for geometric distortions due to gradient nonlinearities7. The Prisma and Connectom data were registered to a common space per subject (Prisma standard) using FLIRT8, and the GE data using Elastix nonlinear registration thereby correcting for susceptibility distortions9,10.
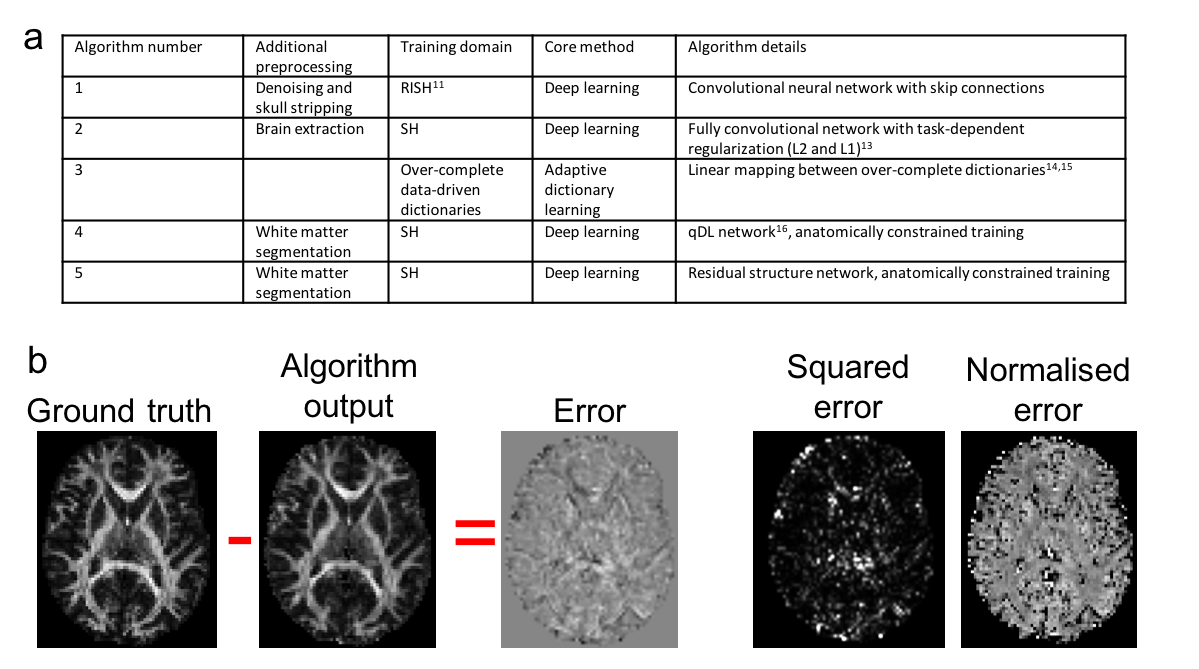
Algorithms: Five different harmonisation approaches were tested (Fig.2a), which learnt mappings between spherical harmonic (SH) coefficients or rotationally invariant SH (RISH) features11.
Evaluation: In the four test data sets, diffusion tensor imaging (DTI) and RISH features (FA, MD and R0, R2 respectively) were computed from the predicted data for each test subject and algorithm, and evaluated against the ground truth features derived from the acquired data (Fig.2b). The mean-, mean-normalised-, and mean-squared error were computed globally (in a brain mask excluding cerebellum), regionally (Freesurfer regions12) and locally (3x3x3 voxels neighborhood).
Results
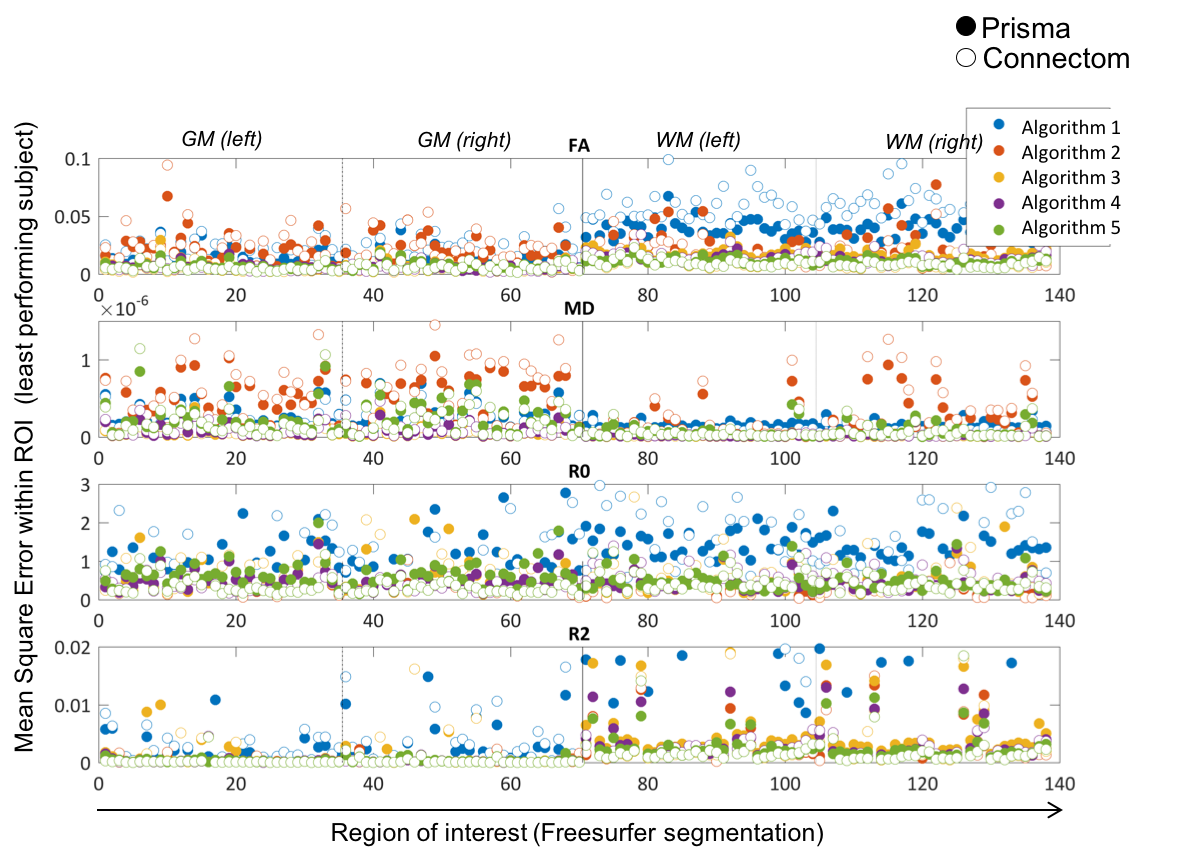
1) Scanner-to-scanner harmonisation: Fig.3 shows the mean-squared error for different Freesurfer regions and different algorithms. Some ROIs have a consistent higher error (e.g. Cingulum), but no systematic trends in the prefrontal cortex were found, where differences in susceptibility correction strategies could affect the result.
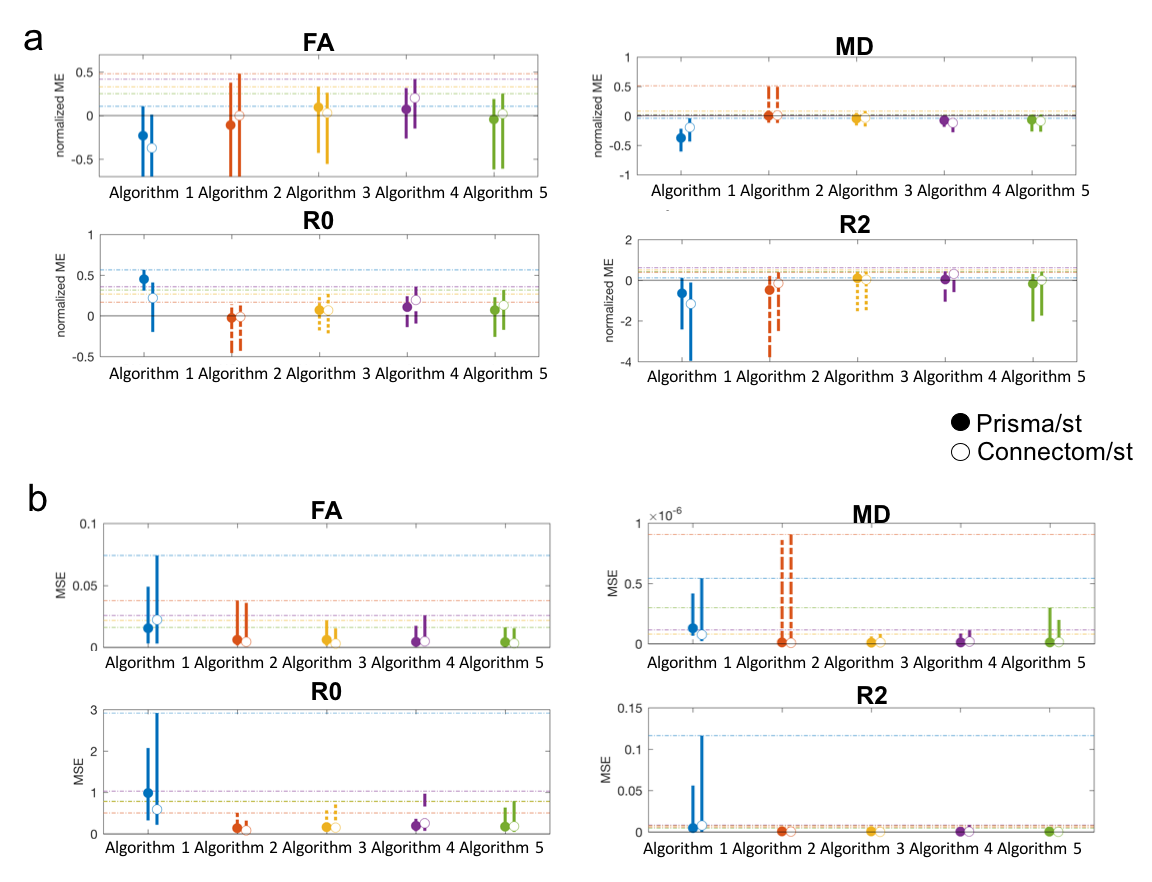
Distributions of the localised errors were computed across all 4 subjects, Fig.4 shows the median and width (95th percentile) of the a) mean-normalised- and b) mean-squared error. For each metric at least one algorithm has a mean-normalised error below 5%. Algorithms 3 and 5 consistently show the best performance.
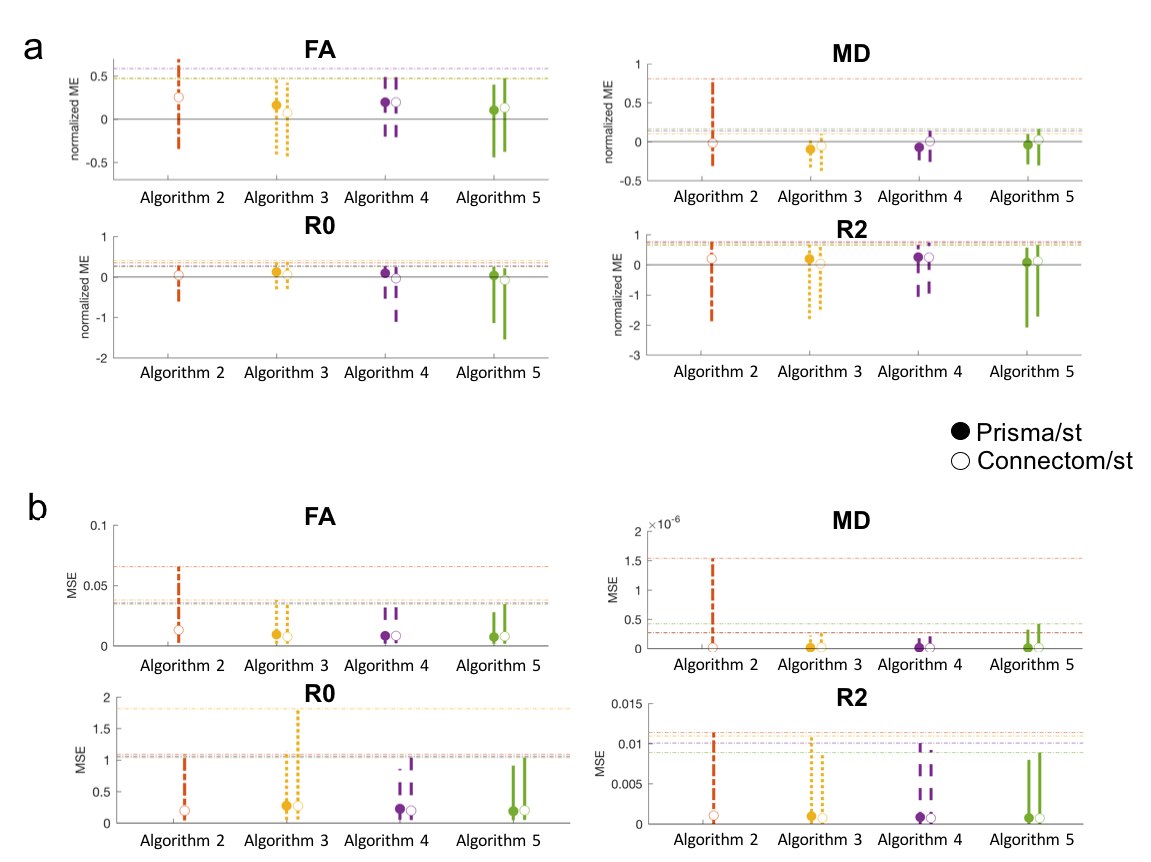
2) Spatial- and angular resolution enhancement: Fig.5 shows the median and width of the localised-error distributions. Again both errors vary strongly across metrics. For each metric at least one algorithm has a mean-normalised error lower than 10%, indicating a lower accuracy for this task. The Connectom predictions have overall higher accuracy. Algorithms 4 and 5 consistently show the best performance.
Discussion & Conclusion
We present a comparison of dMRI harmonisation methods that estimate mappings between scanners. The methods rely on deep learning and dictionary learning, are commonly based on SH signal representations, and are capable of harmonising dMRI data to a satisfactory level.
The tested algorithms provide higher accuracy for the scanner-to-scanner harmonisation than for the enhancement task, with the predicted Connectom data having better scores. Considering potential limitations, the lack of reverse phase-encoding acquisitions for susceptibility distortion correction in the GE data may have negatively affected co-registration, and thus reduced algorithm-performance in some ROIs. This could be a general issue for harmonisation of data acquired with different protocols, and is the subject of future work.
Acknowledgements
CMWT is supported by a Rubicon grant (680-50-1527) from the Netherlands Organisation for Scientific Research (NWO) and Wellcome Trust grant (096646/Z/11/Z). FG acknowledges Horizon2020-EU.3.1 (ref.: 634541); Engineering and Physical Sciences Research Council (EPSRC: ref.: EP/M020533/1). SSJ is supported by the Fonds de recherche du Québec – Nature et technologies (FRQNT). AL ans SSJ are supported by VIDI Grant 639.072.411 from the Netherlands Organisation for Scientific Research (NWO). RT acknowledges funding from Microsoft Research. DCA and AG acknowledge funding from EPSRC grants N018702 M020533 L022680. DEJL and DKJ were supported by MRC grant MR/K004360/1. The work was supported by a Wellcome Trust Investigator Award (096646/Z/11/Z) and a Wellcome Trust Strategic Award (104943/Z/14/Z). The data were acquired at the UK National Facility for In Vivo MR Imaging of Human Tissue Microstructure funded by the EPSRC (grant EP/M029778/1), and The Wolfson Foundation.References
[1] Mirzaalian et al., NeuroImage 135:311-23,2016
[2] Mirzaalian et al., Brain Imaging Behav. doi: 10.1007/s11682-016-9670-y,2017
[3] Fortin et al., NeuroImage 161:149-170,2017;
[4] Alexander et al., NeuroImage 152:283-298,2017
[5] Andersson and Sotiropoulos,NeuroImage 125:1063-1078,2016
[6] Andersson et al.,NeuroImage 20(2):870-888,2003
[7] Glasser et al.,Neuroimage 80:105–124,2013
[8] Jenkinson et al.,NeuroImage 17(2),825-841,2002
[9] Klein et al.,IEEE TMI 29(1),196-205 2010
[10] Irfanoglu et al.,Neuroimage 61(1),275-288,2012
[11] Mirzaalian et al., Med Image Comput Comput Assist Interv. 9349:12-19,2015
[12] Fischl, et al. Neuron 33, 341-355,2002
[13] Shi W et al. arXiv:1609.05158
[14] St-Jean S, et al., Medical Image Analysis 2016; 32: 115-130.
[15] Glasner, D. et al., IEEE ICCV 2009; 349-356.
[16] Golkov V, et al., IEEE Trans Med Imaging 2016; 35(5): 1344-1351.
Figures