0469
Longitudinal multi-component HARDI atlas of neonatal white matter1Centre for the Developing Brain, School of Bioengineering and Imaging Sciences, King's College London, London, United Kingdom, 2Department of Biomedical Engineering, School of Bioengineering and Imaging Sciences, King's College London, London, United Kingdom
Synopsis
We describe a method for creating a longitudinal atlas of developing white matter (WM) of neonates using the multi-shell multi-tissue constrained spherical deconvolution technique and multi-contrast registration on high-quality high angular resolution diffusion imaging (HARDI) data. We present an atlas that consists of one isotropic and two orientationally-resolved components. The atlas reveals
Introduction
Diffusion MRI (dMRI) is uniquely sensitive to the microstructural properties of brain tissue. This is of particular interest during the neonatal period as brain parenchyma undergoes rapid changes in cell composition, density, and water content.
Here, we process dMRI data acquired as part of the developing Human Connectome Project (www.developingconnectome.org/) using multi-tissue constrained spherical deconvolution (MSMT-CSD)1, explore the b-value dependence of gray matter (GM) and white matter (WM) diffusion signal properties over the subject age range, and develop a parsimonious representation that captures the maturation of WM over the neonatal period in an interpretable way.
Methods & Results
Data and cohort
Multi-shell dMRI data were acquired in 300 volumes at b = 0, 400, 1000 and 2600 s/mm2 (with n=20, 64, 88 & 128 directions respectively)2–4, reconstructed to 1.5mm resolution. The cohort consists of 113 normal-appearing, lesion-negative babies with postmenstrual age (PMA) between 32.4 and 44.6 weeks, grouped into 12 weekly cohorts containing 9 to 11 subjects each.
Data pre-processing consists of:
- removal of motion-corrupted volumes using a deep neural network classifier5
- Marchenko-Pastur-PCA-based denoising6
- susceptibility and eddy-current distortion correction and inter-volume motion correction with outlier replacement using FSL topup7 and eddy8
- bias field correction based on the b=0 shell using N49.
Brain masks were generated using a combination of FSL bet10 and a custom-built threshold-based segmentation.
Two- and three-component decompositions
MSMT-CSD was used to decompose the dMRI images into multiple orientationally-resolved components. This requires tissue-specific signal signatures (aka “response functions”, RFs) capturing their distinct b-value and angular dependences.
In contrast to adults, WM and GM in neonates exhibit similar mean diffusion signal properties across b-values but WM exhibits a relatively large spatial and age-dependent variability (figure 1a-c). WM RFs were estimated within manually corrected single-fibre voxel masks11 and cerebrospinal fluid (CSF) RFs were derived from dilated brain masks12. Both types of voxel masks showed no spatial age-bias.
For each subject, we performed an initial decomposition into an isotropic (Isos) and an anisotropic (As) component using the subject-specific CSF and WM RFs. We then performed a more detailed decomposition into one isotropic (Iso) and two orientationally-resolved components (Ay, Ao) using the cohort-average CSF RF and the normalised average WM RFs within the youngest (32.9 weeks PMA, subscript “y”) and oldest (44.1 weeks PMA, subscript “o”) groups respectively.
Finally, the components of each decomposition were jointly bias field corrected and intensity-normalised13.
Registration and group average template creation
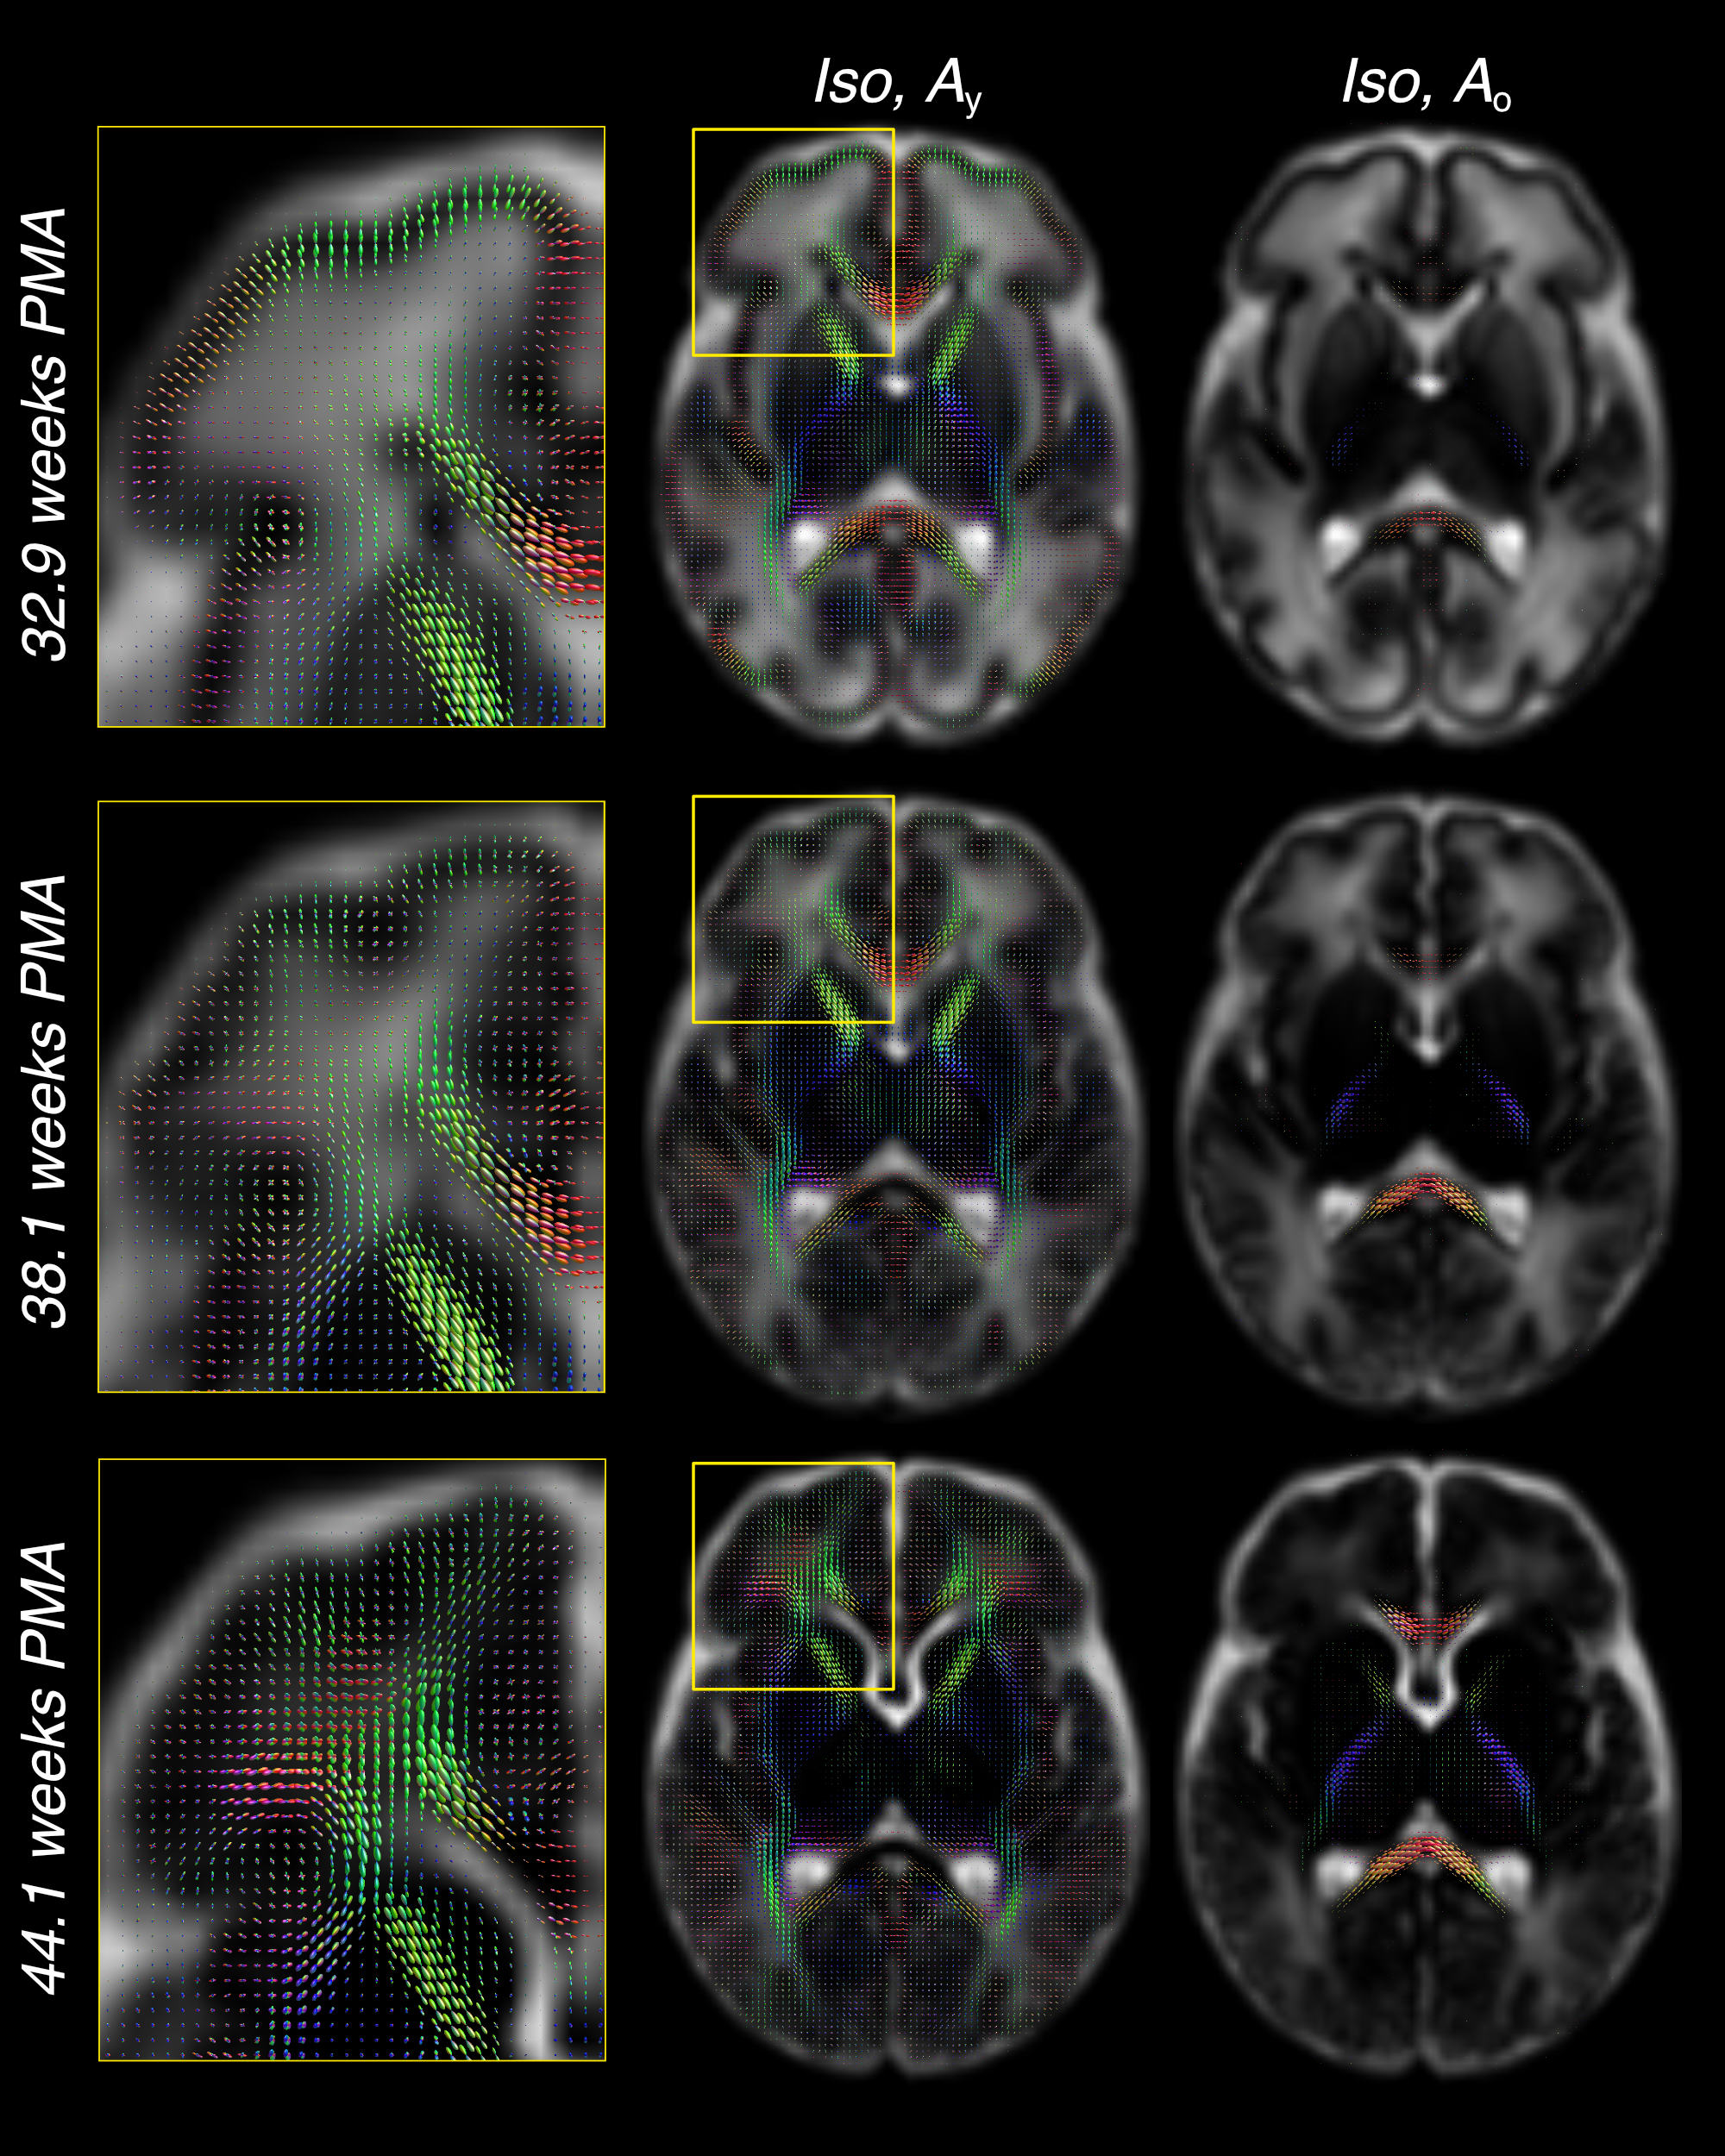
Group averages were created for the whole cohort and at weekly intervals from 33 to 44 weeks gestation using the initial two-tissue decompositions to drive the registration since the two WM components in the subsequent decomposition vary markedly with age in ways that could bias the alignment (Figure 2).
Templates were created by iterative registration and averaging with increasing spatial (3.3mm to 1mm) and angular resolution (lmax=0,2,4) using a non-linear diffeomorphic registration framework14 that takes the reorientation of orientation distribution functions into account. The respective Isos and As components were registered simultaneously and with equal weights15 to the group average excluding the current image.
The resulting transformations were used to create two atlases of the three-tissue decompositions: one with weekly templates rigidly aligned, and one where all images were nonlinearly aligned to a common space but split into weekly templates.
Discussion
Temporal evolution of the WM response function
As shown in figure 1c, the WM RF transitions smoothly between the age extremes of the cohort. The individual WM RFs are well approximated as a non-negative sum of the RFs of the two age extremes (figure 1d,e). This allows modelling this shift as a change in volume fractions between Ay and Ao.
Longitudinal group-level observations
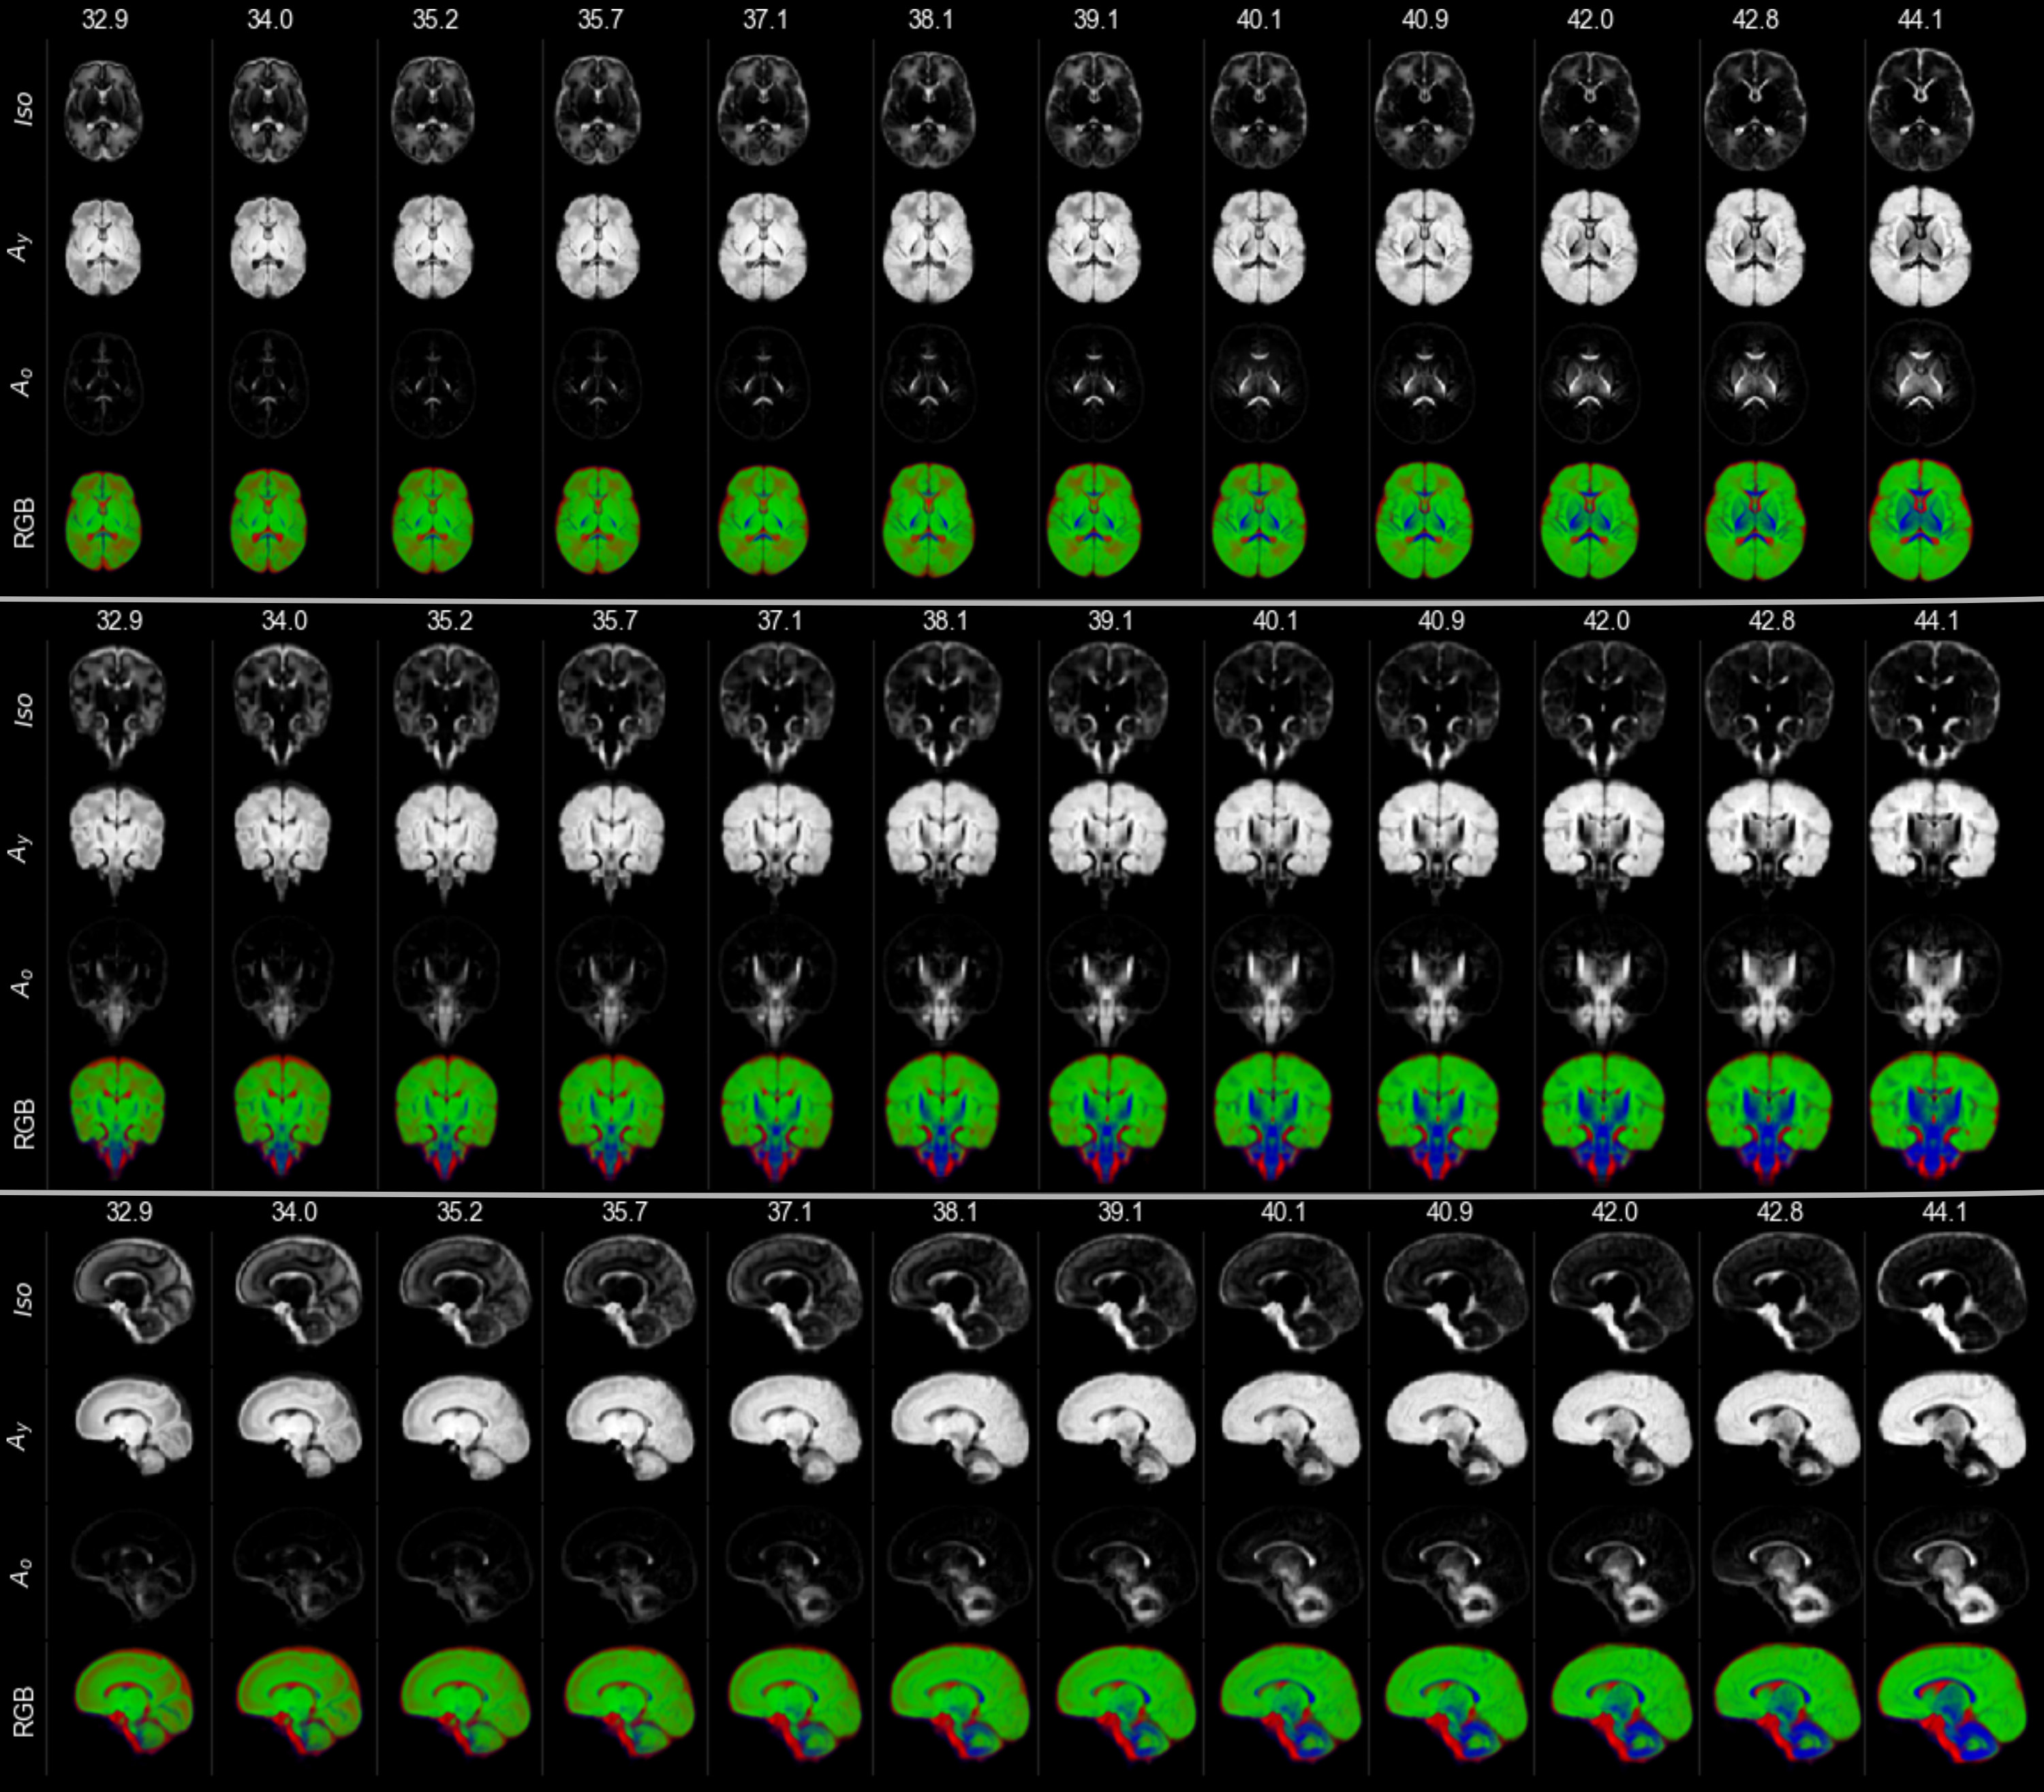
Figure 3 shows the decreasing Iso content and the transition from Ay to Ao with increasing age, matching the expected decrease in overall water content and the timeline of maturation from central to peripheral, caudal to cranial and posterior to anterior. Cortical GM is primarily captured by Ay and shows the expected decrease in anisotropy as cortical arborisation proceeds (figure 3).
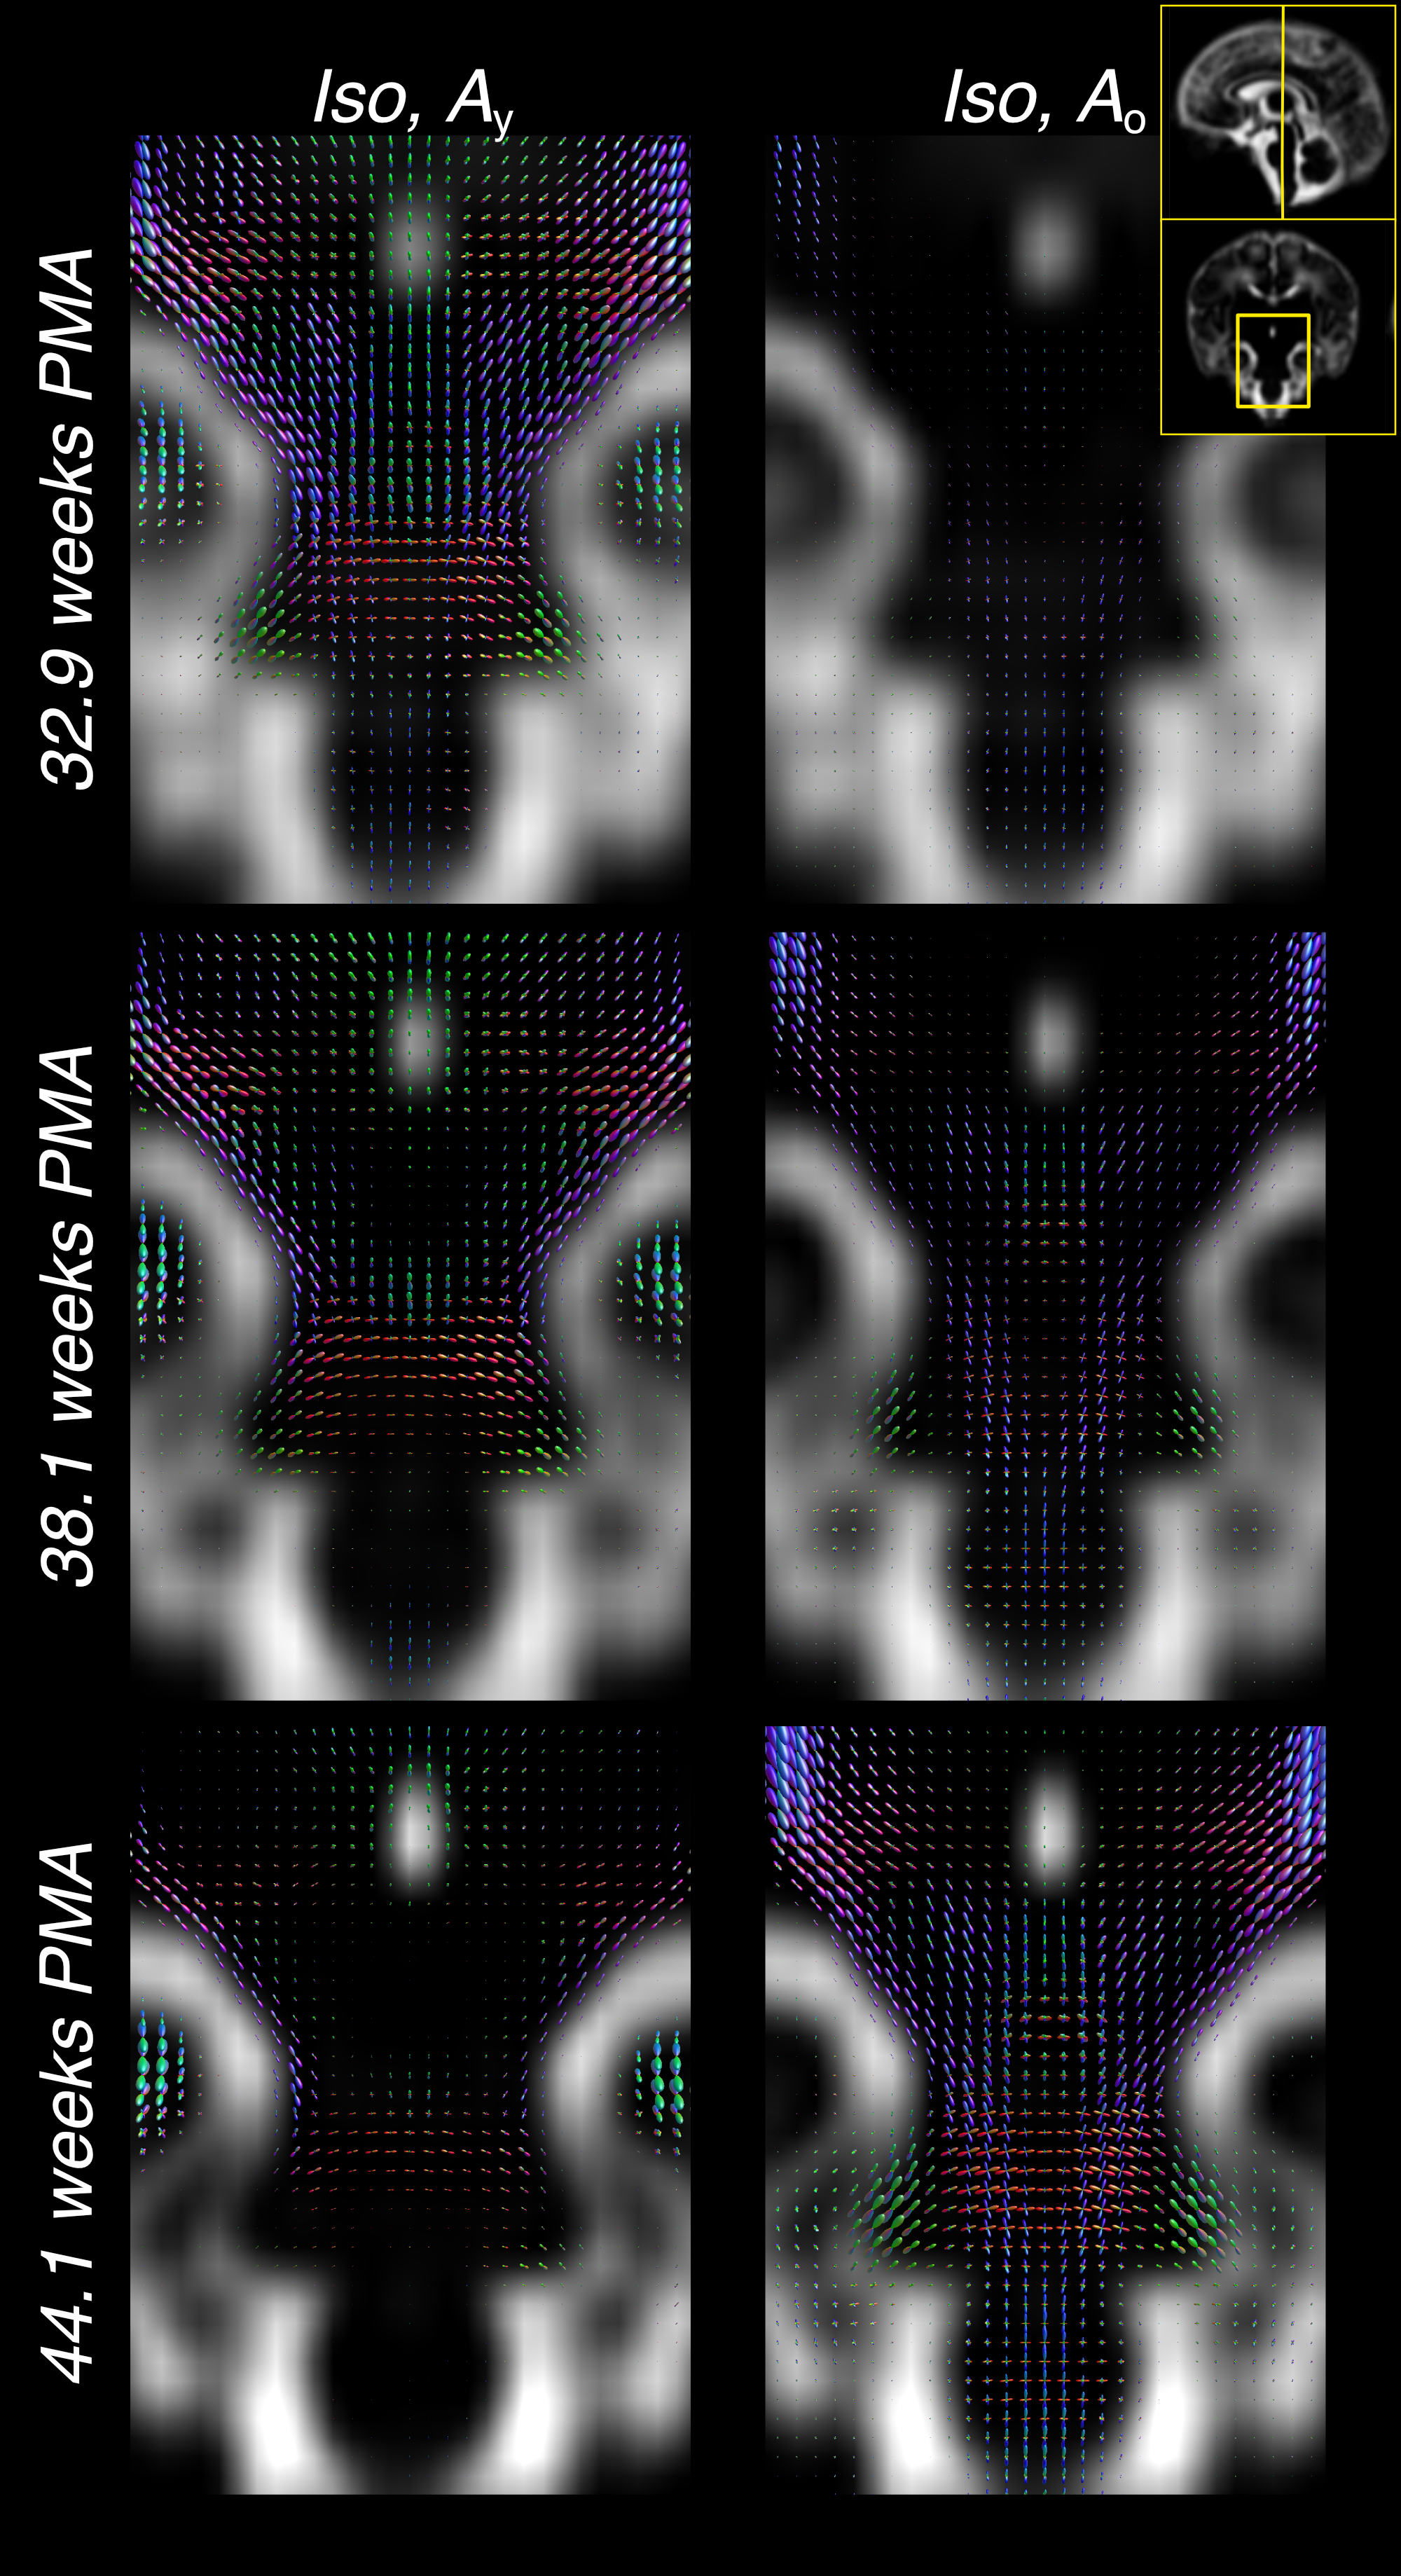
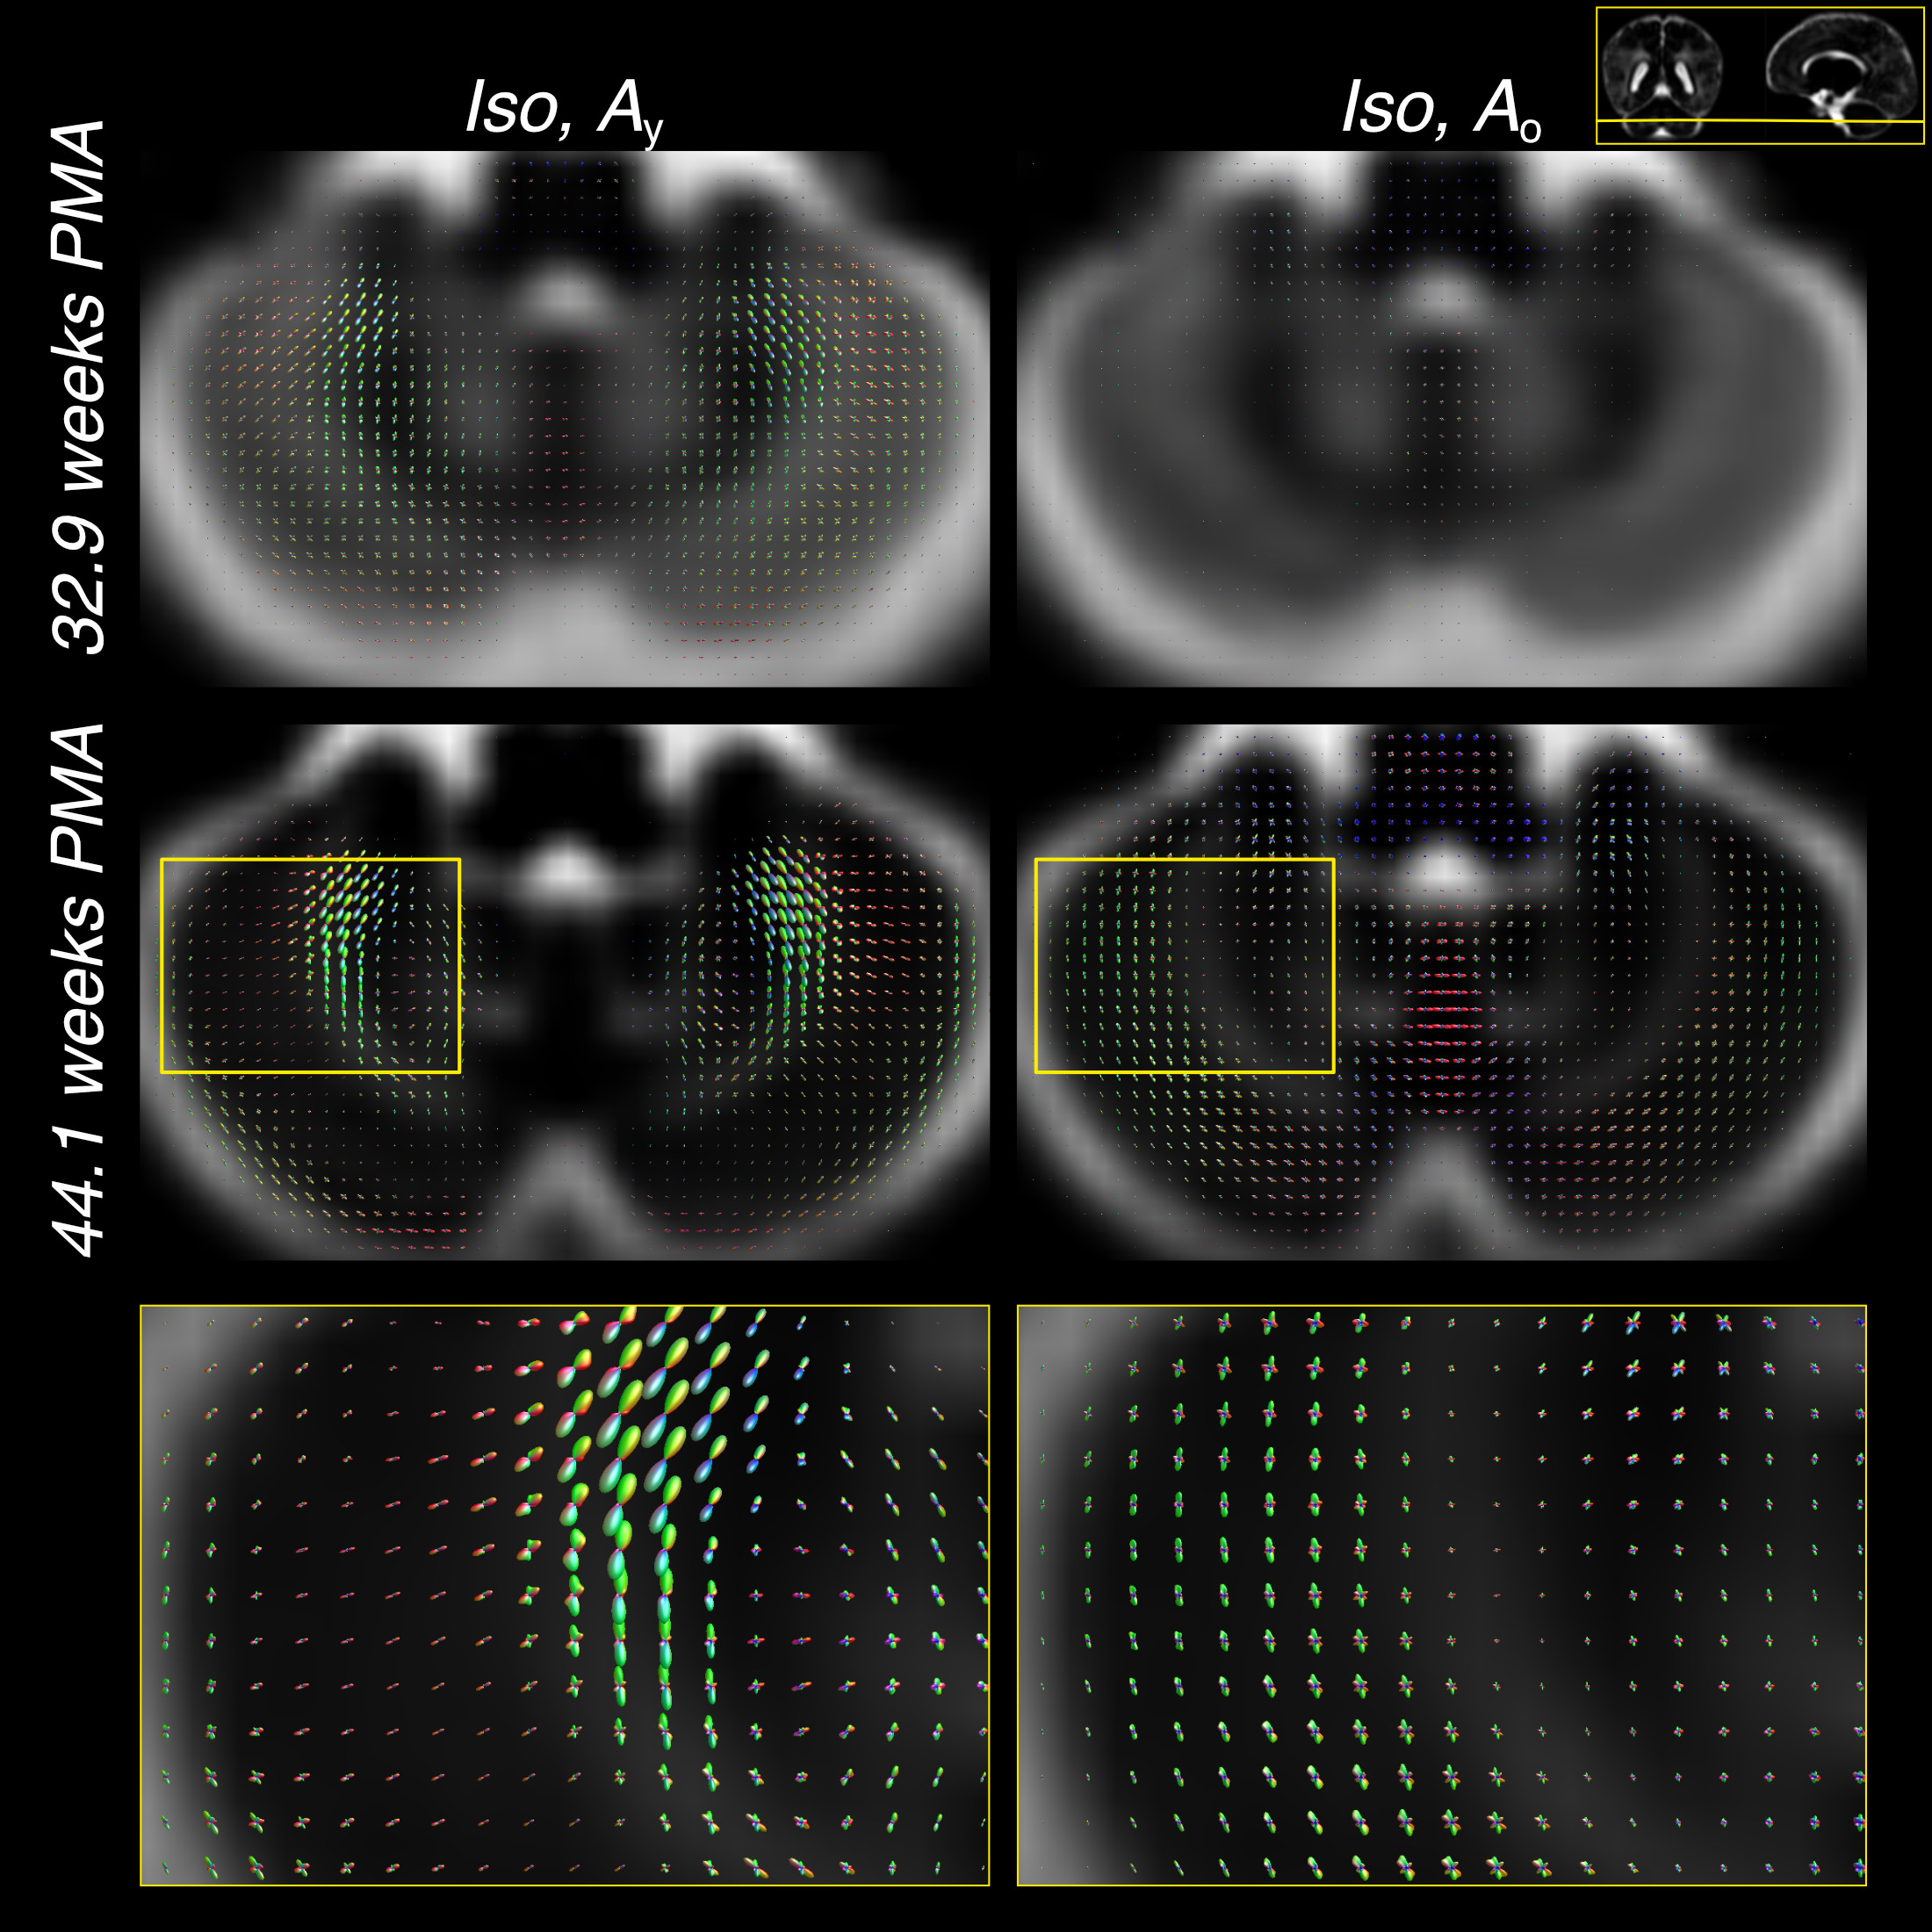
Furthermore, the comparatively large difference in WM RFs between the age extremes facilitates the characterisation of fibre-specific maturation patterns even within single voxels. This is illustrated for the brainstem in figures 4 and 5, demonstrating fibre-specific maturation patterns in cerebellar GM, in line with previous observations of age-dependent radial and tangential cerebellar pathways16.
Conclusion
The presented technique yields longitudinal fibre-resolved maps of neonatal WM and allows investigations into healthy and pathological changes in WM in the neonatal period.Acknowledgements
This work received funding from the European Research Council under the European Union’s Seventh Framework Programme (FP7/20072013)/ERC grant agreement no. [319456] (dHCP project), and was supported by the Wellcome EPSRC Centre for Medical Engineering at Kings College London [WT 203148/Z/16/Z], MRC strategic grant [MR/K006355/1] and by the National Institute for Health Research (NIHR) Biomedical Research Centre based at Guy’s and St Thomas’ NHS Foundation Trust and King’s College London. The views expressed are those of the authors and not necessarily those of the NHS, the NIHR or the Department of Health.References
1. Jeurissen, B., Tournier, J.-D.D., Dhollander, T., Connelly, A., and Sijbers, J. (2014). Multi-tissue constrained spherical deconvolution for improved analysis of multi-shell diffusion MRI data. Neuroimage 103, 411–426.
2. Hutter, J., Tournier, J.D., Price, A.N., Cordero-Grande, L., Hughes, E.J., Malik, S., Steinweg, J., Bastiani, M., Sotiropoulos, S.N., Jbabdi, S., et al. (2017). Time-efficient and flexible design of optimized multishell HARDI diffusion. Magn. Reson. Med. Available at: http://dx.doi.org/10.1002/mrm.26765.
3. Hughes, E.J., Winchman, T., Padormo, F., Teixeira, R., Wurie, J., Sharma, M., Fox, M., Hutter, J., Cordero-Grande, L., Price, A.N., et al. (2017). A dedicated neonatal brain imaging system. Magn. Reson. Med. 78, 794–804.
4. Tournier, J.-D., Hughes, E., Tusor, N., Sotiropoulos, S.N., Jbabdi, S., Andersson, J., Rueckert, D., Edwards, A.D., and Hajnal, J.V. (2015). Data-driven optimisation of multi-shell HARDI. In Proc. Intl. Soc. Mag. Reson. Med. Available at: http://dev.ismrm.org/2015/2897.html.
5. Kelly, C., Pietsch, M., Counsell, S., and Tournier, J.-D. (2017). Transfer learning and convolutional neural net fusion for motion artefact detection. In Proc. Intl. Soc. Mag. Reson. Med., p. 3523.
6. Veraart, J., Novikov, D.S., Christiaens, D., Ades-Aron, B., Sijbers, J., and Fieremans, E. (2016). Denoising of diffusion MRI using random matrix theory. Neuroimage 142, 394–406.
7. Andersson, J.L.R., Skare, S., and Ashburner, J. (2003). How to correct susceptibility distortions in spin-echo echo-planar images: application to diffusion tensor imaging. Neuroimage 20, 870–888.
8. Andersson, J.L.R., and Sotiropoulos, S.N. (2016). An integrated approach to correction for off-resonance effects and subject movement in diffusion MR imaging. Neuroimage 125, 1063–1078.
9. Tustison, N.J., Avants, B.B., Cook, P.A., Zheng, Y., Egan, A., Yushkevich, P.A., and Gee, J.C. (2010). N4ITK: improved N3 bias correction. IEEE Trans. Med. Imaging 29, 1310–1320.
10. Smith, S.M. (2002). Fast robust automated brain extraction. Hum. Brain Mapp. 17, 143–155.
11. Tournier, J.-D., Calamante, F., and Connelly, A. (2013). Determination of the appropriate b value and number of gradient directions for high-angular-resolution diffusion-weighted imaging. NMR Biomed. 26, 1775–1786.
12. Dhollander, T., Raffelt, D., and Connelly, A. (2016). Unsupervised 3-tissue response function estimation from single-shell or multi-shell diffusion MR data without a co-registered T1 image. In Proc ISMRM Workshop on Breaking the Barriers of Diffusion MRI.
13. Raffelt, D., Dhollander, T., Tournier, J.-D., Tabbara, R., Smith, R.E., Pierre, E., and Connelly, A. (2017). Bias Field Correction and Intensity Normalisation for Quantitative Analysis of Apparent Fibre Density. In Proc. Intl. Soc. Mag. Reson. Med., p. 3541.
14. Raffelt, D., Tournier, J.-D., Fripp, J., Crozier, S., Connelly, A., and Salvado, O. (2011). Symmetric diffeomorphic registration of fibre orientation distributions. Neuroimage 56, 1171–1180.
15. Pietsch, M., Raffelt, D., Dhollander, T., and Tournier, J.-D. (2017). Multi-contrast diffeomorphic non-linear registration of orientation density functions. In Proc. Intl. Soc. Mag. Reson. Med. Available at: http://dev.ismrm.org/2017/3522.html.
16. Takahashi, E., Hayashi, E., Schmahmann, J.D., and Ellen Grant, P. (2014). Development of cerebellar connectivity in human fetal brains revealed by high angular resolution diffusion tractography. Neuroimage 96, 326–333.
Figures
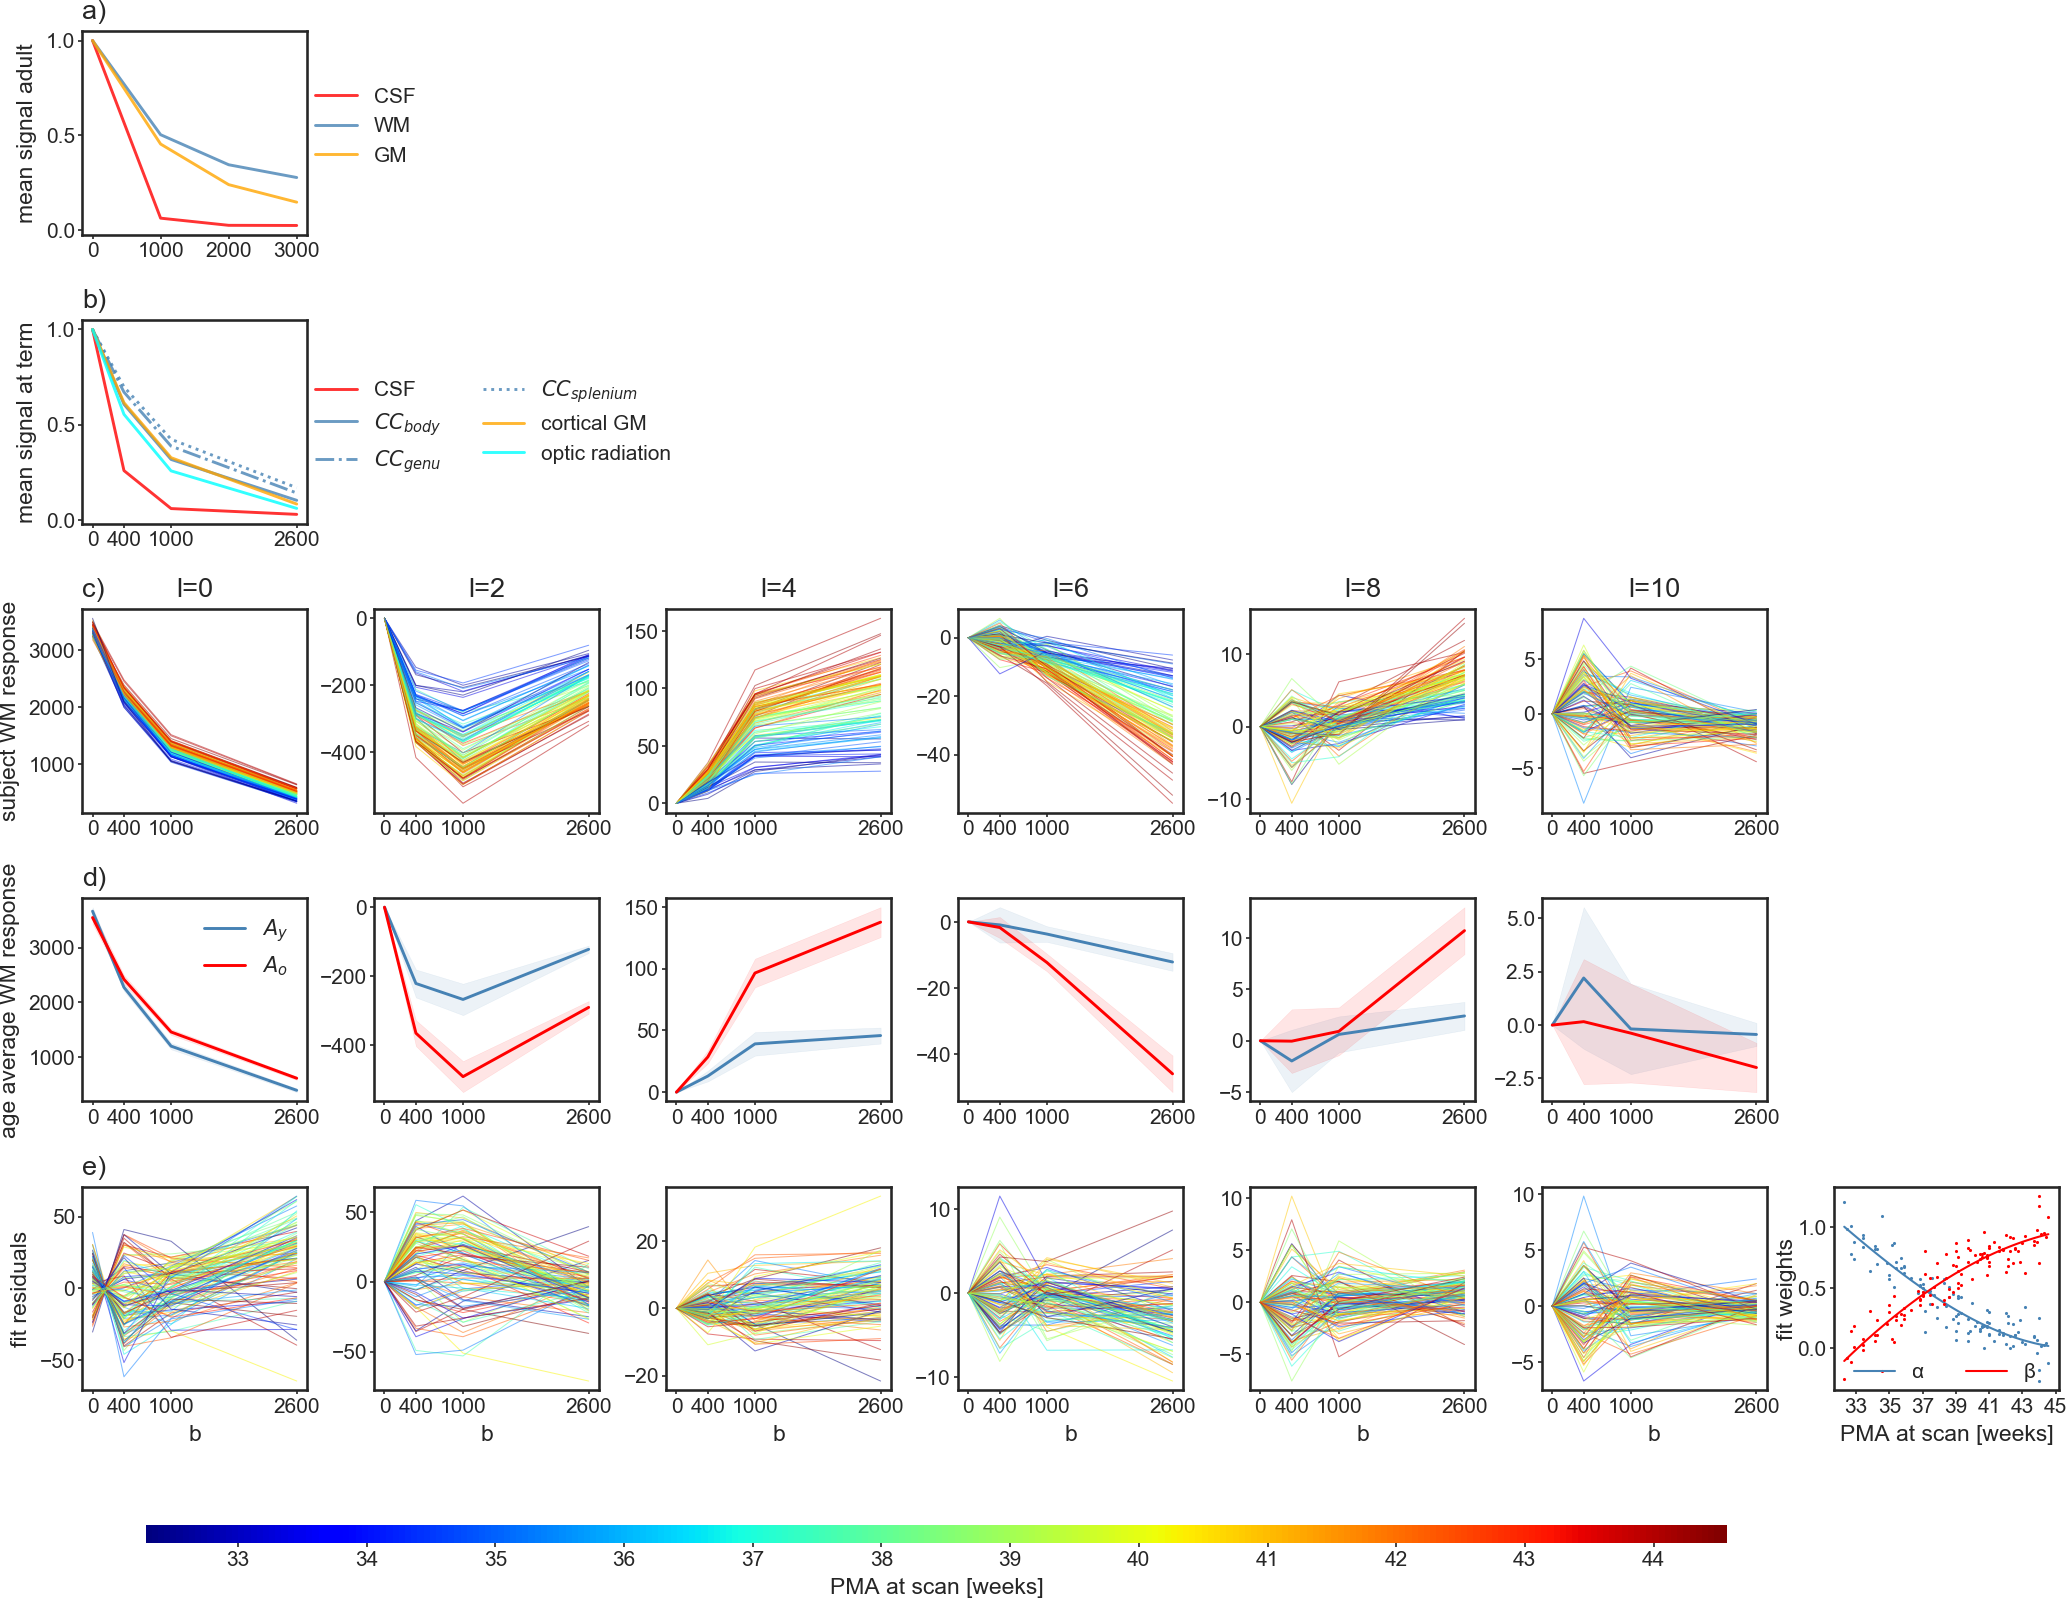
Figure 1: Mean signal in selected ROIs in adults a) and neonates at term equivalent age b) normalised to the b=0 signal. In neonates, the variability within the WM exceeds the difference between WM and GM. c): spherical harmonic coefficients of the WM RFs across the age range colour coded by postmenstrual age (PMA); d): average coefficients (and one standard deviation) of the youngest (Ay) and oldest group (Ao); e): the residuals of the linear model $$\arg \min_{\alpha,\beta} (\alpha A_y + \beta A_o − \text{WM}(t))^2$$ for each RF WM(t), with the fitted weights shown on the right-most panel.