0468
Influence of the lipids on the quantification of IVIM parameters in the vertebral bone marrow.1LTSI, INSERM UMR 1099, Rennes, France, 2Centre Eugène Marquis, CRLCC, Rennes, France, 3Department of Imaging, Rennes University Hospital, Rennes, France
Synopsis
The aim of this study was to assess the effect of the lipids on the quantification of IVIM parameters in the vertebral bone marrow. Diffusion sequences were acquired with and without fat suppression on healthy volunteers. The results of our study show that fat is a confounding factor for the quantification of the diffusion coefficient and perfusion fraction; whereas it has no significant effect on the quantification of the pseudo-diffusion coefficient.
Introduction
Over the past two years, bone marrow has become a new target tissue for IVIM imaging1-6. Bone marrow is a unique tissue as it contains water and lipids in almost equivalent proportions: thus, the MR signals of water and lipids are superimposed in a voxel of bone marrow. The aim of this study was to investigate the effect of lipids on the quantification of IVIM parameters (diffusion coefficient D, pseudo-diffusion coefficient D* and perfusion fraction f) in the vertebral bone marrow and to compare different fat suppression modules.Methods
MR imaging: The lumbar spines of 6 healthy volunteers (24.2±4.3 years, 3 women and 3 men) were scanned on a 1.5T scanner (MAGNETOM Aera, Siemens Healthcare, Erlangen, Germany) using the RESOLVE7 diffusion-weighted sequence with TR/TE 2400/58, FOV 400x400mm², matrix 188x188, 10 slices of 6mm, iPAT 3, 3 segments in the readout direction, 2 averages, b-values=[0,50,100,150,400,800,1000 s/mm²] and an acquisition time of 4:41min. For each volunteer, four sagittal RESOLVE sequences were acquired: one without fat suppression and the other three with the different fat suppression modules provided by the system vendor: FS (Fat Saturation), SPAIR (Spectral Attenuated Inversion Recovery) and STIR (Short Tau Inversion Recovery). An additional sagittal VIBE-Dixon sequence was acquired to quantify the mean fat fraction over the five lumbar vertebrae (L1 to L5) for each volunteer, using the vendor provided software.
Data analysis: First, we evaluated the effect of fat suppression on the signal intensities of bone marrow, fat and muscle. ROIs were drawn in the lumbar vertebrae L1 to L5, in the subcutaneous fat, in the paravertebral muscle and in the intervertebral discs. The relative signal intensities of bone marrow, fat and muscle were measured for each RESOLVE sequence using the signal in the intervertebral disc as a reference, since there is no signal originating from the lipids in this tissue. Secondly, D, D* and f were quantified in L1 to L5 by fitting ROI-averaged signal intensities to the IVIM bi-exponential function, for each RESOLVE sequence.
Statistical analysis: The IVIM parameters measured over the population for each RESOLVE sequence were compared using ANOVA followed by Bonferroni’s multiple comparison test (statistical significance set at 5%).
Results
An example of MR images obtained on one volunteer is presented Figure 1. The relative signal of fat was reduced when a fat suppression module was applied, as expected, whereas the relative signal of the muscle was only little affected (Table 1). The relative signal of bone marrow was reduced by the same ratio whatever the fat suppression module. The effect of fat suppression on bone marrow signal intensity was therefore comparable for the three modules.
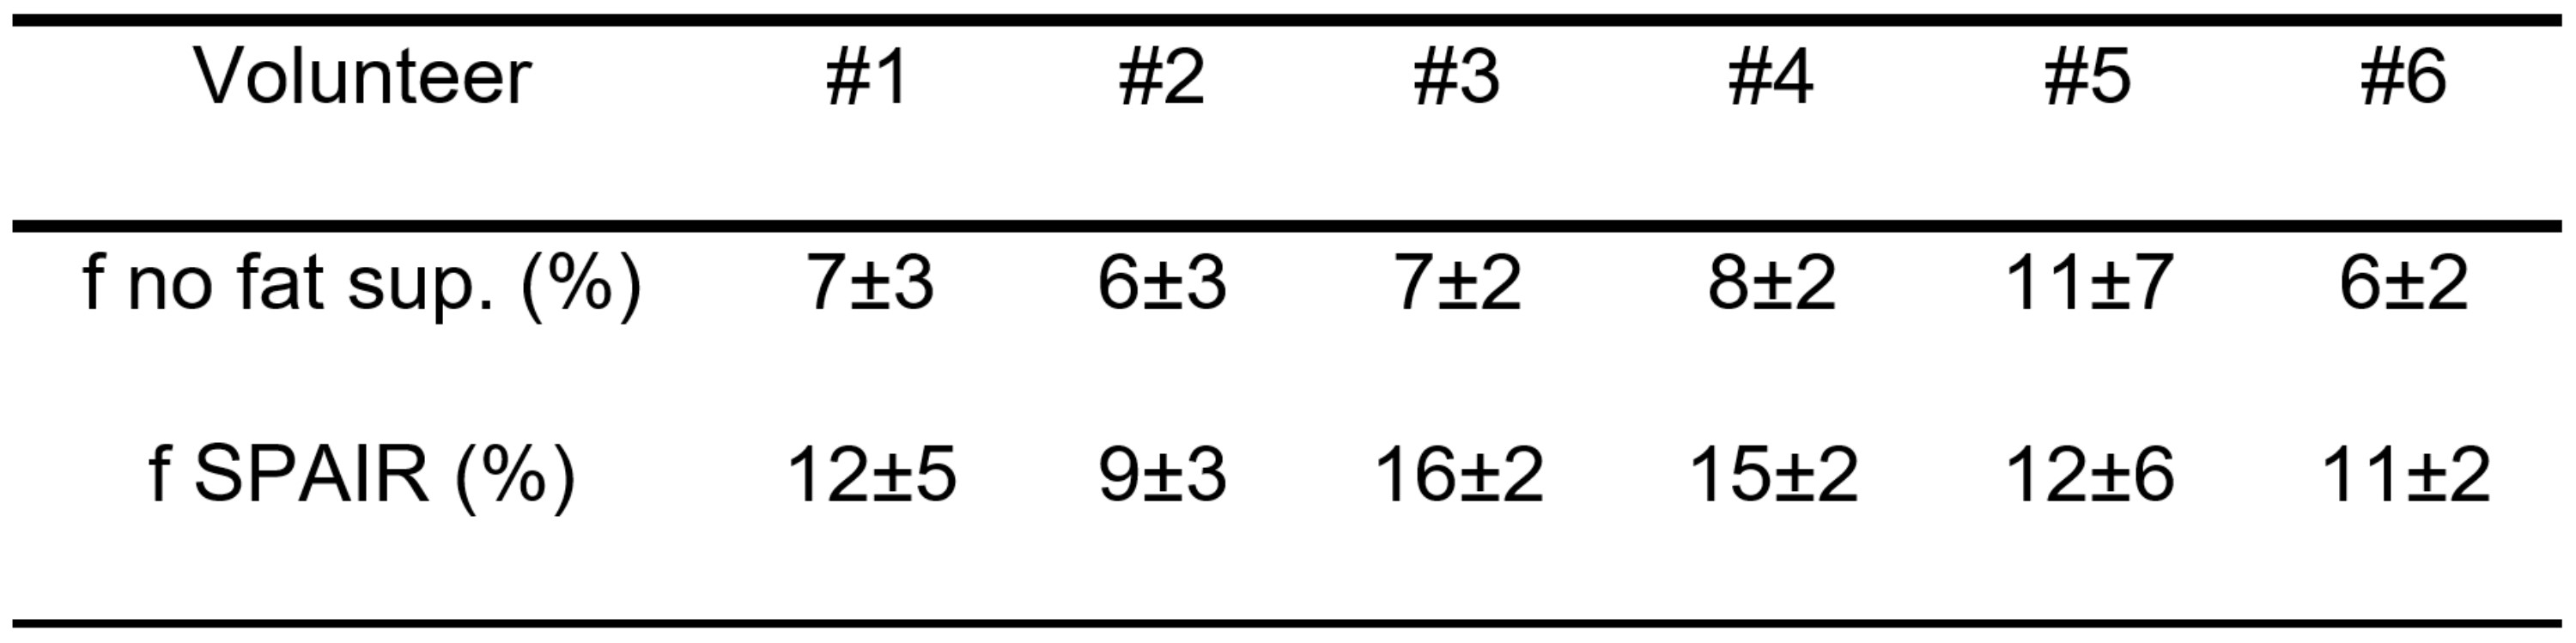
An example of IVIM signal decay obtained with and without fat suppression is illustrated Figure 2. The contribution of the lipid signal to the total signal appears clearly and the initial slope (proportional to fD*) is smaller for the DW sequences acquired without fat suppression. This is in line with the results of the quantitative analysis (Figure 3): D was significantly lower in sequences acquired without fat suppression than in FS and SPAIR sequences (p<0.01). f was significantly lower in sequences acquired without fat suppression than in FS (p<0.05) and STIR (p<0.01) sequences. This phenomenon is illustrated Table 2: for each volunteer, f was decreased when there was no fat suppression. D* showed no significant differences between sequences acquired with and without fat suppression (p=0.36 for the ANOVA). The values of D, D* and f were similar in the sequences acquired with FS, SPAIR and STIR (p>0.05).
Discussion
In bone marrow, the MR signal is equal to the sum of water and lipid signals: the presence of the lipid signal leads to an overestimation of the DW signal. In the IVIM model, the perfusion fraction is equal to the ratio between the MR signal of water flowing through the capillaries and the total MR signal in the voxel8. The presence of the lipid signal therefore affects the perfusion fraction quantification. The lipid signal also leads to an underestimation of the diffusion coefficient as the diffusion coefficient of fat superimposes to that of water9-10.Conclusion
Fat is a confounding factor not only for the quantification of the diffusion coefficient, but also for the perfusion fraction quantification; on the other hand, it has no significant effect on the quantification of the pseudo-diffusion coefficient.Acknowledgements
No acknowledgement found.References
1. Marchand AJ, Hitti E, Monge F, et al.. MRI quantification of diffusion and perfusion in bone marrow by intravoxel incoherent motion (IVIM) and non-negative least square (NNLS) analysis. Magn Reson Imaging. 2014;32(9):1091-1096.
2. Bourillon C, Rahmouni A, Lin C, et al. Intravoxel Incoherent Motion Diffusion-weighted Imaging of Multiple Myeloma Lesions: Correlation with Whole-Body Dynamic Contrast Agent–enhanced MR Imaging. Radiology. 2015;277(3):773-783.
3. Baik JS, Jung JY, Jee WH, et al. Differentiation of focal indeterminate marrow abnormalities with multiparametric MRI. J Magn Reson Imaging. 2017;46(1):49-60.
4. Niu J, Li W, Wang H, et al. Intravoxel incoherent motion diffusion‐weighted imaging of bone marrow in patients with acute myeloid leukemia: a pilot study of prognostic value. J Magn Reson Imaging. 2017.
5. Yoon, MA, Hong SJ, Lee CH, et al. Intravoxel incoherent motion (IVIM) analysis of vertebral bone marrow changes after radiation exposure from diagnostic imaging and interventional procedures. Acta Radiol. 2017.
6. Lee EYP, Perucho JAU, Vardhanabhuti V, et al. Intravoxel incoherent motion MRI assessment of chemoradiation‐induced pelvic bone marrow changes in cervical cancer and correlation with hematological toxicity. J Magn Reson Imaging. 2017.
7. Porter DA, Heidemann RM. High resolution diffusion-weighted imaging using readout-segmented echo-planar imaging, parallel imaging and a two-dimensional navigator-based reacquisition. Magn Reson Med. 2009;62(2):468–475.
8. Le Bihan D, Turner R. The capillary network: a link between IVIM and classical perfusion. Magn Reson Med. 1992;27(1):171–178.
9. Lehnert A, Machann J, Helms G, et al. Diffusion characteristics of large molecules assessed by proton MRS on a whole-body mr system. Magn Reson Imaging. 2004; 22(1):39–46.
10. Baron P, Dorrius MD, Kappert P, et al. Diffusion-weighted imaging of normal fibroglandular breast tissue: influence of microperfusion and fat suppression technique on the apparent diffusion coefficient. NMR Biomed. 2010;23(4):399–405.
Figures