0462
New Diffusion Tensor and Dixon Imaging Results in Human Skeletal Muscle from the GESTALT Longitudinal Study of Aging1Norwich Medical School, University of East Anglia, Norwich, United Kingdom, 2National Institute on Aging, National Institutes of Health, Baltimore, MD, United States, 3Department of Radiology and Imaging Sciences, Emory University School of Medicine, Atlanta, GA, United States
Synopsis
This work investigates how aging influences skeletal muscle diffusion tensor imaging (DTI) measures in a healthy cohort with a broad age range. Sixty participants, from 23-87 years old, were recruited and tract-based DTI indices were calculated in their thigh quadriceps muscles. Through piecewise regression, we identified trends in DTI indices and Dixon fat measures with respect to age, including a previously undocumented decline in fractional anisotropy (FA) in older age, particularly in men (r=-0.46, p=0.06). Our results also show statistically significant differences in FA between quadriceps muscles (p<0.001) that may reflect differences in composition and patterns of use.
PURPOSE
Diffusion tensor imaging (DTI) is a popular tool for studying human skeletal muscle micro-architecture, and seminal works by Sinha et al.1 and Galbán et al.2 have illustrated its promise for investigating age-related sarcopenia. In this study, we explore DTI tract-based statistics and Dixon fat fractions in the thigh quadriceps muscles of a healthy aging cohort drawn from the Genetic and Epigenetic Signatures of Translational Aging Laboratory Testing (GESTALT) population, representing a broad age range of normative subjects.METHODS
Sixty participants (34 male, median age=60, range 23-87yrs) were recruited and their left thighs imaged using a 3T Achieva MRI scanner (Philips Healthcare, Best, NL) with a 32-channel cardiac coil. The imaging protocol, described previously3, consisted of: two-point Dixon with TR/TE=5.8/(1.4, 2.6)ms, FA=6°, field-of-view=256mm×228mm, in-plane resolution=1mm×1mm, 60 axial slices, slice thickness=3mm, and sensitivity-encoding (SENSE) factor=2; and spin echo single-shot echo-planar DTI with TR/TE=3500/33ms, field-of-view=256mm×225mm, 30 axial slices, slice thickness=6mm, in-plane resolution=2.56mm×2.61mm, NSA 8, partial Fourier factor=0.6 in ky, SENSE factor=2, combined spectral adiabatic inversion recovery (SPAIR) and slice-select gradient reversal for fat-suppression, and 15 diffusion gradient directions, with b=0, 450ms, δ=27ms, and Δ=35ms. Pixel-wise fat-fraction (FF) maps were calculated from Dixon water and fat images in MATLAB (The Mathworks, Natick, MA, USA) using the following equation: $$$FF(\%)=Fat/(Water+Fat)$$$. DTI data were distortion-corrected, eddy-current-corrected, and registered to anatomical images using FSL (FMRIB, University of Oxford, UK) before being exported to DSI-Studio (Fang-Cheng Yeh, Carnegie Mellon University, USA) for DTI parameter calculation and fiber-tracking. Regions-of-interest were drawn across each quadriceps muscle and used as seed regions for fiber tracking with the following parameters: 2mm seed-spacing, 0.2mm step length, FA lower/upper threshold=0.1/0.5, and max. angle change=10°. An FF threshold of 35% was used as a termination criterion for fiber tracking, and tract density thresholds4 were applied with a cut-off = mean tract density in quadriceps +2SD. Mean diffusion parameters were calculated for all quadriceps muscles using tract-based statistics, as recommended by Sinha et al.1 All statistical analyses were performed in R (R Foundation, Vienna, Austria). Differences between groups were assessed using Student’s t-tests. Nonlinear relationships were visualized using locally weighted scatterplot smoothing (LOESS) and evaluated by piecewise regression followed by Pearson’s correlation on individual line segments.RESULTS/DISCUSSION
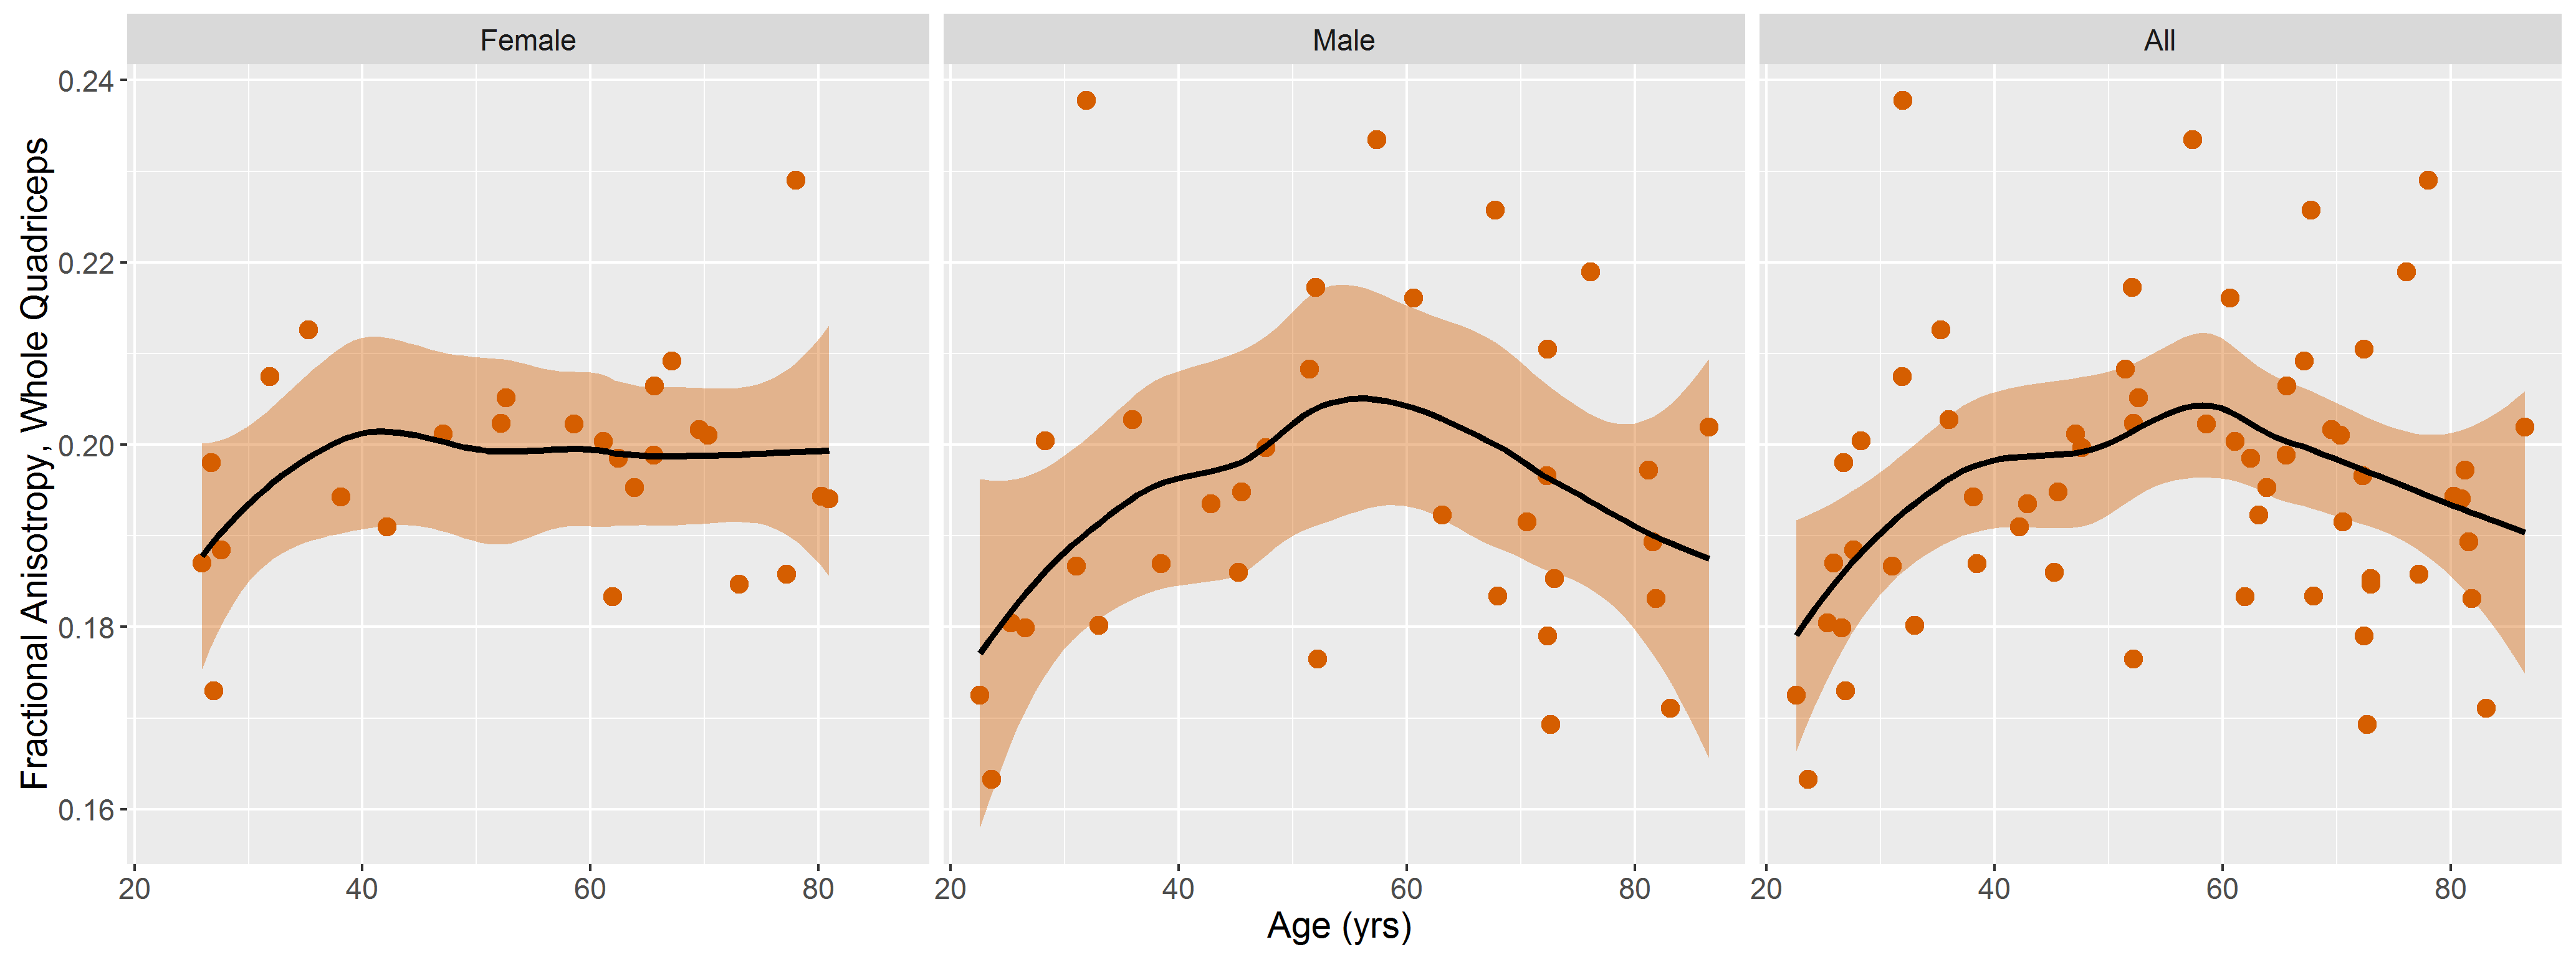
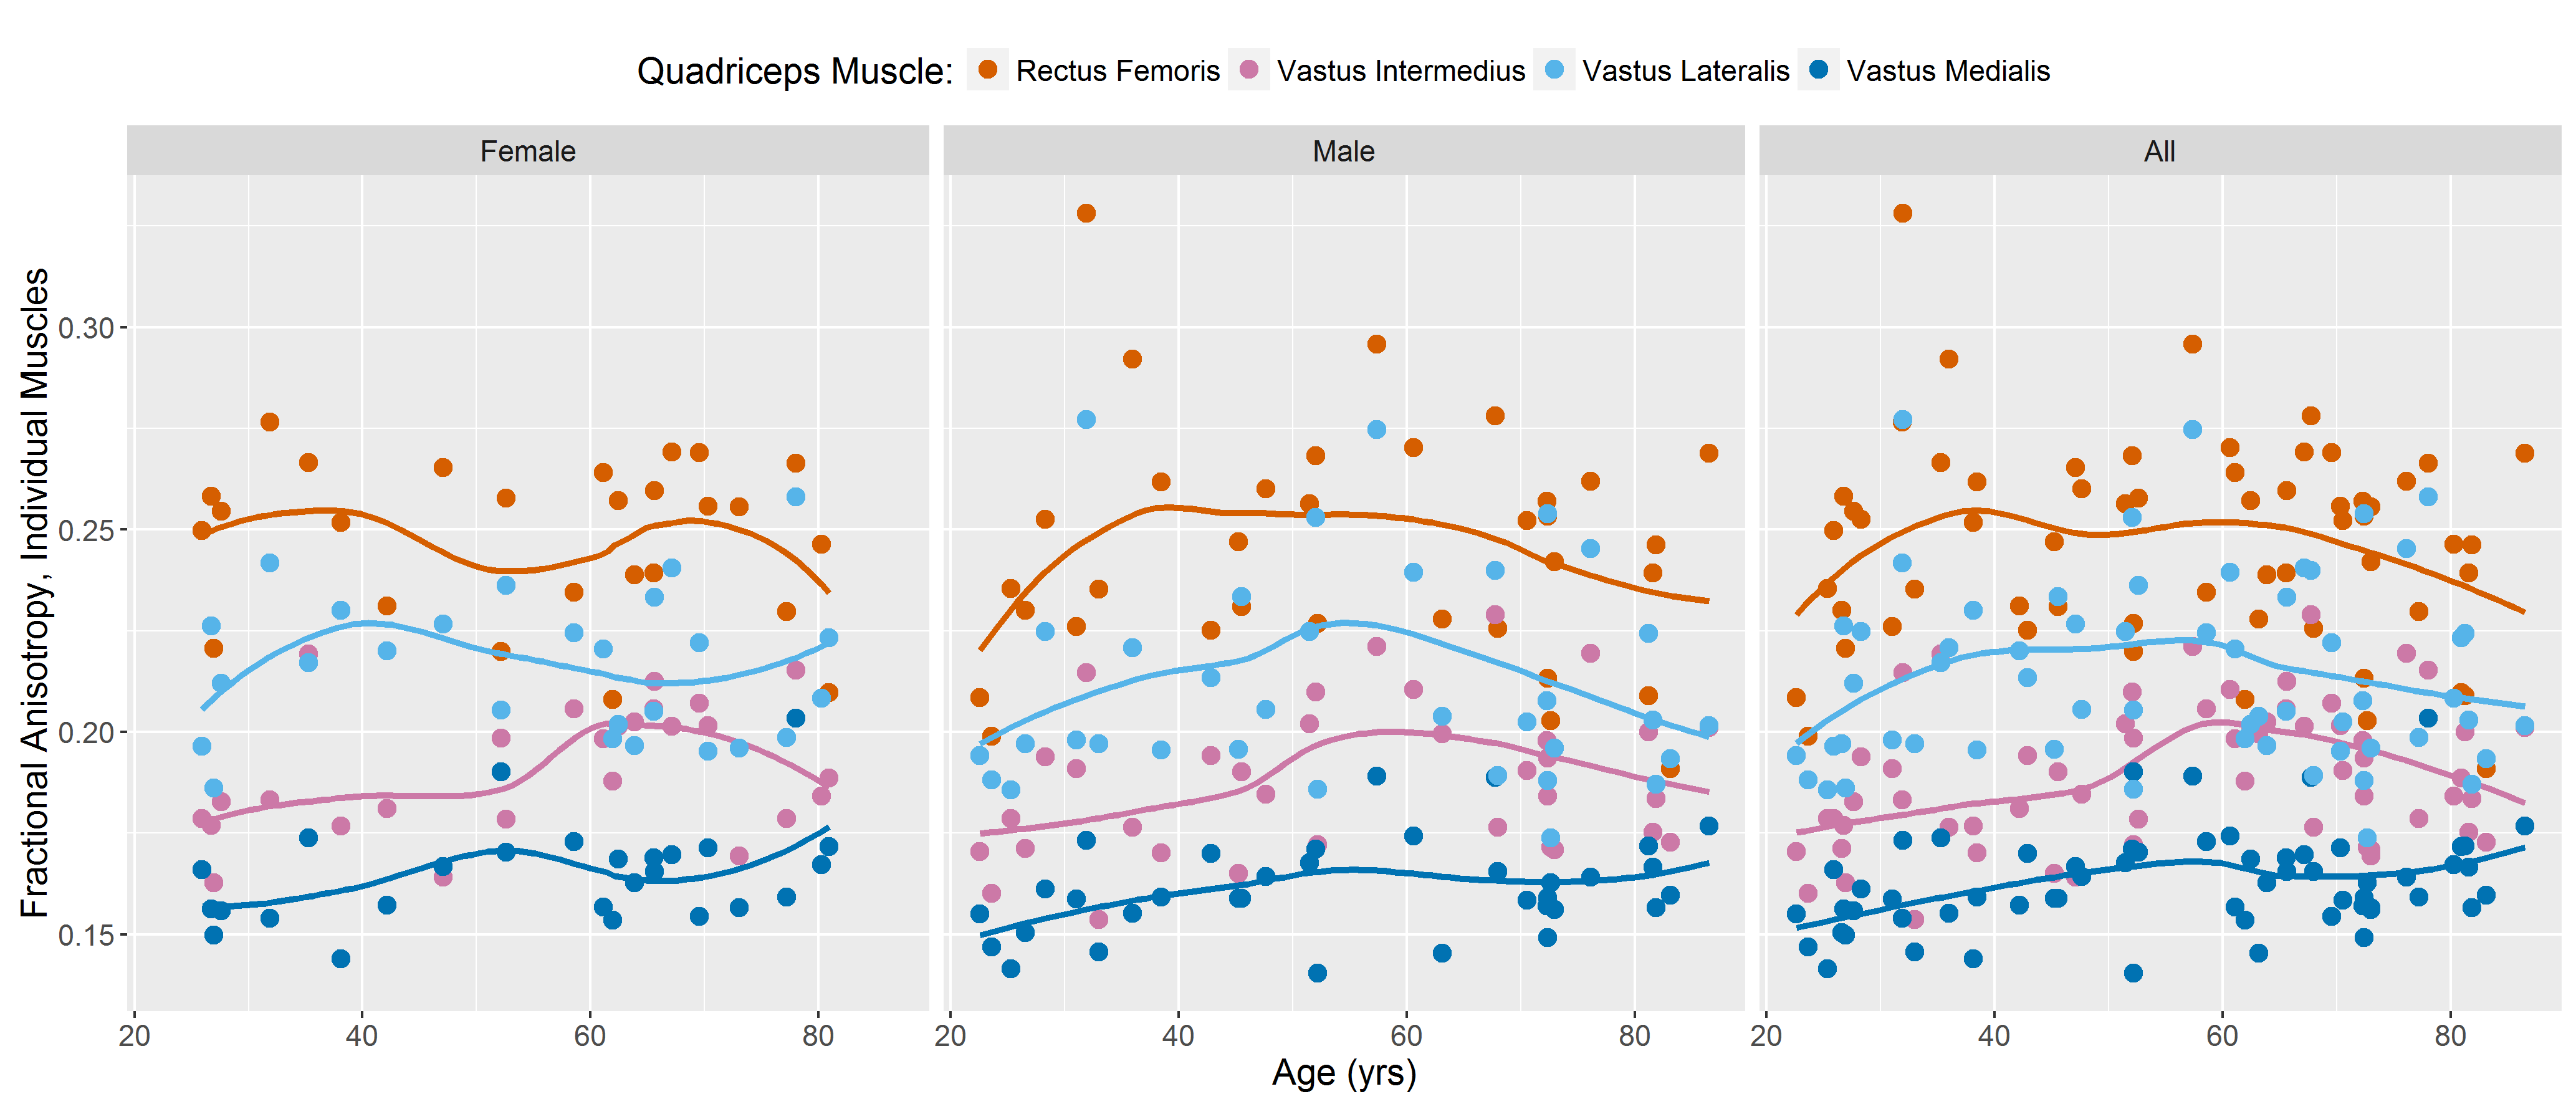
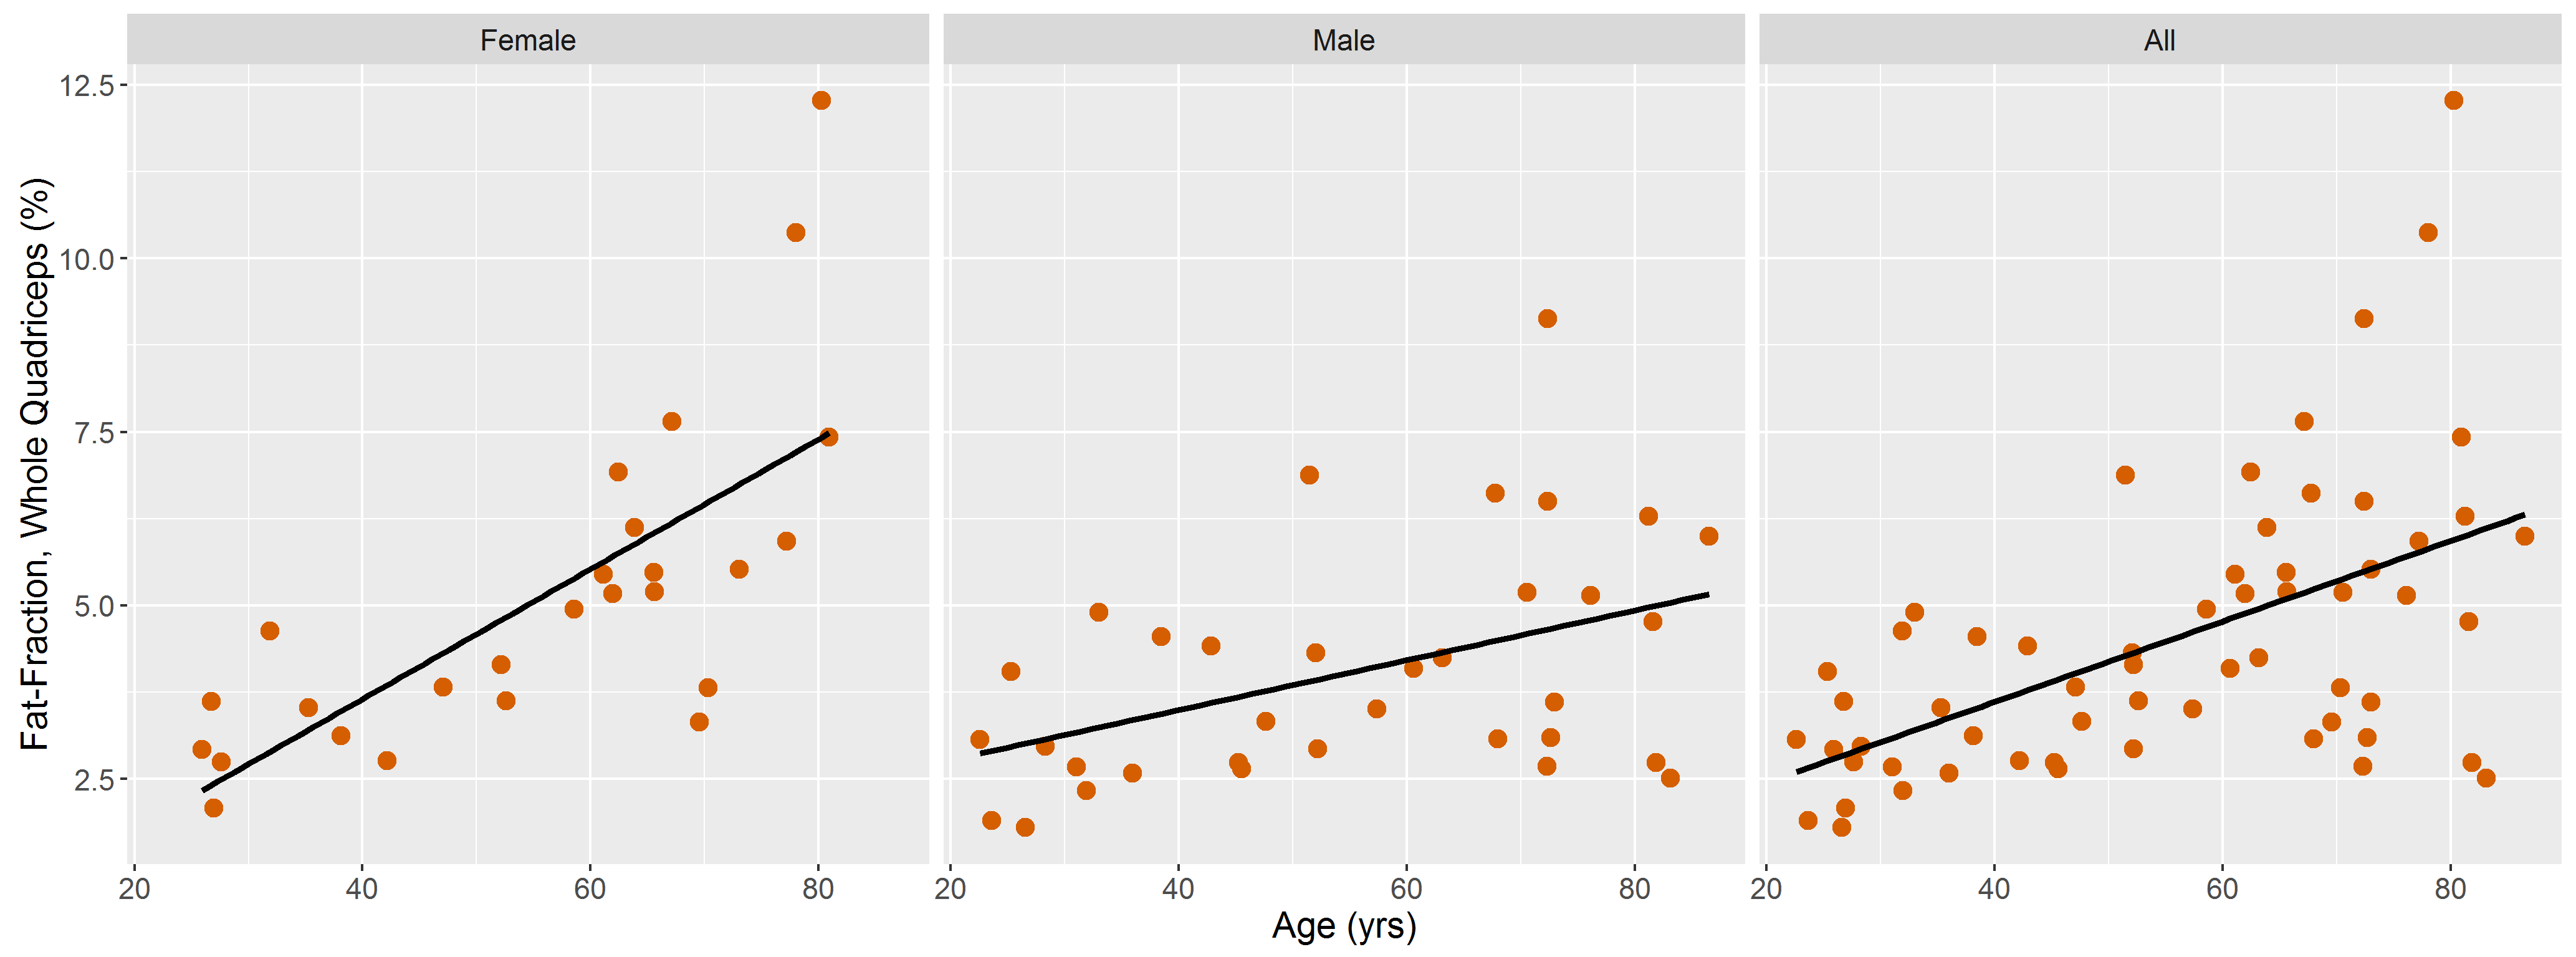
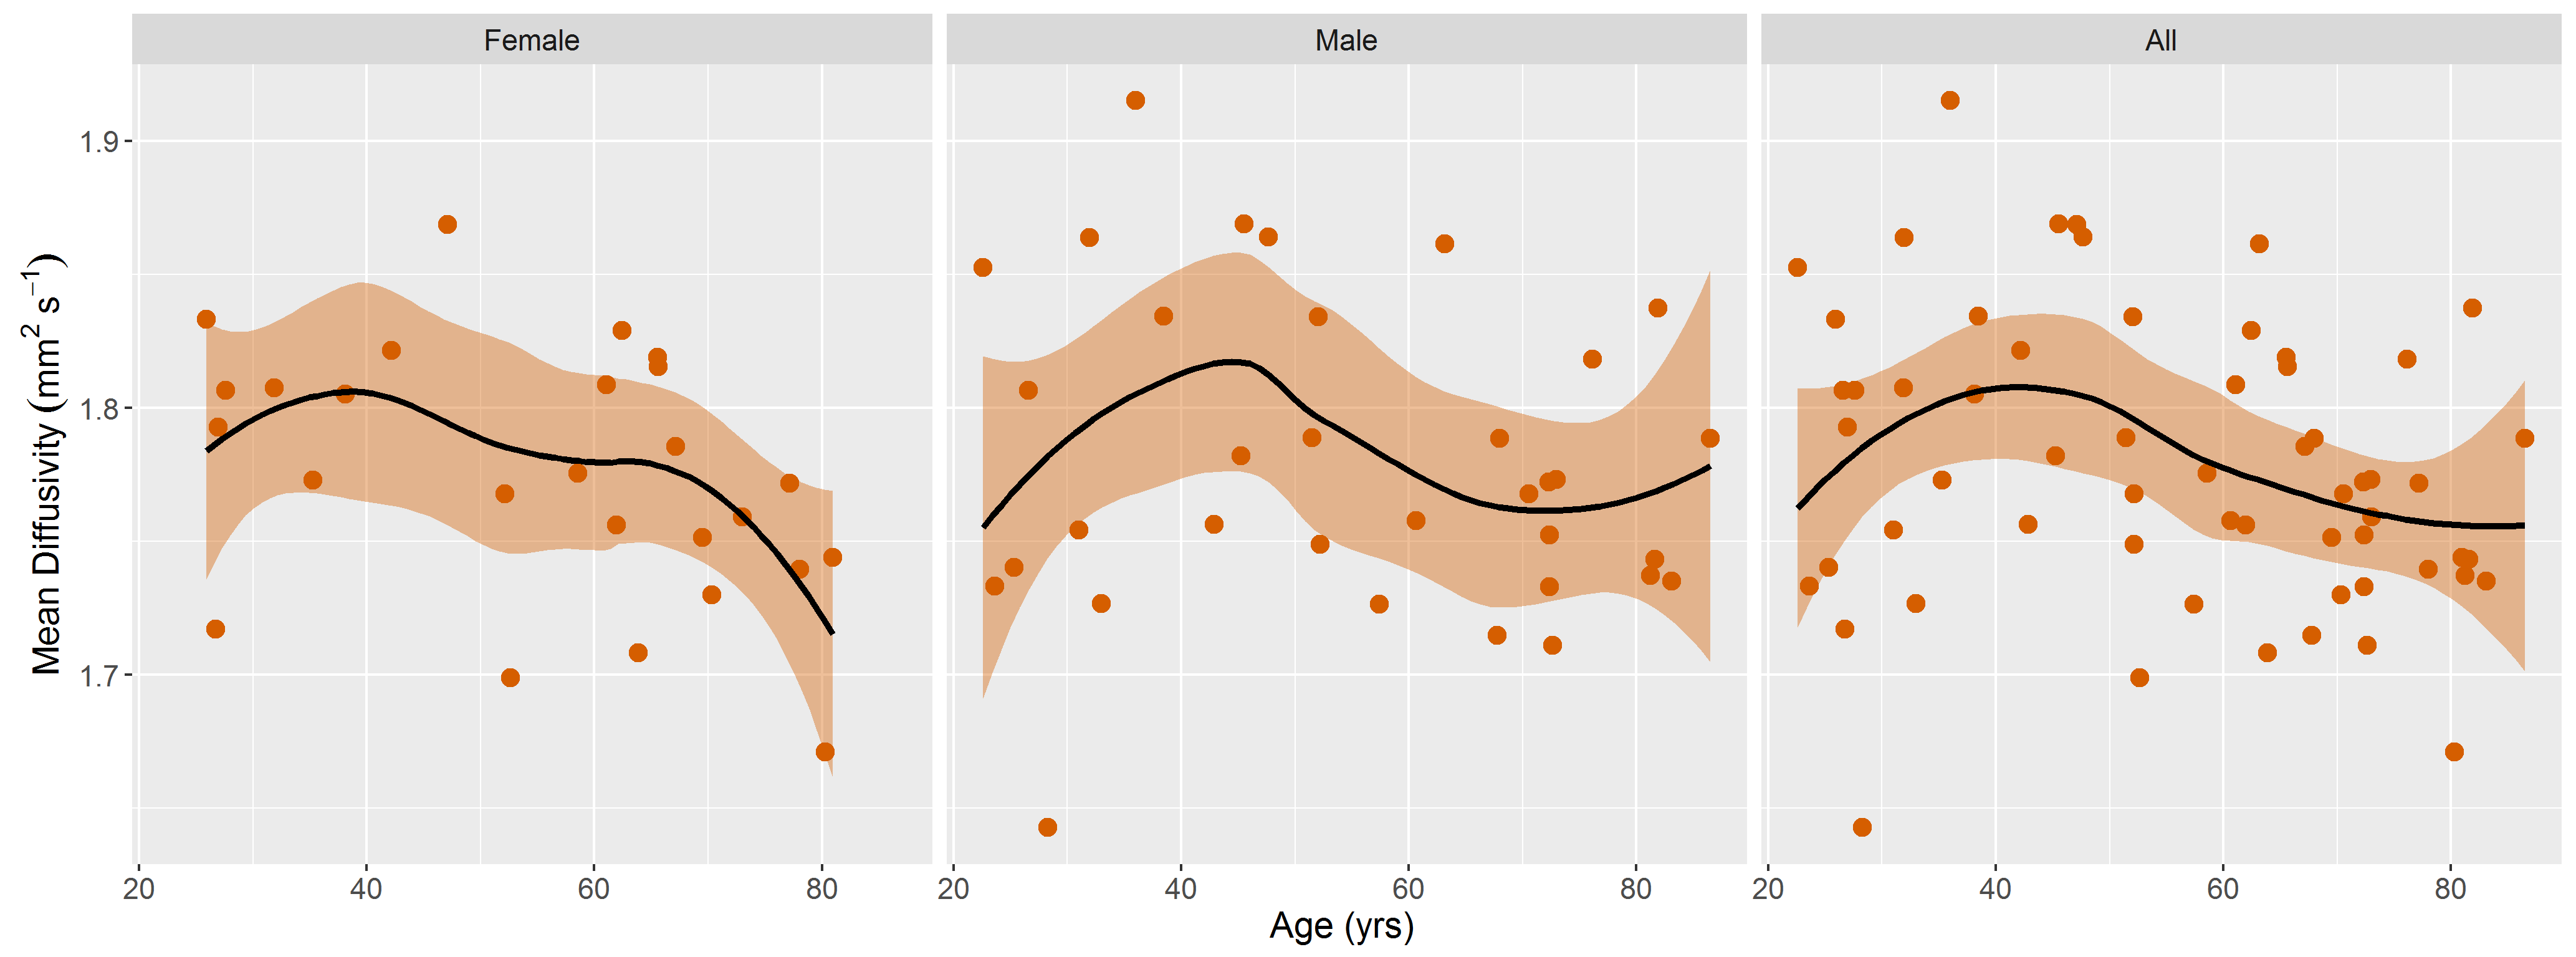
DTI data had a median (range) SNR of 61 (41-106), meeting Damon’s criterion of SNR≥40 for accurate measurement of DTI parameters5. Fig.1 shows representative visualizations of tract-based statistics in the quadriceps muscles of young, middle-aged, and older male participants. According to piecewise regression, in all participants, whole-quadriceps mean FA (Fig.2) increases sharply to a breakpoint at age 29yrs (breakpoint standard error, SE=2.2; r=0.73, p=0.02) and then increases more gently to a breakpoint at age 61yrs (SE=14.1; r=0.14, p=0.55), before declining in older age (r=-0.19, p=0.32). The increase in FA up to age 61yrs appears to be driven by data from male participants; in women, FA increases up to 32yrs (SE=12.9; r=0.61, p=0.06) and tends to decline thereafter (r=-0.18, p=0.2). Individual quadriceps muscles (Fig.3) show similar trends and demonstrate statistically significant differences from one another in FA (p<0.001), perhaps indicating different fiber compositions and patterns of use. Increasing FA with age has been described previously1,6,7, and can be attributed to reduced fiber diameter and restriction on water motion transverse to the fiber direction caused by increased fat and collagen content in the extracellular matrix. This interpretation is consistent with our FF data, as median FF correlates with both age (Fig.4, both sexes, r=0.55, p≪0.001) and FA (r=0.32, p=0.01). A decline in FA in older age, seen particularly in men (r=-0.46, p=0.06), has not been documented, and may relate to increased fiber permeability, and fiber discontinuities8, which would reduce λ1 and may be more prevalent in easily damaged muscles like the rectus femoris. Indeed, λ1 showed a nonsignificant trend towards an increase with age up to ~37yrs (SE=4.1; r=0.41, p=0.13) and decreased in older age (r=-0.38, p=0.01), particularly in men. Whole-quadriceps MD (Fig.5) tends to increase to a breakpoint at age 38yrs (SE=6.9; r=0.23, p=0.44) before decreasing into older age (r=-0.41, p=0.005), agreeing with the findings of Galbán et al.2CONCLUSION
We have identified trends in DTI indices and Dixon fat measures with respect to age, as well as relationships between them, and our study’s broad age range has allowed us to capture a previously undocumented decline in FA in older age. Our results also highlight pronounced differences between quadriceps muscles that may reflect differences in composition and patterns of use. Further work will seek to verify these changes by linking the data to functional and histological measures in the GESTALT database.Acknowledgements
This research was supported entirely by the Intramural Research Program of the NIH, National Institute on Aging.References
1. Sinha U, Csapo R, Malis V, Xue Y, Sinha S. “Age‐related differences in diffusion tensor indices and fiber architecture in the medial and lateral gastrocnemius”. J Magn. Reson. Imaging 2015;41(4):941-53.
2. Galbán CJ, Maderwald S, Stock F, and Ladd ME. “Age-related changes in skeletal muscle as detected by diffusion tensor magnetic resonance imaging”. J. Gerontol. A Biol. Sci. Med. Sci. 2007;62(4):453-8.
3. Cameron D, Reiter DA, Fishbein KW et al. “Age-Related Changes in Diffusion Tensor Imaging Measures in Human Skeletal Muscle”. Proc. Intl. Soc. Mag. Reson. Med. 2016, 24, p 4494.
4. Oudeman J, Mazzoli V, Marra MA, et al. “A novel diffusion‐tensor MRI approach for skeletal muscle fascicle length measurements”. Physiol. Rep. 2016;4(24):e13012.
5. Damon BM. “Effects of image noise in muscle diffusion tensor (DT)‐MRI assessed using numerical simulations”. Magn. Reson. Med. 2008;60(4):934-44.
6. Esposito A, Campana L, Palmisano A, et al. “Magnetic resonance imaging at 7T reveals common events in age-related sarcopenia and in the homeostatic response to muscle sterile injury”. PLoS One. 2013;8(3):e59308.
7. Yoon MA, Hong SJ, Kang CH, et al. “Age-related changes in healthy thigh musculature: Multi-parametric MR imaging analysis”. Proc. Intl. Soc. Mag. Reson. Med. 2017, 25, p 5125.
8. Bua EA, McKiernan SH, Wanagat J, McKenzie D, Aiken JM. “Mitochondrial abnormalities are more frequent in muscles undergoing sarcopaenia”. J. Appl Physiol. 2002;92(6):2617-24.
Figures