0461
Quantitative Assessment of Disc Biochemical Composition and Vertebral Body Fat in Patients with Low Back PainRoland Krug1, Misung Han1, Aaron Fields2, Gabby Joseph1, Justin Cheung1, Maya Mundada1, Alice Rochette2, Jeannie Bailey2, Alexander Ballatori2, Thomas Link1, Zachary McCormick2, Conor O'Neill2, and Jeffrey Lotz2
1Radiology, UCSF, San Francisco, CA, United States, 2Orthopedic Surgery, UCSF, San Francisco, CA, United States
Synopsis
We present a cross sectional study of 53 subjects with chronic lower back pain (n=39) and healthy controls (n=14). We have assessed disc biochemical composition (T1rho and T2 mapping) and vertebral bone marrow fat (6-point chemical-shift based imaging) as well as Pfirrmann grading. We have found significant associations between mean and standard-deviation of T1rho and T2 with vertebral bone marrow fat content in the adjacent vertebral body. We have also found strong associations of T1rho and T2 with clinical Pfirrmann grading.
INTRODUCTION
Chronic low back pain (CLBP) is the leading cause of disability worldwide. However, its cause is not well understood and is multifactorial involving the intervertebral disc (IVD) as well as the vertebral bodies but also other tissues such as muscle. Therefore, effective diagnosis, prevention and treatment strategies are currently not available. Novel, quantitative MR imaging strategies might be helpful to identify causes of CLBP and monitor treatment. It has previously been shown that quantitative T1rho and T2 MRI mapping pulse sequences can be used to assess macromolecular changes in proteoglycan content and collagen integrity respectively in-vivo in the disc [1]. Furthermore, bone marrow fat (BMF) maps can be obtained with high resolution from chemical shift encoding based water–fat MRI in the presence of trabecular bone susceptibility [2]. The purpose of this study was to assess the relationships between disc degeneration and bone marrow fat content in the adjacent vertebrae. We hypothesized that biochemical IVD degradation is associated with increased BMF content in the adjacent vertebral bodies and that furthermore, both are correlated with clinical Pfirrmann grading.METHODS
We enrolled 53 subjects (39 cases with lower back pain and 14 healthy controls). The study was approved by our institutional review board and informed consent was obtained from each subject. MRI was performed on a Discovery MR 750 3T scanner using an 8-channel phased-array spine coil (GE Healthcare, Waukesha, WI). The MRI protocol consisted of standard clinical T1- and fat-saturated T2- weighted fast spin-echo (FSE) sequences in sagittal and axial orientation, a combined T1rho and T2 mapping pulse sequence (MAPSS) [3], and a water-fat MRI sequence. MAPSS employed a segmented 3D-SPGR acquisition, and T1rho magnetization preparation performed with four spin-lock times (0, 10, 40, 80 ms) and 500 Hz spin lock frequency. T2 preparation was executed with four echo times (0, 8, 16, 64 ms). Water-fat MRI consisted of a 3D SPGR sequence with six echoes and iterative decomposition of water and fat with echo asymmetry and least-squares estimation (IDEAL) [4]. All five lumbar vertebrae and adjacent discs below were imaged, and manually segmented. Mixed random effects models accounting for multiple measurements per subject were used to assess the relationships between disc measurements (T1rho/T2 mean and standard deviation SD), and BMF (mean and SD).RESULTS
Figure 1 shows an example of T1rho and T2 maps as well as a standard T2 weighted image of a patient with lower back pain. Figure 2 shows the same images from a healthy control. Both, T1rho and T2 values are higher in the healthy control. Figure 3 shows the bone marrow fat content (fat fraction) in the same subjects. Here, the BMF is clearly higher in the patient with CLBP. We found that decreased T1rho and T2 mean values as well as SD (indicative of increased disc degeneration) was significantly associated with elevated BMF (p<0.05) in L1 to L4 with the exception of T2 SD, which was only significantly associated with BMF in L1 to L3. Clinical Pfirrmann grading was inversely associated with T1rho and T2 mean values but also with SD (p<0.05). Figure 4 depicts these inverse relationships and Table 1 summarizes these findings. We also found significant (p<0.05) associations between vertebral BMF SD (L1-L4) and mean and SD of T1rho and T2 values in the adjacent IVD. In addition, the relationship with mean T2 was also significant in L5.DISCUSSION
It has previously been shown that T1rho and T2 MRI are promising imaging biomarkers for biochemical disc degeneration and correlate with CLBP-related disabilities. In the past, a qualitative method (Modic changes) has been proposed to characterize vertebral bone marrow lesions that were found to correlate with discogenic pain. In this study, we applied novel quantitative MR imaging techniques to compute vertebral BMF content and investigate its association with disc degeneration. Our results indicate that there is a significant association between disc degeneration and increased BMF in the adjacent vertebral body. These findings support the notion that diminished nutrient supply may influence IVD degeneration because the conversion of hematopoietic bone marrow to fatty bone marrow impairs the supply of available nutrients to cells in the IVD and could thereby accelerate disc degeneration.CONCLUSION
In order to improve diagnosis and treatment of CLBP a multifactorial approach is required that moves beyond the investigation of degenerative disc disease. In this work, we report strong associations between disc health measured by quantitative T1rho and T2 MRI and bone marrow fat content in the adjacent vertebral body.Acknowledgements
This research was supported by the National Institutes of Health (grant AR063705).References
[1] Blumenkrantz G et al. MRM. 2010;63(5):1193-200. [2] Karampinos DC et al. MRM. 2014;71(3):1158-65. [3] Li X et al. MRM. 2005;54(4):929-36. [4] H. Yu. et al. MRM 2008;60:1122–1134.Figures
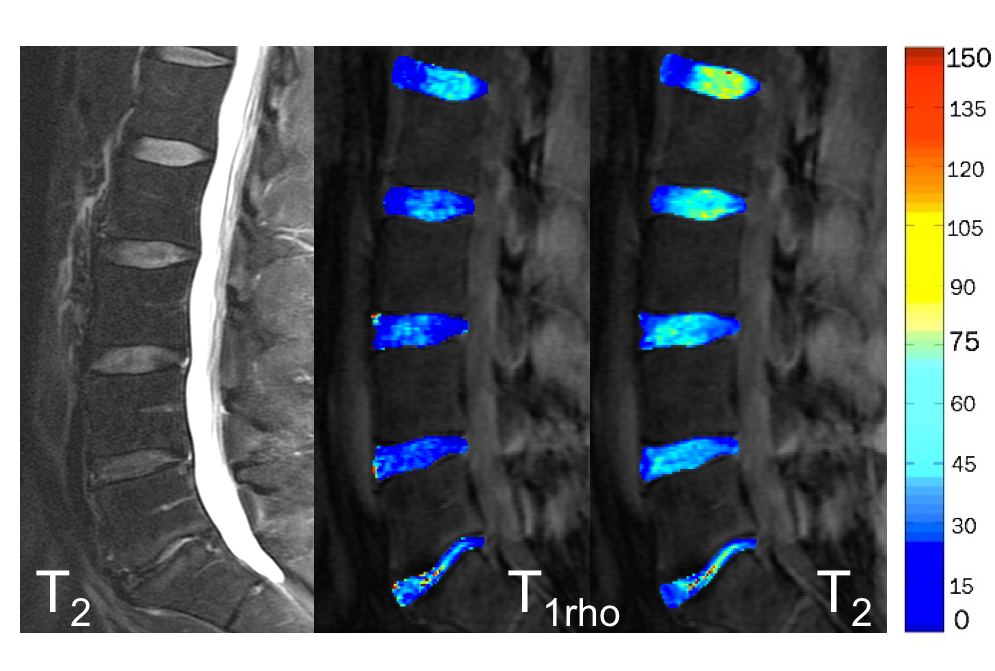
Figure 1:
Shown is a T2-weighted
clinical FSE MR image (left) and the corresponding T1rho and T2
maps of a patient with chronic lower back pain. The color bar indicates relaxation
times in ms.
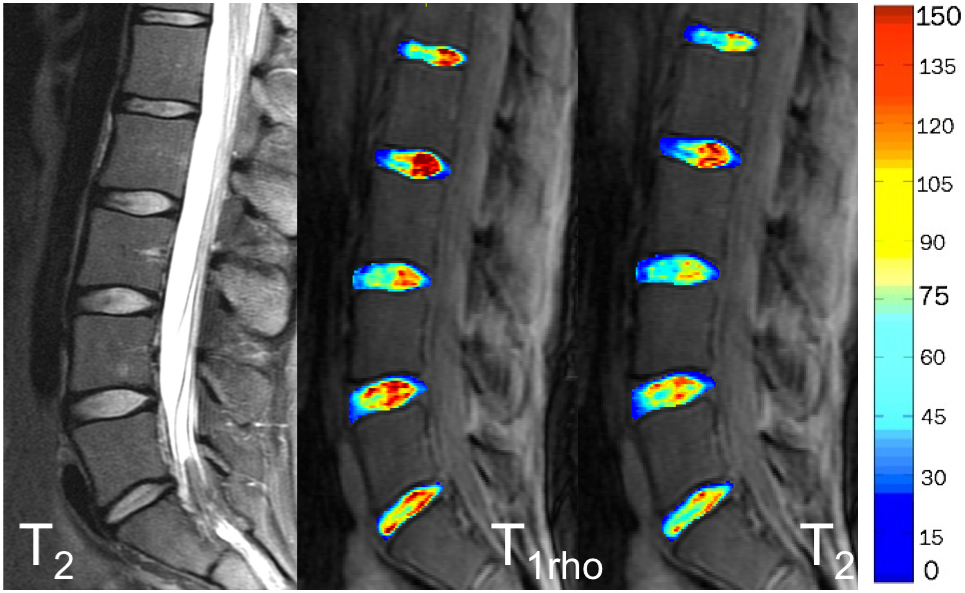
Figure 2:
Shown is a T2-weighted
clinical FSE MR image (left) and the corresponding T1rho and T2
maps of a healthy control subject. The color bar indicates relaxation times in
ms.
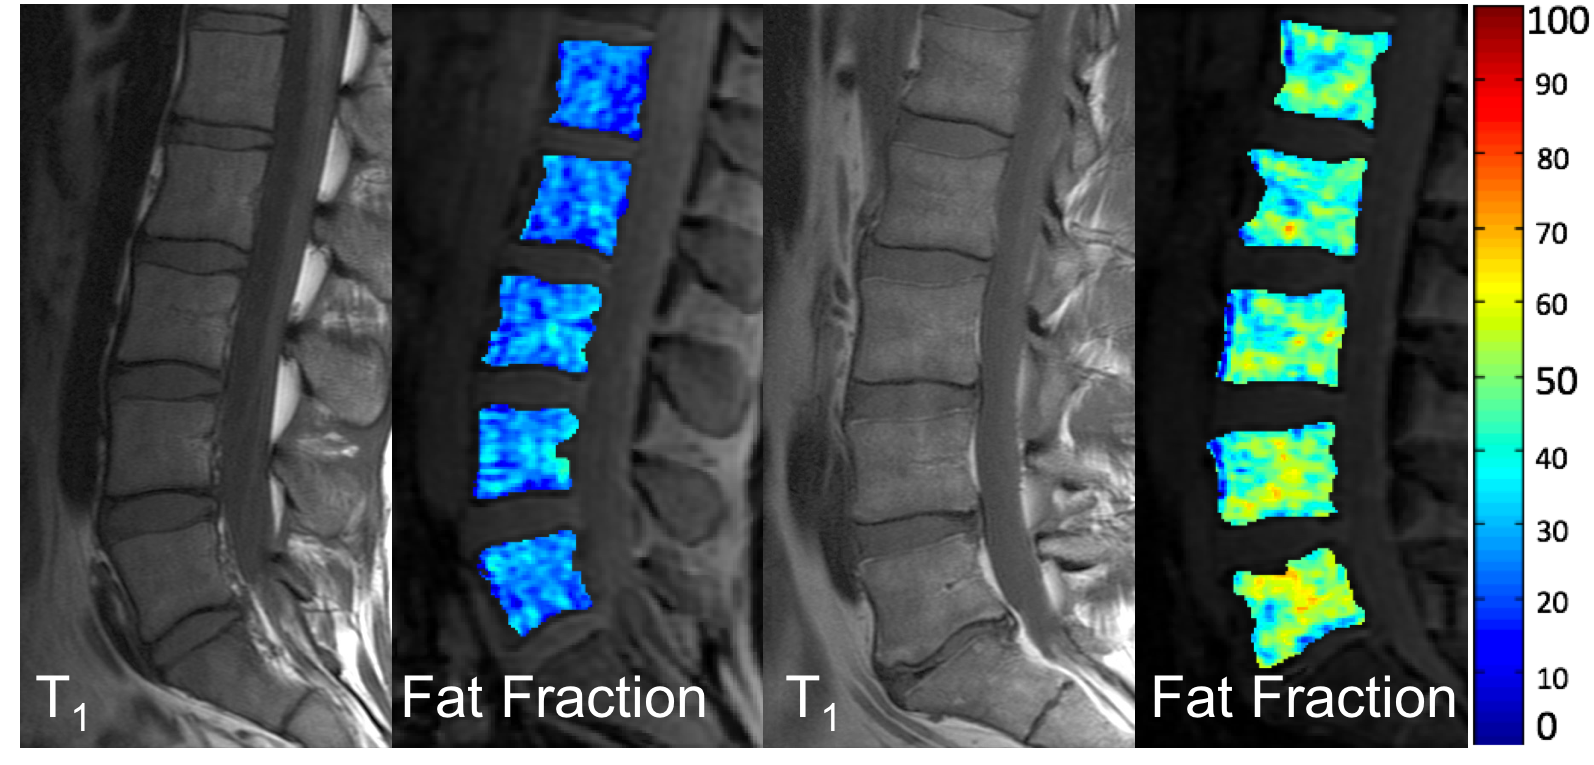
Figure 3:
The same subjects as
in Figure 1 and 2 are shown. Left shows clinical T1 image and Fat
Fraction color map of the healthy control from Figure 2 and right shows T1
image and Fat Fraction color map of the CLBP patient. The color bar indicates
fat fractions from 0 to 100% fat. The elevated BMF content in the patient with
CLBP is clearly demonstrated.
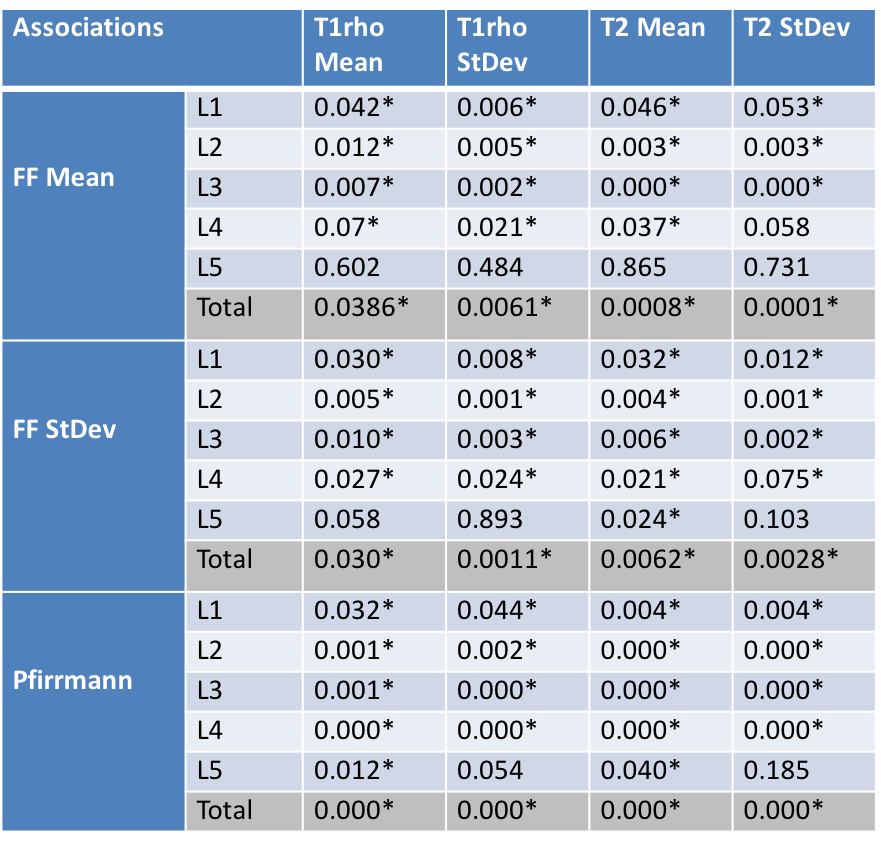
Table
1:
The table summarizes
our findings. Shown are the p-values of the several relationships between T1rho/T2 and
BMF content (Fat Fraction) as well as Pfirrman grading. Significance
(p<0.05) was indicated with an asterisk.
Individual significance by adjacent bone/disc as well as overall
significance (total) is shown. As can be seen, the relationships with the
adjacent discs are very significant for L1 to L4 and not significant for L5. Pfirrmann
grading is significant for all discs and T1rho/T2 mean
values.
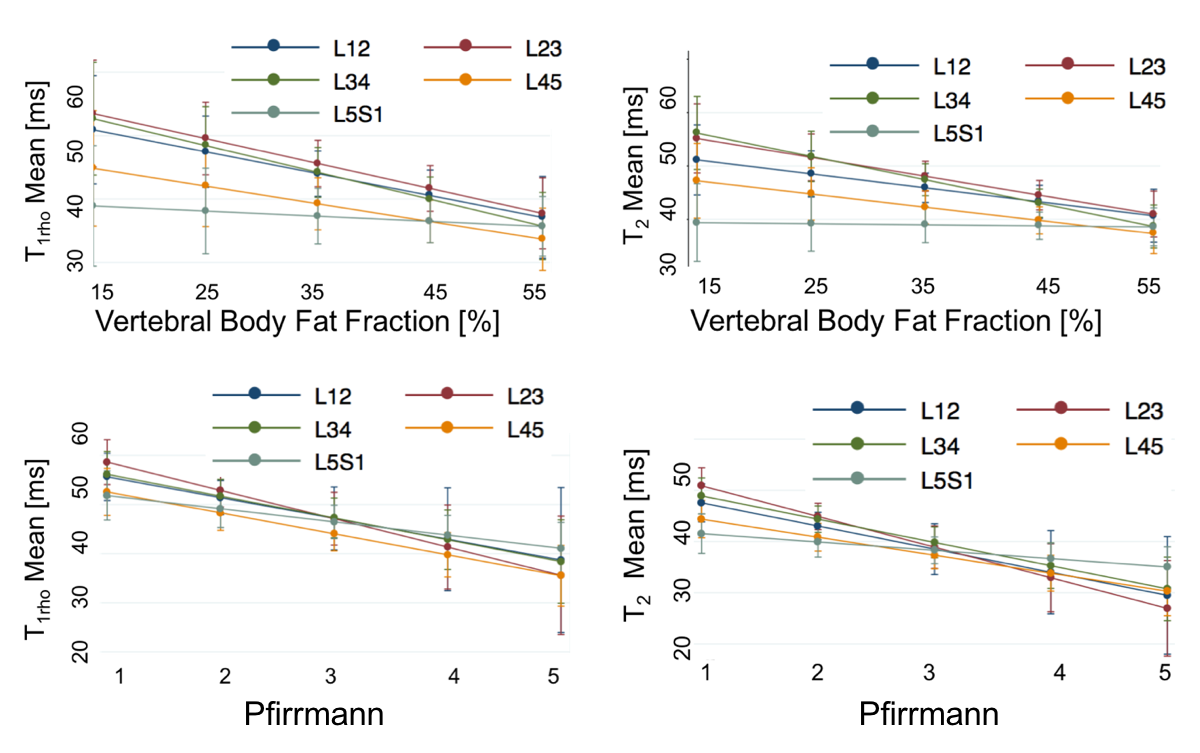
Figure 4:
Graphs from the mixed effects models showing associations
between the outcome variables (T1rho
and T2) and the predictor variables (mean vertebral BMF and
Pfirrmann) with the 95% confidence intervals. Lower T1rho (top left
graph) and T2 (top right graph) values (and thus lower disc health)
were significantly (p < 0.05) associated with higher vertebral BMF content.
Furthermore, significant relationships between both lower T1rho
(bottom left graph) and T2 (bottom right graph) values and higher
Pfirrmann grading are shown.