0460
T1ρ and T2 of articular cartilage and medial meniscus at baseline and 6-month can predict the degenerative changes of cartilage at 3 years after ACL reconstruction1Biomedical Engineering, Cleveland Clinic, Cleveland, OH, United States, 2Radiology and Biomedical Imaging, University of California, San Francisco, San Francisco, CA, United States, 3Orthopedic Surgery, University of California, San Francisco, San Francisco, CA, United States
Synopsis
Patients with anterior cruciate ligament (ACL) injury have a high risk of development of early post-traumatic osteoarthritis (PTOA) even after ACL reconstruction. The aim of this study was to investigate the risk factors that may predict the longitudinal cartilage degeneration by using MR T1ρ/T2 imaging. The first 6-month changes of T1ρ/T2 values of the cartilage and anterior horn of medial meniscus significantly correlated with the 3-year cartilage degenerative change after ACL reconstruction. And also, T2 values of the posterior horn of medial meniscus prior to surgery significantly correlated with the cartilage degeneration of anterior medial tibia 3-year after the reconstruction.
Purpose
Patients with ACL injury have a high risk of development of early post-traumatic osteoarthritis (PTOA) even after ACL reconstruction 1,2. Acute meniscus injuries often occur alongside ACL injury4, the associations between meniscal and cartilage damage and degeneration during PTOA development in the patients with ACL injury, however, are still unclear. Therefore, the aims of this study were: 1) to evaluate the longitudinal changes of T1ρ and T2 values in the knee cartilage after acute ACL injury and reconstruction, and 2) to investigate the relationship between meniscus damage and degenerative changes of cartilage in the knee joint evaluated by MRI T1ρ and T2 mapping.Methods and Materials
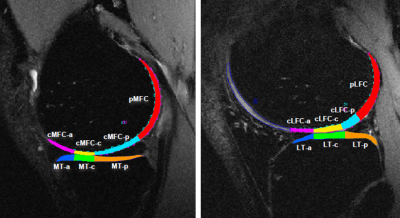
In this prospective cohort study, bilateral knees were scanned using a 3 Tesla MRI T1ρ and T2 mapping (GE Healthcare, Milwaukee, WI, USA) with an 8-channel phased array knee coil (Invivo, Orlando, FL, USA) for 36 patients with ACL injury (age = 31.49 ± 7.61 years, BMI = 23.87± 2.52 kg/m2, 15 female) at baseline (prior to surgical reconstruction), 6 month, 1, 2 and 3 years after reconstruction and 14 healthy controls (age = 31.38 ± 4.89 years, BMI = 23.61± 1.87 kg/m2, 5 female) at baseline, 1 and 3 years. The imaging protocol included 3D fast spin-echo (CUBE) images (TR/TE = 1500/26.69 ms, FOV=16 cm matrix=384 x 384, slice thickness 0.5 mm, ETL=32) and combined T1ρ and T2 imaging based on 3D MAPSS (resolution: 0.56*0.56*4mm; T1ρ spin-lock frequency 500Hz, Time of spin-lock: 0/10/40/80ms; T2 preparation TE: 2.9/13.6/24.3/45.6ms) 6. CUBE images were registered to the first echo of T1ρ images. The anterior and posterior horns of lateral and medial meniscus, and fourteen sub-compartments of the knee cartilage were semi-automatically segmented in CUBE images using an in-house developed software7 (Figure. 1). T1ρ and T2 maps were reconstructed pixel-by-pixel with a two-parameter exponential fit 8. The follow up T1ρ and T2 maps were all registered to the baseline maps. The mean and standard deviation of T1ρ and T2 values of each defined cartilage and meniscus compartments were calculated. Changes in cartilage T1ρ and T2 from baseline to 3 year were compared between patients and controls using ANACOVA , adjusted for age, gender, BMI. Pearson correlation coefficients between baseline meniscus T1ρ and T2 and cartilage T1ρ and T2 at 3 year; as well as between changes of meniscus T1ρ and T2 from baseline to 6 month (early stage) and cartilage T1ρ and T2 changes from baseline to 3 years, were calculated. Significance was defined with P < 0.05.Results
Significant larger increases of cartilage T1ρ and T2 from baseline to 3 year were observed in the injured knee of patients compared to controls in medial femoral condyle (MFC) for T1ρ and T2, and in medial tibia (MT) for T1ρ only (Table 1). The increases of cartilage T1ρ and T2 were fastest for the first 6-month (Figure 2 showing MFC as an example), constituting 84.9 and 86.3% of the increase from baseline to 3 year, respectively. The increases of cartilage T1ρ and T2 from baseline to 6-month were correlated to the increases from baseline to 3-year in all compartments except for lateral tibia (LT) (Table 2). The T1ρ and T2 values of the posterior horn of medial meniscus (PHMED) at baseline were significant correlated to cartilage T2 in MT at 3 year. Changes in T1ρ and T2 values of the anterior horn of medial meniscus (AHMED) from baseline to 6-month were significantly correlated to changes in cartilage T1ρ and T2 in anterior MT (aMT) from baseline to 3-year (Table 3).Discussion and Conclusion
Significant increases in cartilage T1ρ and T2 of the medial side were observed at 3-years after ACL reconstruction, indicating early degeneration of the joint in patients after ACL injury. Very interestingly, the most increases occurred in the first 6-month after ACL reconstruction, suggesting the early cartilage degeneration may be caused more by the toxic biochemical environment after ACL injury and surgery, rather than the biomechanical factors which may cause the continuous but smaller increase at later stages (after 6-months). Baseline as well as early changes (6-month) of meniscus T1ρ and T2 were associated cartilage T1ρ and T2 at 3-year, suggesting that early meniscal matrix changes may predict cartilage degeneration in this cohort. These findings suggest quantitative MRI can be used as powerful tools for detecting very early degenerative changes in the knee after ACL injury and for identifying patients who have a high risk of developing PTOA to allow early interventions in these patients.Acknowledgements
This study is supported by NIH P50 AR060752.References
[1] Louboutin H et al. The Knee 2009;16(4):239-44. [2] Lohmander et al. Arthritis Rheum. 2004;50:3145–52. [3] Radin EL et al. Clin Orthop Relat Res. 1984;(185):290-294. [4] Nikolić DK et al. Knee Surg Sports Traumatol Arthrosc. 1998;6(January 1989):26-30. [5] Li et al. Radiology 2011;258(2):505-14. [6] Li et al. J Magn Reson Imaging. 2015;42(2):533-538. [7] Souza et al. Osteoarthritis and Cartilage, 2014;22(10):1367-76–59. [8] Su F et al. Osteoarthritis and Cartilage. 2013;21(8):1058-1067.Figures


