0459
Ultrashort Echo Time Imaging of the Osteochondral Junction in Subjects with Knee Osteoarthritis and Age-matched Healthy Volunteers1Radiology, University of Cambridge, Cambridge, United Kingdom, 2Experimental Medicine Imaging, GlaxoSmithKline, Stevenage, United Kingdom, 3GE Healthcare, Little Chalfont, United Kingdom, 4Trauma & Orthopaedics, University of Cambridge, Cambridge, United Kingdom
Synopsis
We describe in vivo translation of ultrashort TE (UTE) imaging of the osteochondral junction (OCJ) at the knee in 9 subjects with osteoarthritis (OA) and 4 age-matched healthy volunteers. The OCJ plays an important role in onset and progression of OA. Our study demonstrates that UTE imaging of the OCJ is repeatable and demonstrates OCJ defects in OA subjects but not in healthy volunteers. Areas of OCJ damage commonly co-locate to other osteochondral pathology (bone marrow lesions and cartilage defects). UTE imaging of the OCJ may be a helpful tool for assessing OCJ damage in clinical studies of OA.
Introduction
Disruption of the osteochondral junction (OCJ) is thought to play an important role in the onset and progression of osteoarthritis (OA). Using conventional MR imaging, direct visualisation of the OCJ is not possible due to inherent short T1 and T2 relaxation times of the OCJ tissues. However, by achieving echo times (TEs) of < 1 ms, ultrashort echo time (UTE) MR imaging allows direct visualisation of the OCJ. The normal OCJ appears as an area of linear high signal intensity (SI) on UTE images at the bone-cartilage interface. In OA it has been shown that this area of linear high SI can become thinned or absent, compatible with histological findings of OCJ defects1,2. These findings have been described in a number of cadaveric MR studies, but there are limited in vivo data available3-5.
The aims of this study were to compare the in vivo appearance of the OCJ on UTE MR imaging between subjects with knee OA and age-matched healthy volunteers, to determine the relationship between OCJ defects and other osteochondral pathology, and to assess test-retest repeatability.
Methods
We imaged 9 participants with mild-moderate knee osteoarthritis, characterised by radiographs with medial tibiofemoral compartment predominant disease and Kellgren-Lawrence grades 2-3, and 4 age-matched healthy volunteers. Participants were imaged at baseline and 1 month.
MR studies were performed on a 3T system (MR 750, GE Healthcare, Waukesha, WI). The MR protocol consisted of standard clinical sequences (coronal and sagittal intermediate-weighted fat-saturated fast spin echo (FSE) sequences plus a coronal T1-weighted FSE sequence) and a sagittal dual-echo UTE gradient echo sequence acquired using a 3D cones trajectory (research prototype; repetition time 15 ms, TE 0.03/4.5 ms, flip angle 13o, field-of-view 18 x 18 cm, matrix 430 x 430, slice thickness 2 mm, number of averages 1, acquisition time ~ 7.5 minutes).
To increase conspicuity of short T2 tissues, we performed weighted digital image subtraction of the longer TE (4.5 ms) from the shorter TE images (0.03 ms)6. The presence or absence of characteristic linear high SI at the OCJ was scored in 12 regions for each knee, corresponding to tibiofemoral subdivisions commonly used for semi-quantitative scoring. The presence of bone marrow lesions (BML) or cartilage defects in the same regions was also recorded. Assessment was performed by a single musculoskeletal radiologist with 5 years’ experience in OA research, blinded to group assignment.
We used descriptive statistics to compare the number of regions with OCJ defects in subjects with OA and healthy volunteers, and to assess the frequency with which OCJ defects co-located with BMLs or cartilage defects. Test-retest repeatability was evaluated using kappa statistics.
Results
Participant characteristics are displayed in table 1.
Six out of 9 OA participants (67%) had an OCJ defect in at least one region compared to 0 out of 4 controls (0%). The most commonly involved region was the central medial tibia (4 participants). OCJ defects commonly co-located to BMLs (7 out of 10 OCJ defects, 70%) and cartilage defects (6 out of 10 OCJ defects, 60%). Results are displayed in table 2. Sample images are displayed in figures 1 – 3.
The kappa value for test-retest repeatability of OCJ assessment using UTE was 0.83 (95% confidence interval 0.64 to 1).
Discussion
The appearances of OCJ defects in subjects with OA in vivo are in keeping with abnormalities predicted by cadaveric MR and histology studies1,3. The biological plausibility of the findings is enhanced by the frequency of co-location of OCJ damage to other osteochondral pathology (BMLs and cartilage defects). Our findings demonstrate in vivo translation of UTE imaging of the OCJ, and suggest that this is a useful tool for future studies of OA onset and progression. This may include predicting response to intervention, as equine studies have demonstrated that the presence or absence of OCJ damage is an important predictor of response to treatment of cartilage defects7.
Our results demonstrate that UTE imaging of the OCJ is repeatable with kappa values in keeping with ‘near-perfect’ test-retest repeatability for qualitative assessment8.
Previous in vivo studies have not used age-matched control subjects, therefore it has been unclear whether areas of OCJ damage are related to OA or normal ageing4. The normal appearance of the OCJ in age-matched control subjects in this study suggests that the OCJ defects are not part of normal ageing, although at present the number of healthy volunteers imaged is small.
Conclusion
In vivo UTE MR imaging of the OCJ is repeatable and demonstrates OCJ defects in subjects with OA. OCJ defects commonly co-locate with other osteochondral pathology.Acknowledgements
This was a University of Cambridge sponsored study with funding provided by GlaxoSmithKline. The research team acknowledge the support of the National Institute for Health Research Cambridge Biomedical Research Centre.
References
1. Lane LB, Bullough PG: Age-related changes in the thickness of the calcified zone and the number of tidemarks in adult human articular cartilage. J Bone Joint Surg Br 1980; 62:372–375.
2. Li B, Marshall D, Roe M, Aspden RM: The electron microscope appearance of the subchondral bone plate in the human femoral head in osteoarthritis and osteoporosis. J Anat 1999; 195 ( Pt 1):101–110.
3. Bae WC, Dwek JR, Znamirowski R, et al.: Ultrashort Echo Time MR Imaging of Osteochondral Junction of the Knee at 3 T: Identification of Anatomic Structures Contributing to Signal Intensity. Radiology 2010; 254:837–845.
4. Mackay JW, Low SBL, Houston GC, Toms AP: Ultrashort TE evaluation of the osteochondral junction in vivo: a feasibility study. Br J Radiol 2016; 89:20150493.
5. Du J, Carl M, Bae WC, et al.: Dual inversion recovery ultrashort echo time (DIR-UTE) imaging and quantification of the zone of calcified cartilage (ZCC). Osteoarthritis Cartilage 2013; 21:77–85.
6. Robson MD, Gatehouse PD, So PW, Bell JD, Bydder GM: Contrast enhancement of short T2 tissues using ultrashort TE (UTE) pulse sequences. Clin Radiol 2004; 59:720–726.
7. Frisbie DD, Morisset S, Ho CP, Rodkey WG, Steadman JR, McIlwraith CW: Effects of Calcified Cartilage on Healing of Chondral Defects Treated With Microfracture in Horses. Am J Sports Med 2006; 34:1824–1831.
8. Landis JR, Koch GG: The measurement of observer agreement for categorical data. Biometrics 1977; 33:159–174.
Figures
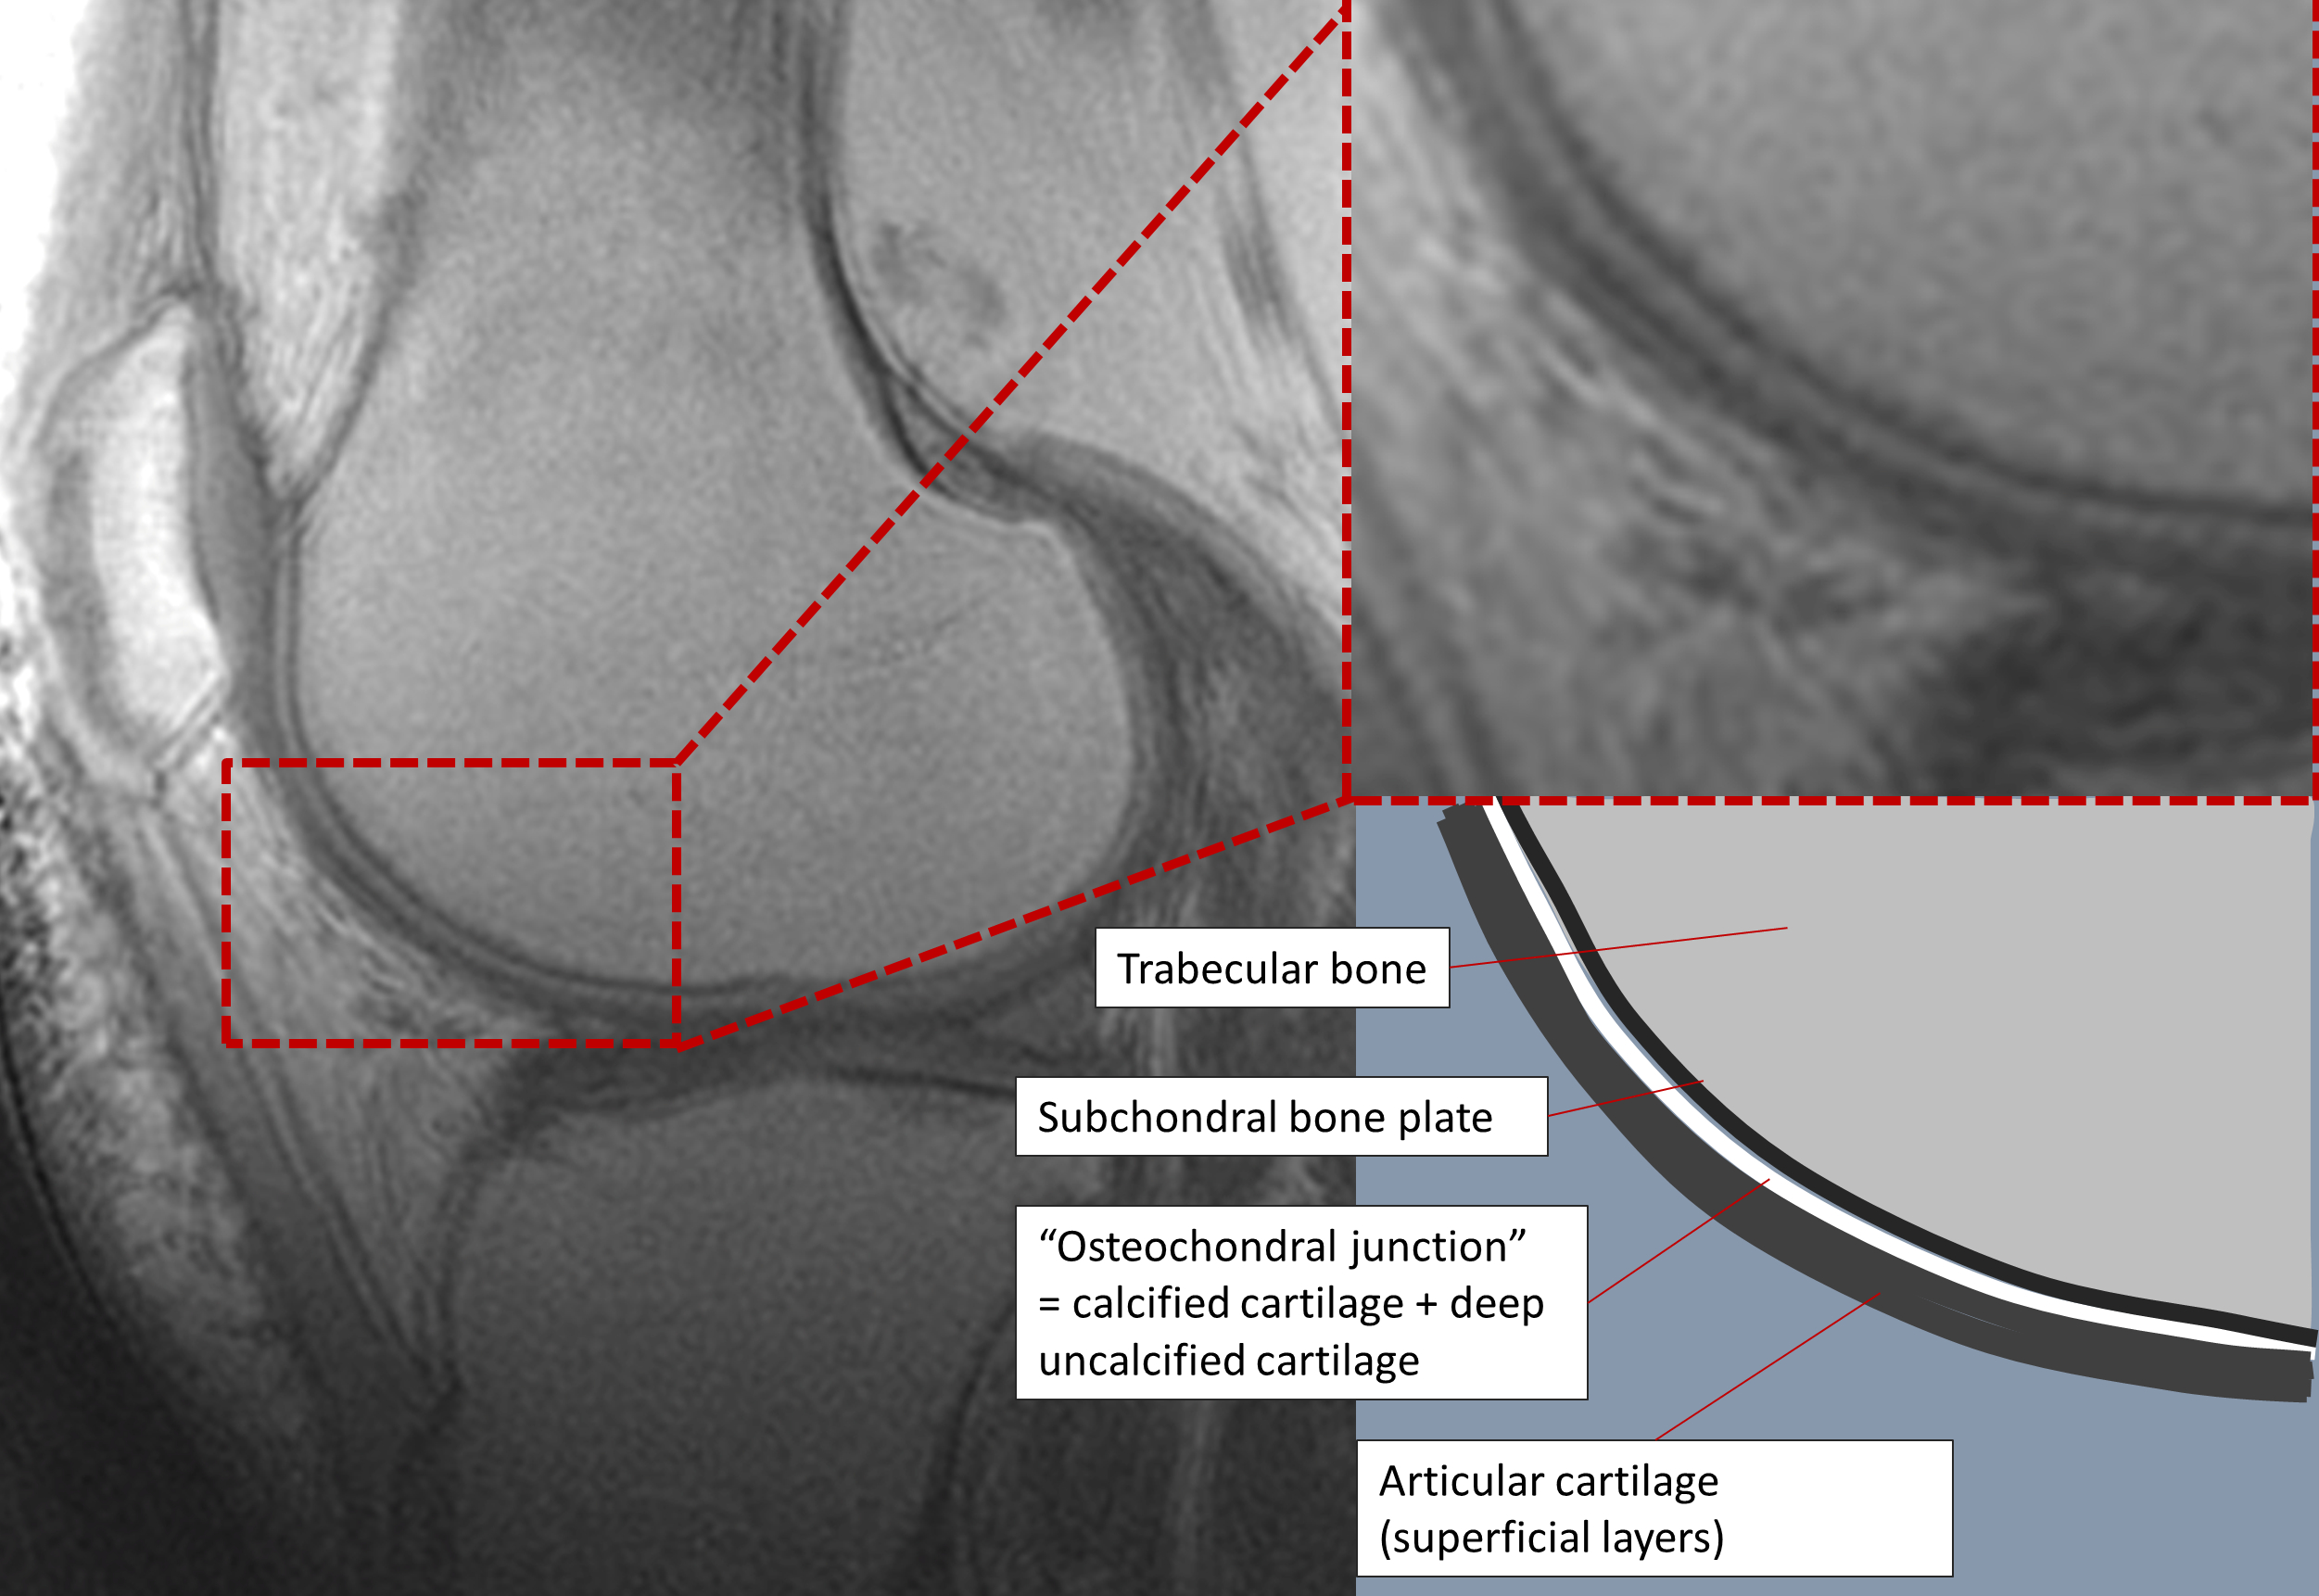
Figure 1 - Sagittal UTE image through the lateral compartment of a healthy volunteer demonstrating the normal appearance of the osteochondral junction (left panel) with enlarged view (top right) and schematic representation (bottom right).
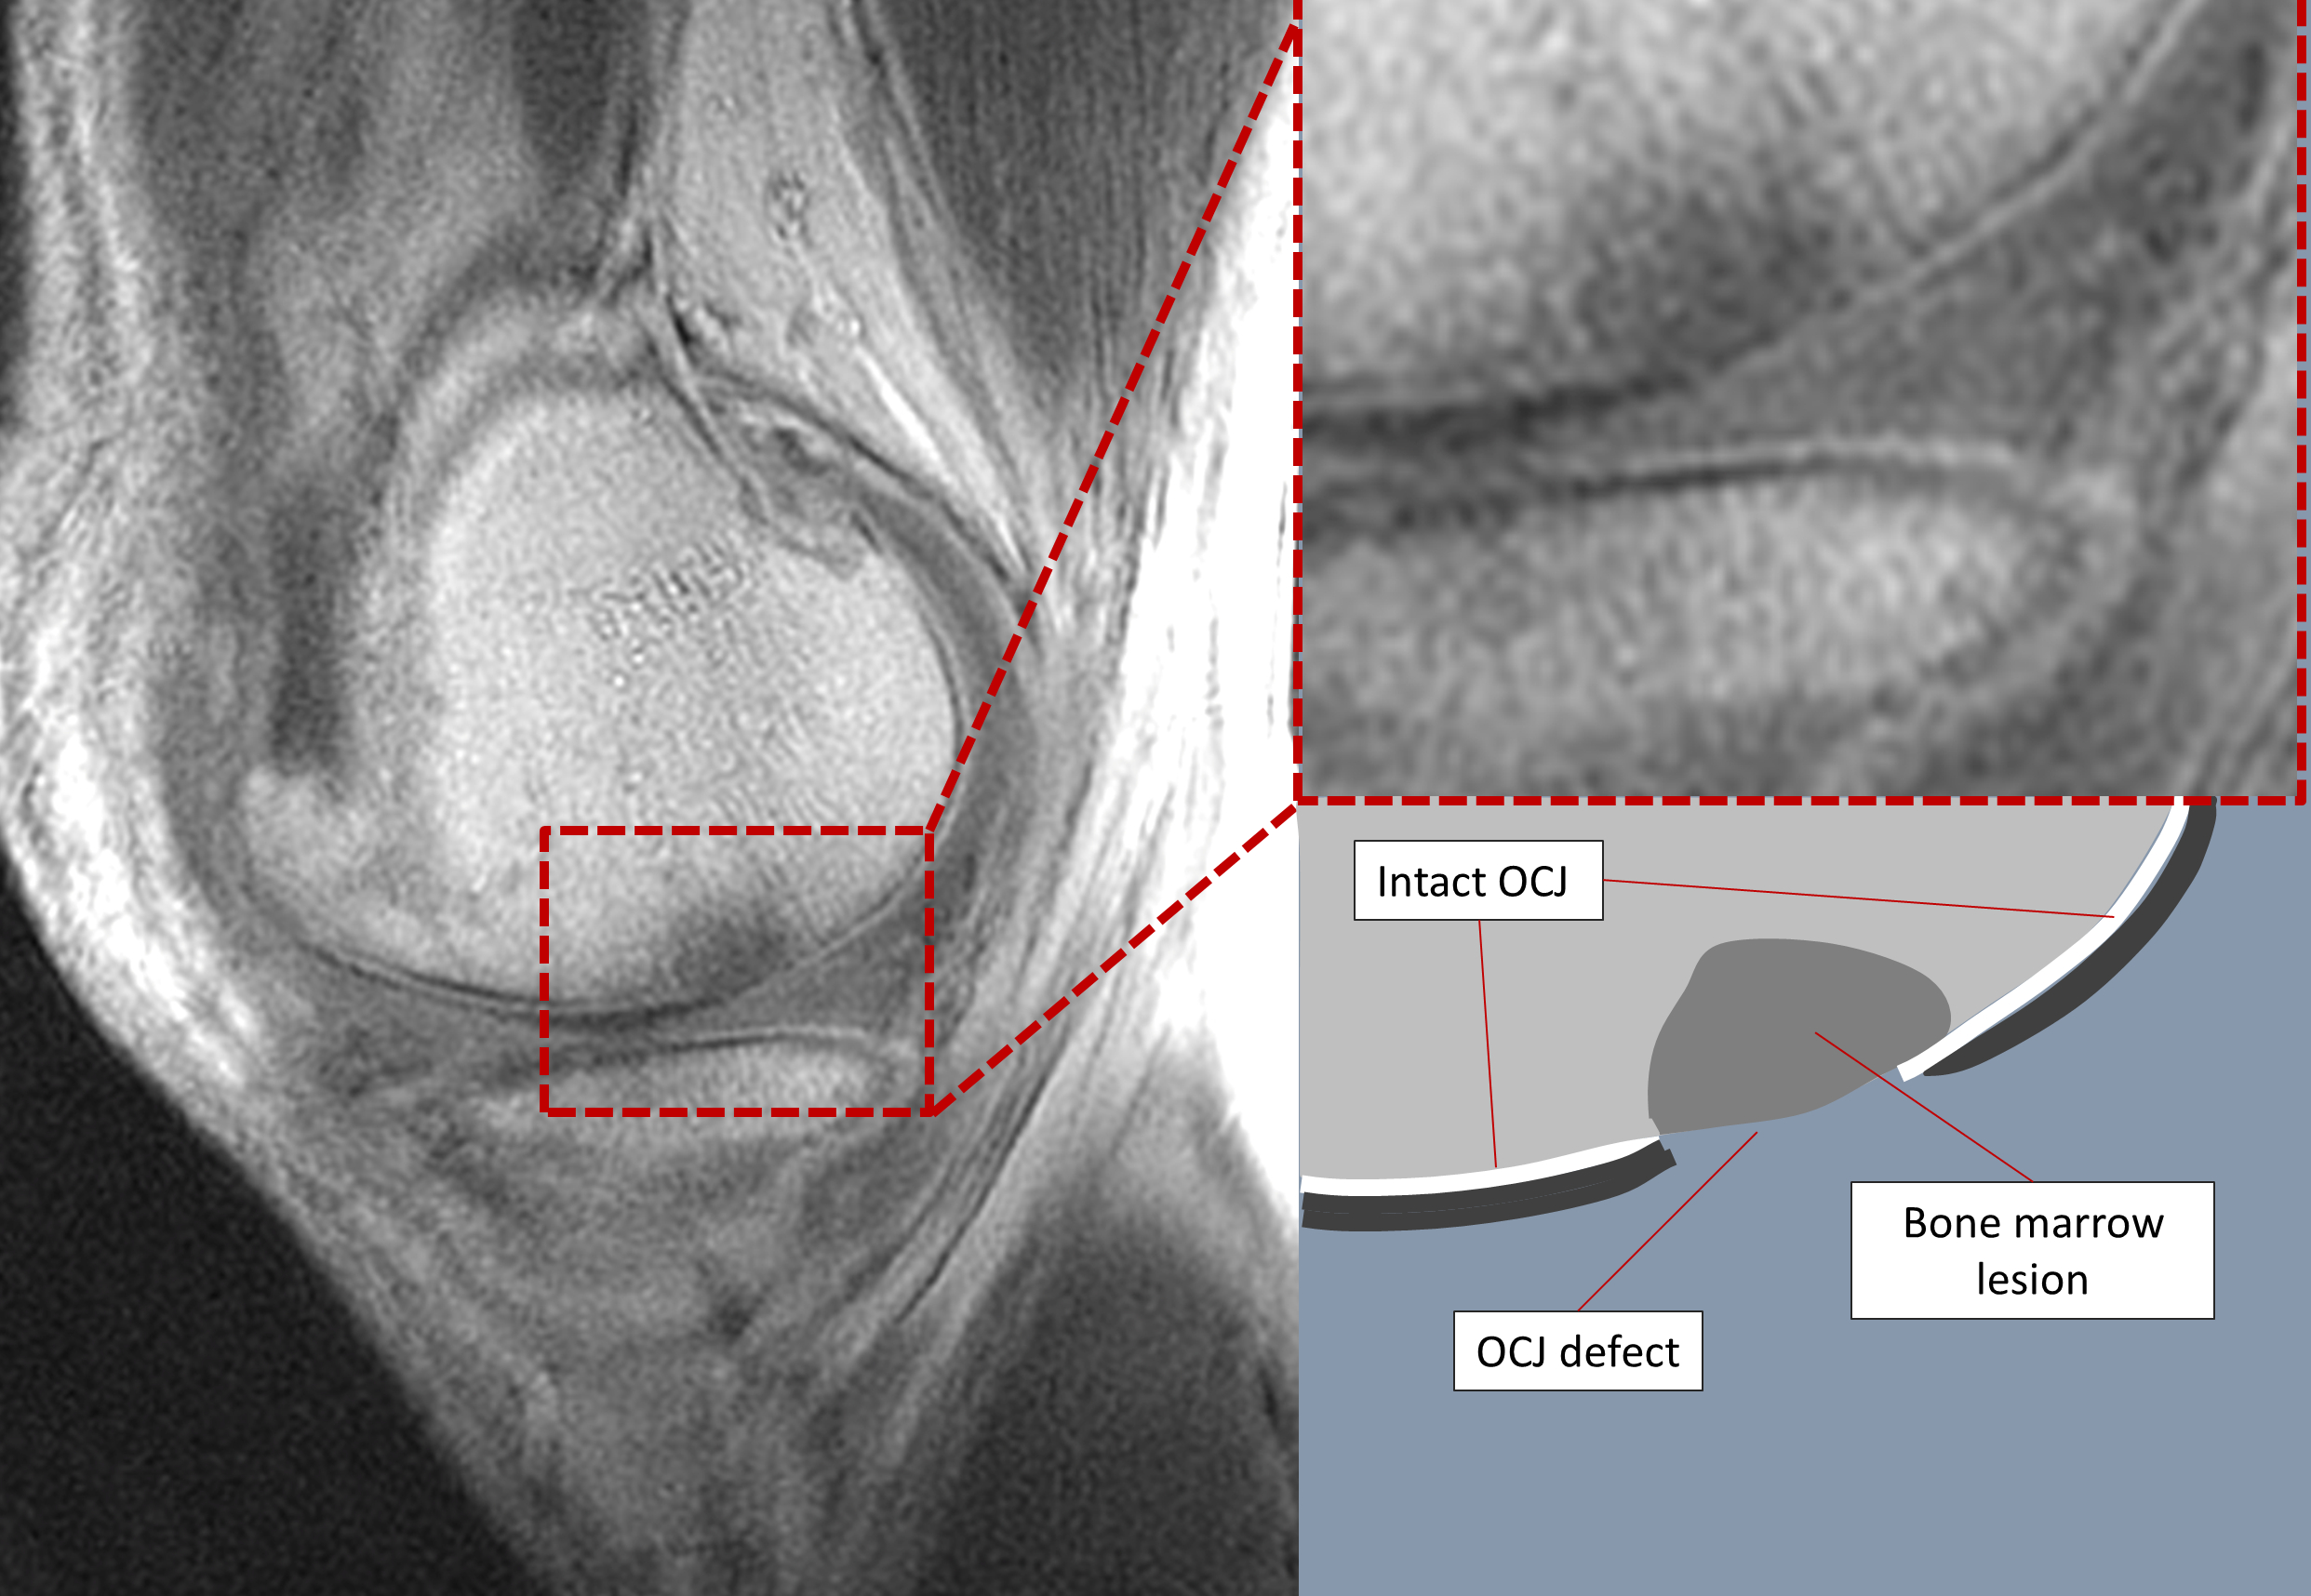
Figure 2 - Sagittal UTE image through the medial compartment of an OA subject demonstrating an OCJ defect (left), with enlarged view (top right) and schematic representation (bottom right).
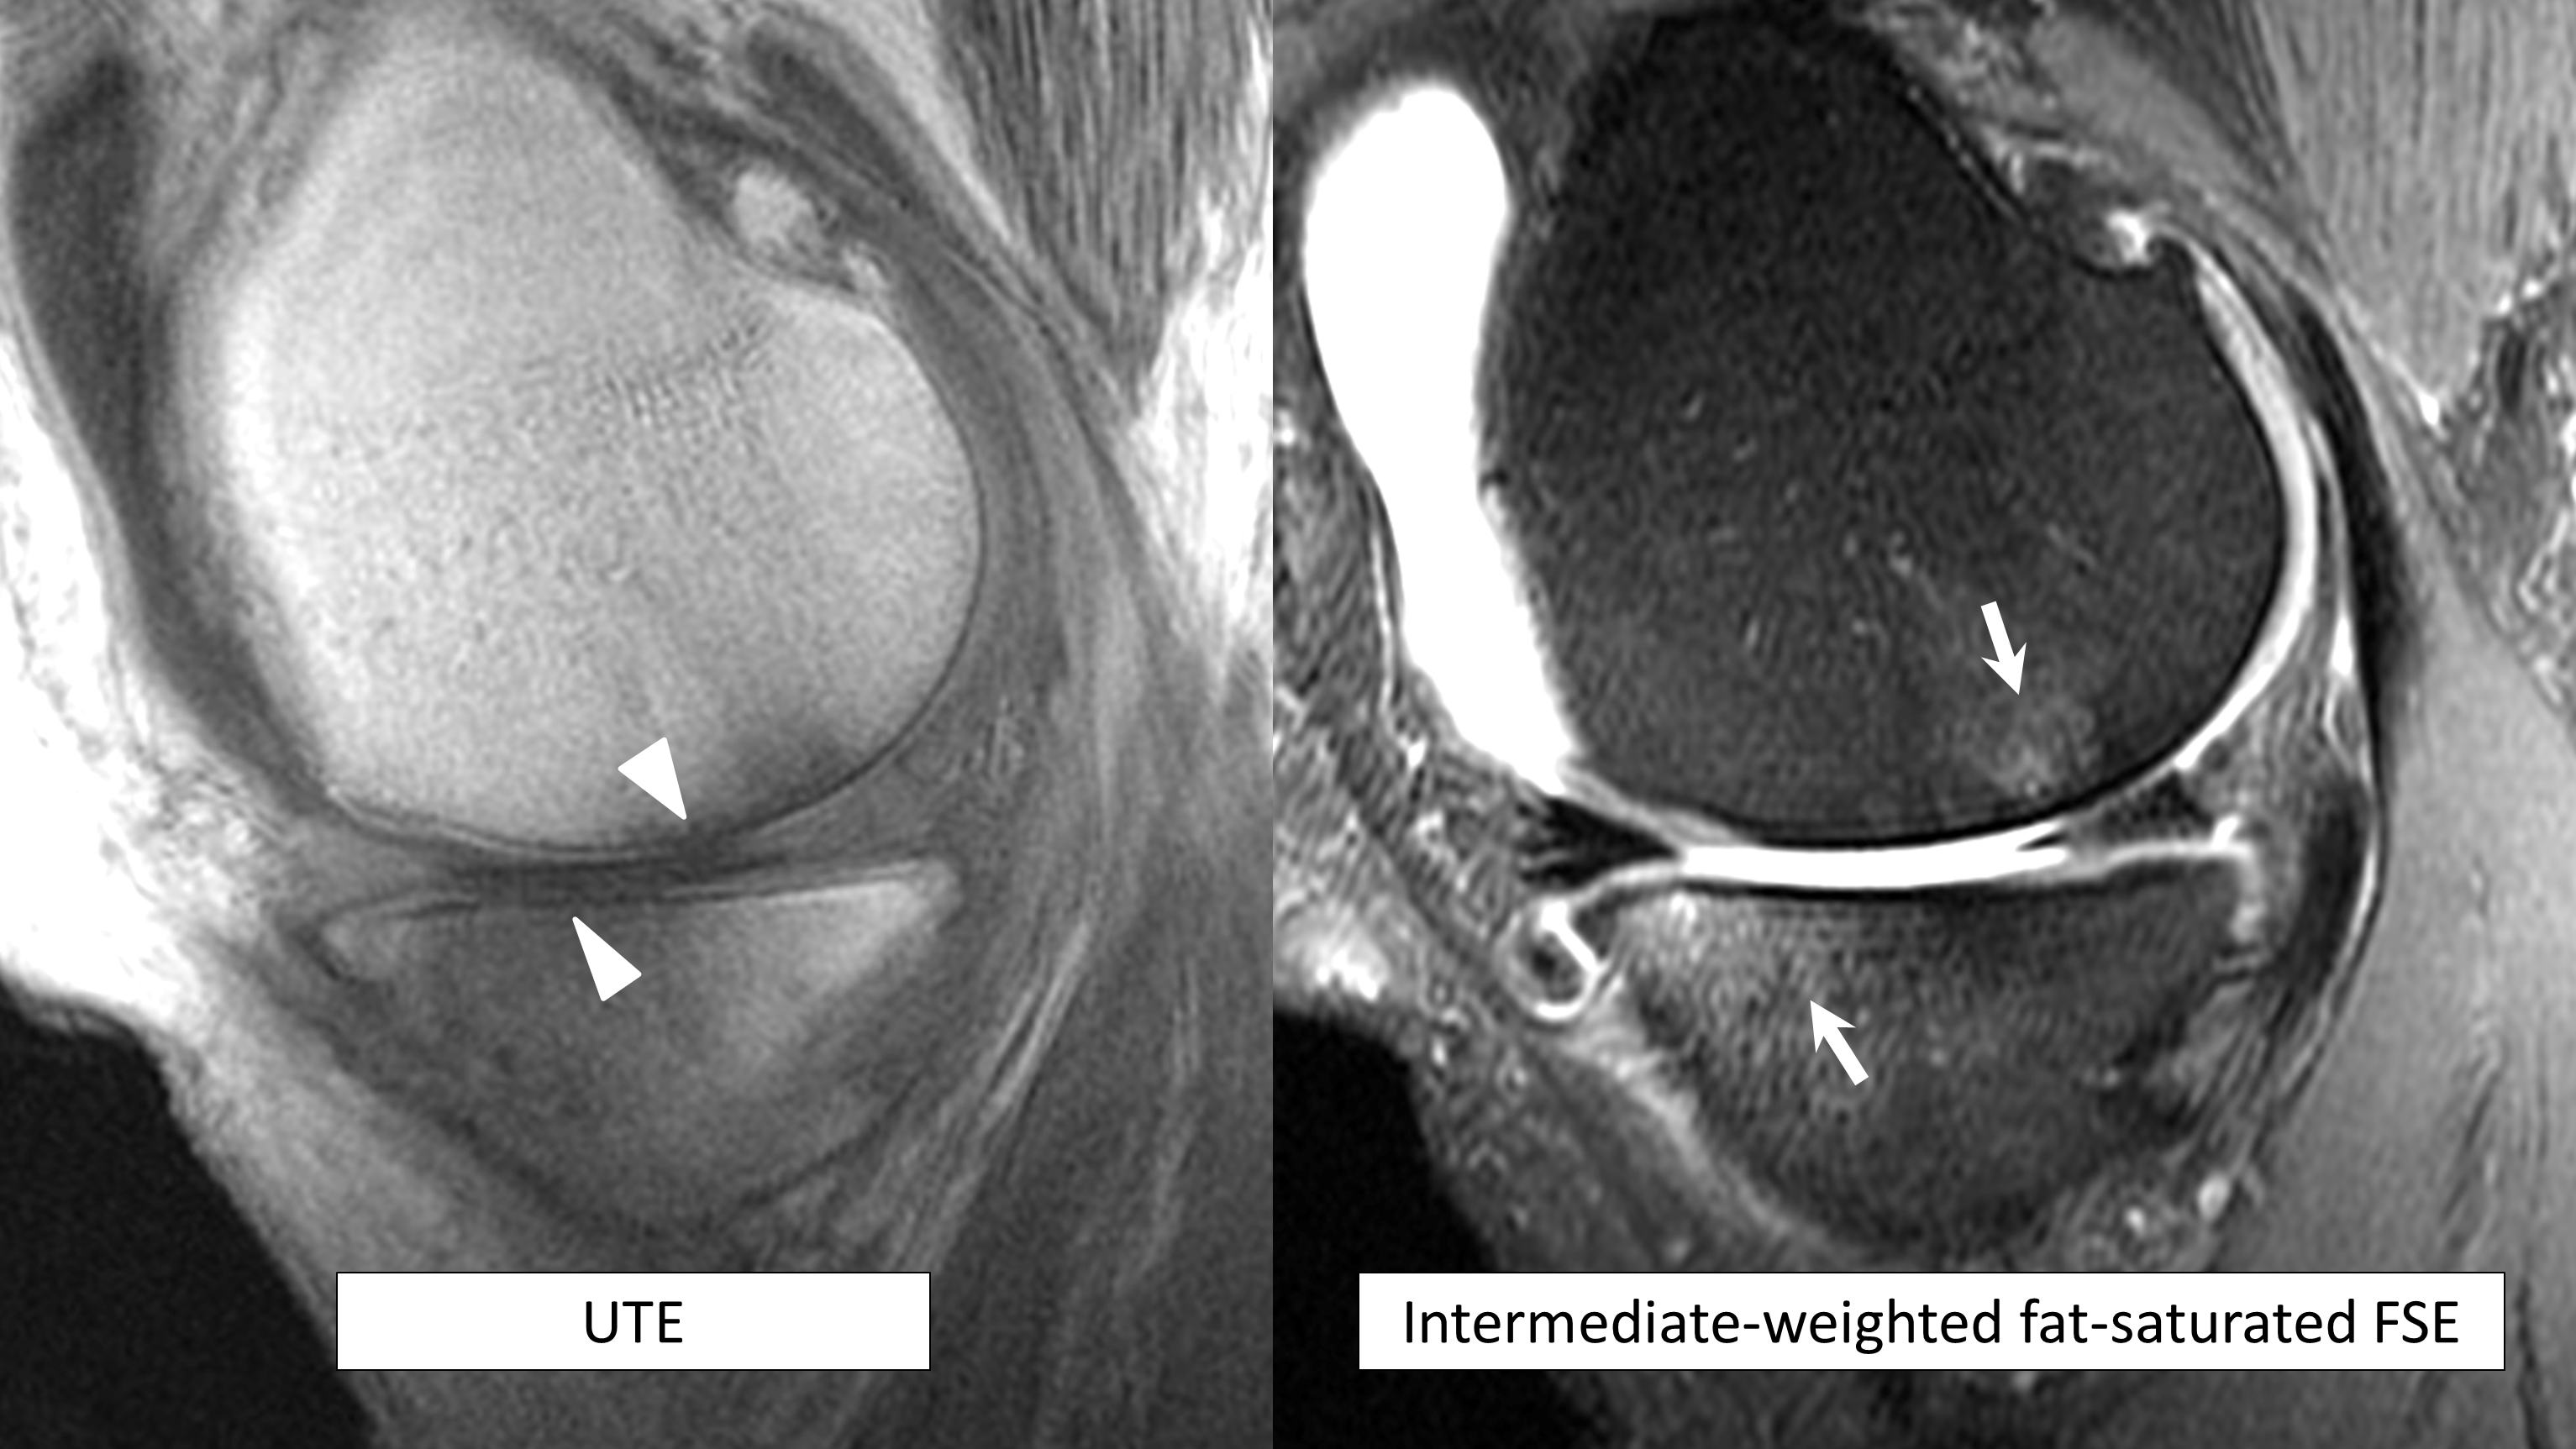
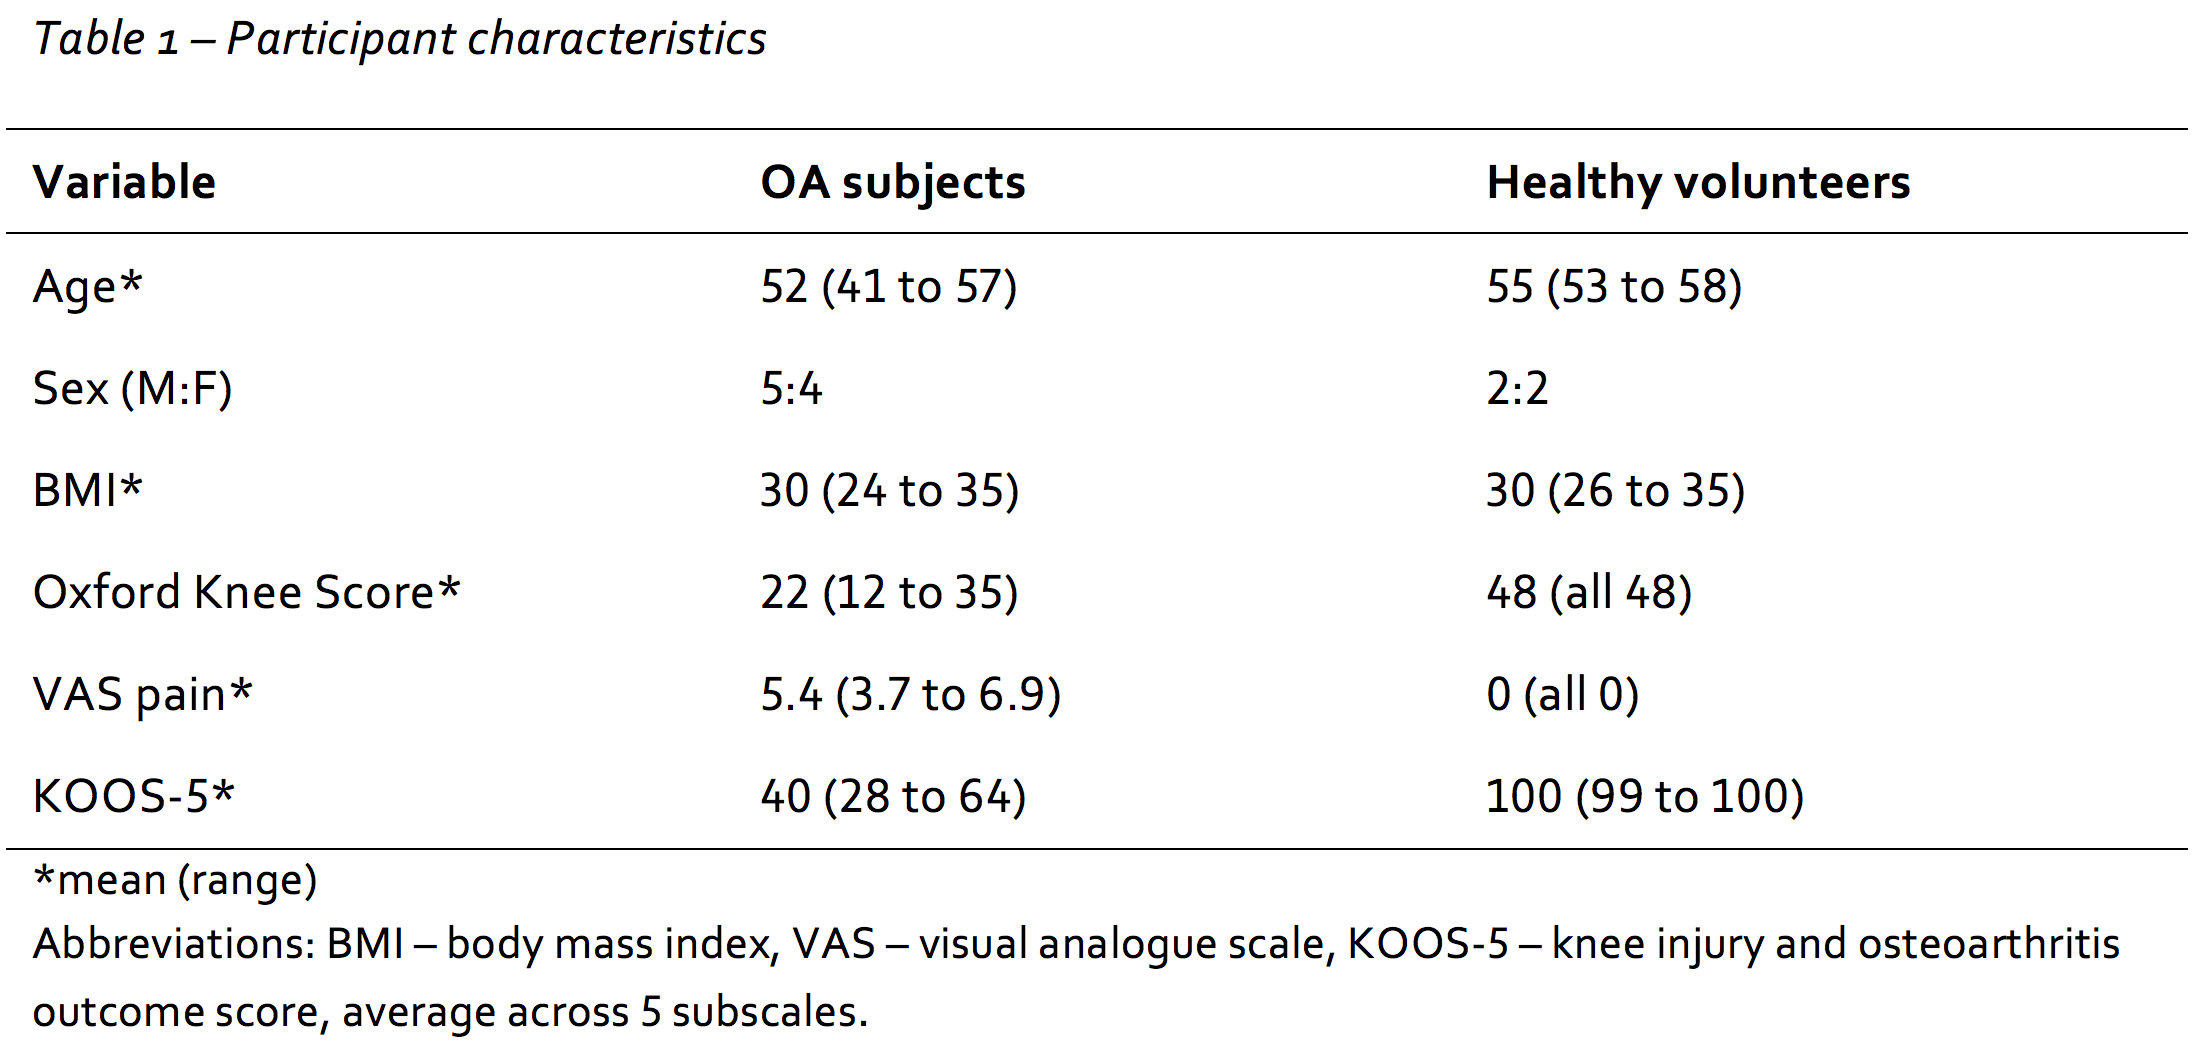
Table 1 - Participant Characteristics.
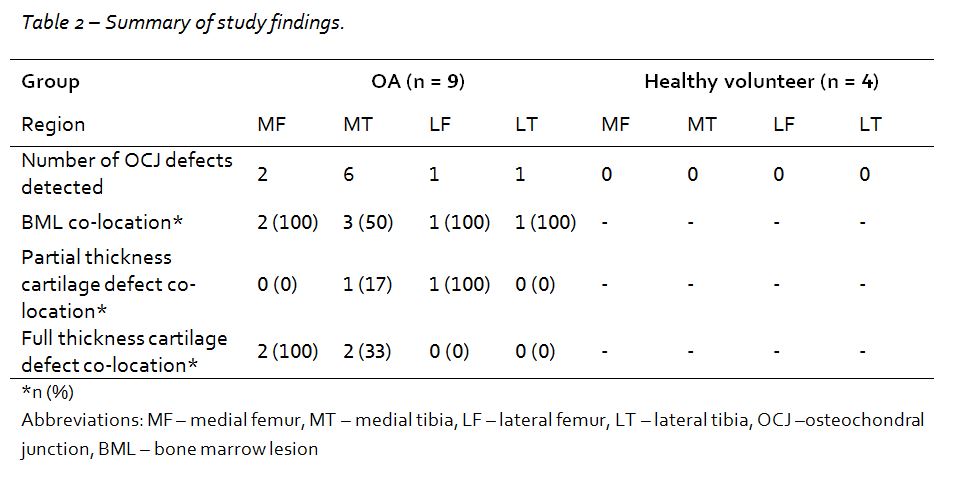
Table 2 - Summary of study findings. For purposes of clarity, the subregions scored have been condensed into 4 larger regions. Each of these larger regions contains 3 subregions, corresponding to anterior, central and posterior divisions.