0458
Three Dimensional Adiabatic T1rho Prepared Ultrashort Echo Time Cones (3D AdiabT1rho UTE-Cones) Sequence for Whole Knee Imaging1University of California, San Diego, San Diego, CA, United States, 2GE Healthcare, San Diego, CA, United States, 3VA San Diego Healthcare System, San Diego, CA, United States
Synopsis
To propose a combination of a three dimensional ultrashort echo time sequence employing cones trajectories with an AdiabT1rho preparation (3D AdiabT1rho UTE-Cones) for volumetric T1rho assessment of both short and long T2 tissues in the knee joint on a clinical 3T scanner. Simulation, phantom, ex vivo and in vivo studies were carried out in this feasibility study.
Introduction
Loss of proteoglycans (PGs) in articular cartilage is a significant early change in osteoarthritis (OA). Spin lattice relaxation in the rotating frame (T1rho) has been proposed as a sensitive MR imaging biomarker of PG content in cartilage 1. However, regular spin-lock based T1rho imaging is sensitive to the magic angle effect, and cannot evaluate short T2 tissues such as deep cartilage, menisci, ligaments and tendons 2,3. Recently, a novel imaging technique was developed in which trains of adiabatic inversion pulses are used to generate T1ho relaxation (AdiabT1rho), which has been reported to be less sensitive to the magic angle effect 4. In this study we propose a combination of a three dimensional ultrashort echo time sequence employing cones trajectories with an AdiabT1rho preparation (3D AdiabT1rho UTE-Cones) for volumetric T1rho assessment of both short and long T2 tissues in the knee joint on a clinical 3T scanner. Simulation, phantom, ex vivo and in vivo studies were carried out in this feasibility study.Method
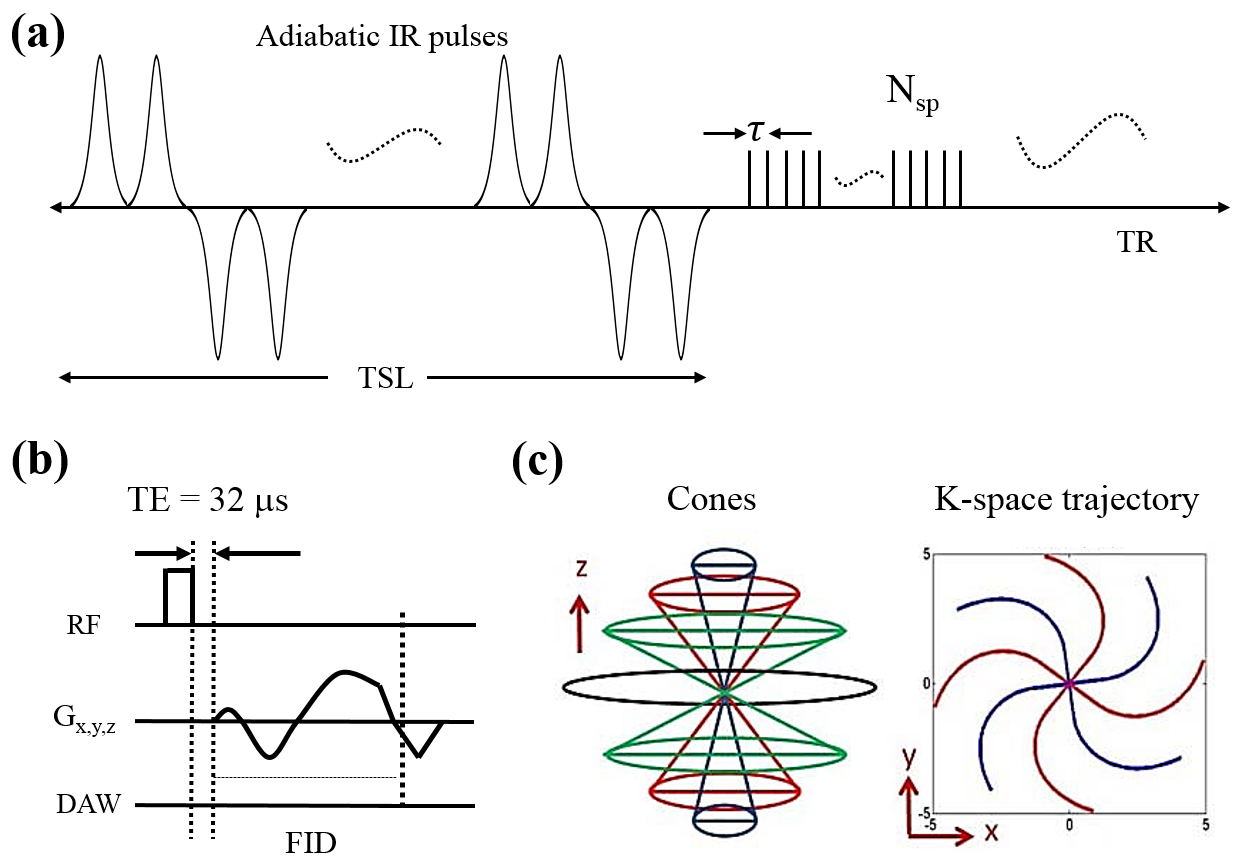
Features of the 3D AdiabT1rho UTE-Cones pulse sequence used in this study are shown in Figure 1. An even number (NIR) of adiabatic inversion pulses (IR) are used for AdiabT1rho preparation. When NIR is a multiple of four, then every four consecutive adiabatic IR pulses follow a MLEV4 phase cycling scheme 5. Following the AdiabT1rho preparation are Nsp separate k-space spokes or acquisitions with an equal time interval for fast data acquisition. A short rectangular pulse (duration of 26 to 52 µs) is used for non-selective signal excitation in each spoke (Fig. 1B), followed by 3D spiral trajectories with conical view ordering (Fig. 1C) 6.
At steady state, the signal equation is expressed as follows when a single acquisition (Nsp = 1) is obtained after AdiabT1rho preparation:
\[S(TSL)=M_0\sin(\alpha)\frac{e^{-TSL/T_{1\rho}}(1-e^{-(TR-TSL)/T_{1}})}{1-e^{-TSL/T_{1\rho}}e^{-(TR-TSL)/T_{1}}\cos(\alpha)}+C[1]\]
Where M0 is the equilibrium state magnetization and α is the excitation flip angle. A constant C is induced to account for noise and artifacts. For multispoke acquisitions, we modified Eq. [1] by simply changing cos(α) to cosNsp(α) to account for the saturation effect of Nsp acquisitions, which is expressed as follows 7:
\[S(TSL)=M_0\sin(\alpha)\frac{e^{-TSL/T_{1\rho}}(1-e^{-(TR-TSL)/T_{1}})}{1-e^{-TSL/T_{1\rho}}e^{-(TR-TSL)/T_{1}}\cos^{N_{sp}}(\alpha)}+C[2]\]
A phantom was prepared as 2% w/v agarose gel containing 0.1 mM MnCl2. A 3D UTE-Cones actual flip angle imaging (AFI) sequence and a variable flip angle (VFA) sequence were employed for B1 mapping and T1 measurement, respectively 8. The following parameters were used for 3D AdiabT1rho UTE-Cones: TR=500 ms, FA=10°, matrix=128×128×20, NIR=0,2,4,6,8,12 and 16, Nsp=1,5,15,25,35 and 45.
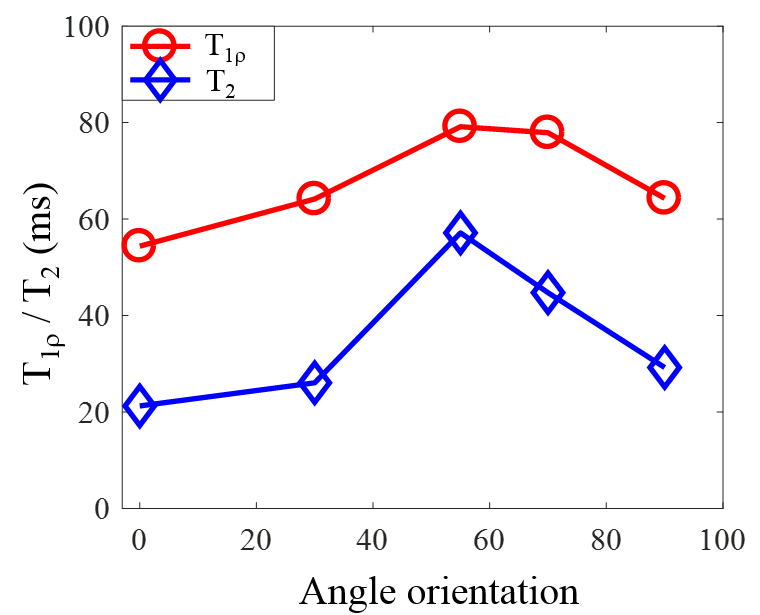
Magic angle effect study for both T1rho and T2 was carried out by imaging a sliced human patellar sample (around 4 mm thick). The sample was imaged with five angular orientations (i.e. 0°, 30°, 55°, 70° and 90°) between the primary collagen fiber direction in the middle zone of the articular cartilage and the main field . For each angular orientation, 3D AdiabT1rho UTE-Cones and 2D CPMG sequences were used for T1rho and T2 measurements, respectively. The sequence parameters were: FOV=5×5×2 cm3, matrix=128×128×10, bandwidth=83.3 kHz, TR=1000 ms, FA=10°, Nsp=5, NIR=0,4,8,12,16 and 20.
Ex vivo (n=4) and in vivo (n=6) knees were imaged with the following parameters: FOV=15×15×10.8 cm3, bandwidth=166 kHz, TR=500 ms, FA=10°, matrix=256×256×36, Nsp=25, NIR=0,2,4,6,8,12 and 16 each with a scan time of 2 min 34 sec. UTE-Cones AFI data were acquired with TR1/TR2=20/100 ms, FA=45°, matrix=128×128×18, scan time of 4 min 57 sec. VFA UTE-Cones data were acquired with TR=20 ms, FA=5°,10°,20° and 30°, matrix=256×256×36, scan time of 9 min 28 sec;
Results and Discussion
Figure 2 shows the phantom results. The original model shows increased errors with higher Nsp, while the modified model only increased very slightly with higher Nsp.
Figure 3 shows the magic angle effect in AdiabT1rho UTE-Cones imaging. T2 increased by approximately 200 % as the angle increased from 0° to 55°. AdiabT1rho only increased by approximately 50%.
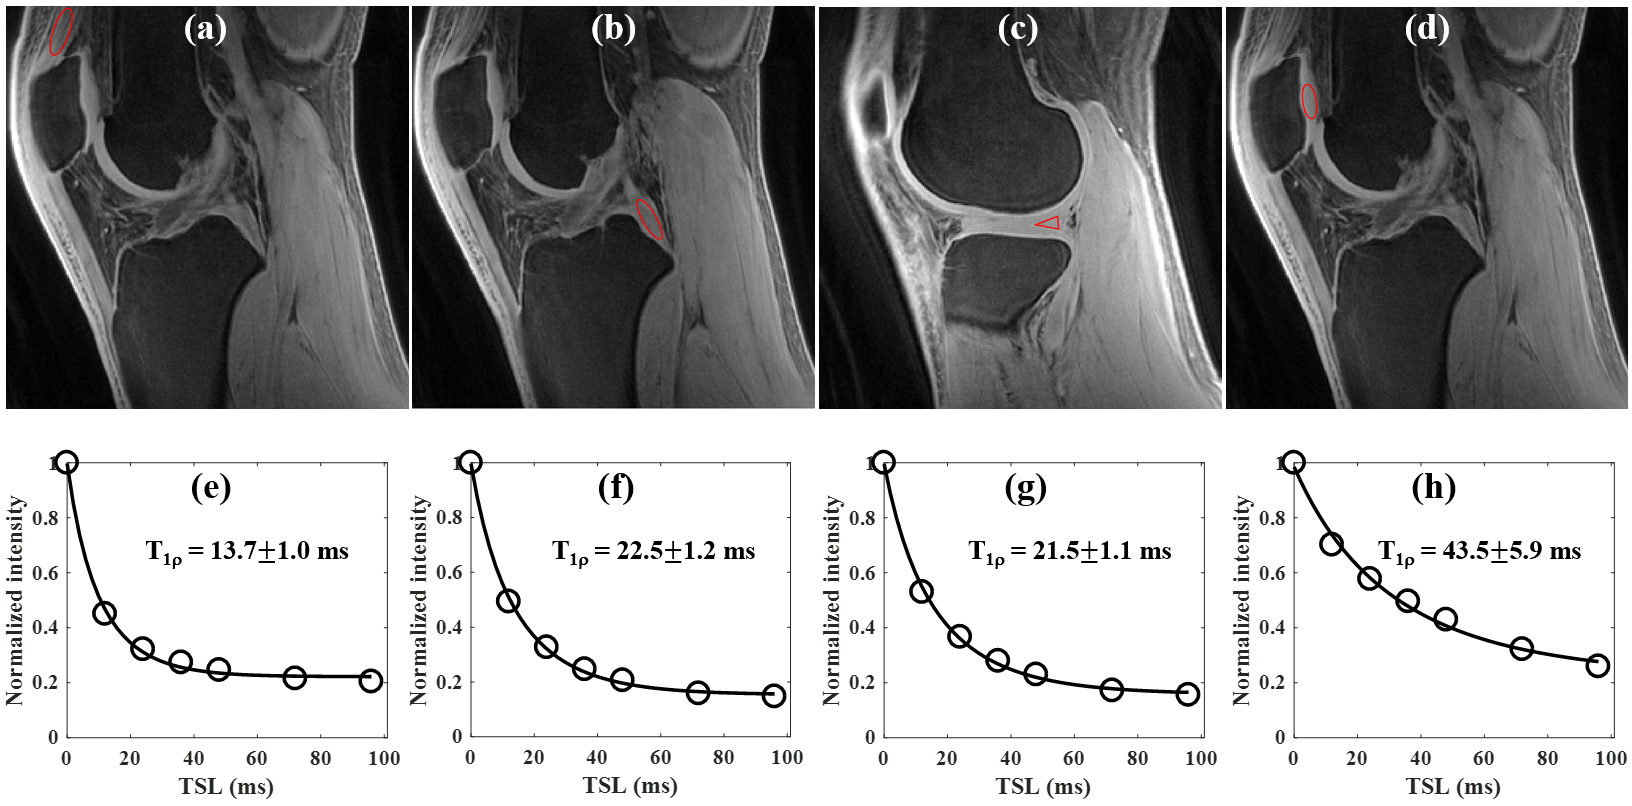
Figure 4 shows knee study of a 23y volunteer. Excellent AdiabT1rho fitting was achieved demonstrating a T1rho of 13.7±1.0 ms for the quadriceps tendon, 22.5±1.2 ms for the PCL, 21.5±1.1 ms for the meniscus and 43.5±5.9 ms for the patellar cartilage.
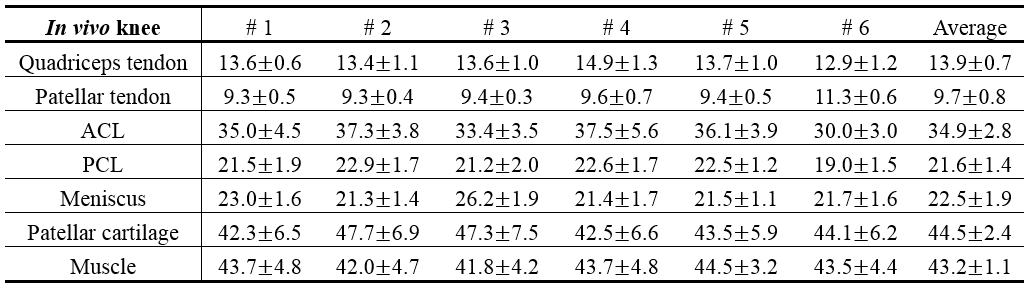
Table 1 summarizes the T1rho values for quadriceps tendon, patellar tendon, ACL, PCL, meniscus, patellar cartilage and muscle of the six in vivo knees.
Conclusion
The 3D AdiabT1rho UTE-Cones technique provides robust volumetric quantitative T1rho measurement of both short and long T2 tissues including quadriceps tendon, patellar tendon, ACL, PCL, meniscus, patellar cartilage and muscle in the knee joint. The AdiabT1rho values are relatively insensitive to the magic angle effect.Acknowledgements
The authors acknowledge grant support from GE Healthcare, NIH (T32EB005970, 1R01 AR062581 and 1R01 AR068987 and) and the VA Clinical Science R&D Service (1I01CX001388).References
1. Li X, Ma B, Link TM, et al. In vivo T1ρ and T2 mapping of articular cartilage in osteoarthritis of the knee using 3 T MRI. Osteoarthritis Cartilage 2007;15:789-797.
2. Du J, Statum S, Znamirowski R, Bydder GM, Chung CB. Ultrashort TE T1ρ magic angle imaging. Magn Reson Med 2013;1:69(3):682-7.
3. Shao H, Pauli C, Li S, Ma Y, Tadros AS, Kavanaugh A, Chang EY, Tang G, Du J. Magic angle efect plays a major role in both T1rho and T2 relaxation in articular cartilage. Osteoarthritis Cartilage 2017;doi:10.1016/j.joca.2017.01.013.
4. Hänninen N, Rautiainen J, Rieppo L, Saarakkala S, Nissi MJ. Orientation anisotropy of quantitative MRI relaxation parameters in ordered tissue. Scientific Reports 2017;doi: 10.1038/s41598-017-10053-2.
5. Levitt MH, Freeman R, Frenkiel T. Supercycles for broad-band heteronuclear decoupling. J Magn Reson 1982;50(1):157–160.
6. Carl M, Bydder GM, Du J. UTE imaging with simultaneous water and fat signal suppression using a time-efficient multispoke inversion recovery pulse sequence. Magn Reson Med 2016;76:577–582.
7. Ma YJ, Chang EY, Carl M, Du J. Quantitative magnetization transfer ultrashort echo time imaging using a time-efficient 3D multispoke Cones sequence. Magn Reson Med 2017;doi:10.1002/mrm.26716.
8. Ma Y, Lu X, Carl M, Zhu Y, Chang EY, Du J. Accurate T1 mapping for Short T2 Tissues using 3D Ultrashort Echo Time Cones Actual Flip Angle-Variable TR Method. ISMRM Workshop: Advanced Musculoskeletal MRI: Arthritis & Beyond 2017, Hangzhou, China.
Figures