0456
Cerebral Metabolite Changes and Sleep Correlates in Obstructive Sleep Apnea1Radiological Sciences, David Geffen School of Medicine at UCLA, Los Angeles, CA, United States, 2School of Nursing, David Geffen School of Medicine at UCLA, Los Angeles, CA, United States, 3Radiological Sciences, UCLA School of Medicine, Los angeles, Los Angeles, CA, United States, 4Medicine, David Geffen School of Medicine at UCLA, Los Angeles, CA, United States, 5Neurobiology, David Geffen School of Medicine at UCLA, Los Angeles, CA, United States
Synopsis
Obstructive sleep apnea (OSA) is a chronic, multisystem sleep disorder that has been linked with dementia, stroke and increased risks of cardiovascular disease. Continuous positive airway pressure (CPAP) is the most common treatment method for OSA patients, but its effect on different organ systems and to reverse the rate of cognitive decline is still unclear. In this study, we evaluated neurochemical changes of untreated and CPAP treated OSA patients versus healthy controls in twelve brain regions using a semi-laser based accelerated five-dimensional (5D) echo-planar J-resolved spectroscopic imaging (EP-JRESI) sequence. We also explored the relationship between brain metabolite ratios and apnea hypopnea index (AHI), a measure indicative of the severity of sleep apnea. We observed significant differences of several metabolites in many brain regions. We also found that, among other metabolites, AHI correlated positively with lactate in right parietal insular cortex. This may be the result of hypoxemia and tissue hypoxia during sleep caused by OSA. To validate our findings, further longitudinal studies using a large cohort of OSA subjects before and after CPAP are required.
Introduction:
Obstructive sleep apnea (OSA) is a chronic, multisystem sleep disorder1 linked with dementia, stroke and increased risk of cardiovascular disease2. Continuous positive airway pressure (CPAP) is the most common treatment method for OSA patients and is partially effective in halting the onset symptoms, and slowing disease progression3,4. However, the effect CPAP has on different organ systems and on reversing the rate of cognitive decline is still unclear. Several structural neuroimaging studies have examined the impact of CPAP treatment on OSA patients5-8. Although there have been studies showing metabolite changes in untreated OSA9-12, there are few metabolite study on CPAP treated patients, and those only use 1D MRSI8. In this study, we evaluated neurochemical changes of untreated and CPAP treated OSA patients versus healthy controls in several brain regions using a semi-laser based accelerated five-dimensional (5D) echo-planar J-resolved spectroscopic imaging (EP-JRESI)13 sequence. We also explored the relationship between brain metabolite ratios and apnea hypopnea index (AHI), a measure indicative of the severity of sleep apnea.Materials and Methods:
We investigated eight healthy volunteers (HV) (age 50.5±15.3years), eight untreated OSA patients (OSAb) (age 51.8±15.5years), and eight separate OSA patients with minimum 3 months of CPAP (OSACPAP) (age 57.2±9.0years). All data were collected on a Siemens 3T Prisma MRI scanner running on the VD13D platform using a 16 channel head receive coil. The following parameters were used for water-suppressed 5D EP-JRESI: TR/TE=1.2s/40ms, voxel resolution=1.5x1.5x1.5cm3, 64∆t1 increments, 512 bipolar echo pair, FOV=24x24x12cm3, 1 average, non-uniform sampling=12.5% with a scan time≈20 min. A maximum echo sampling scheme was applied14 and after postprocessing spectral bandwidths were ±250Hz along F1 and 1190Hz along F2. This was followed by a non water-suppressed scan with only the first t1 increment. The undersampled data were reconstructed as discussed previously13. Before each EP-JRESI scan, 3D high resolution T1-weighted images for localization were collected using an MP-RAGE pulse sequence. Acquired data were post-processed with a custom MATLAB-based program and metabolite ratios with respect to the 3.0 ppm creatine (Cr) peak were calculated using a modified version of ProFit algorithm15. The metabolite differences between the three groups were tested in 12 regions with student’s t-test (significant level, p <0.05). Additionally, to explore for any relationship between the metabolite ratios and apnea hypopnea index AHI, Pearson correlation was performed on the patient data from the regions where metabolite differences were found. All statistical analysis was done using the SPSS software (Version 24.0, SPSS Inc, Chicago, IL, USA).Results and Discussion:
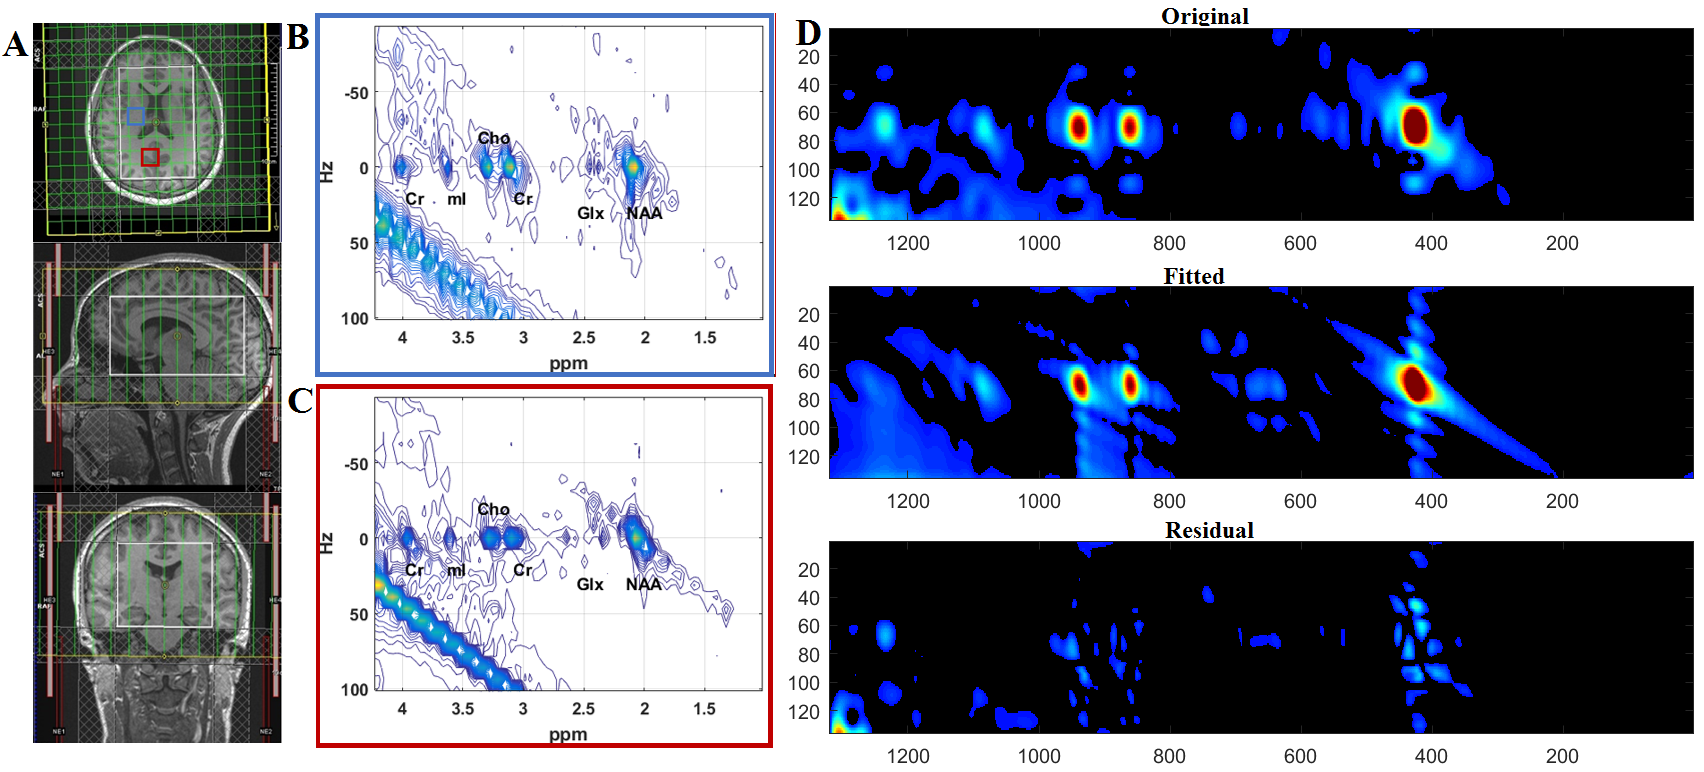
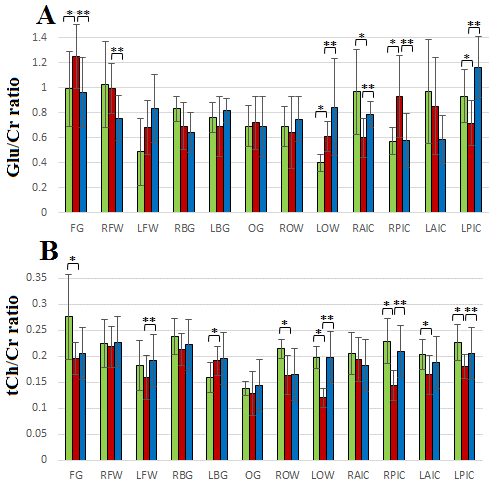
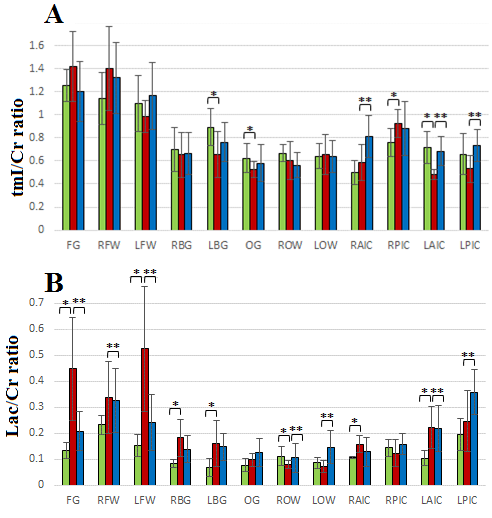
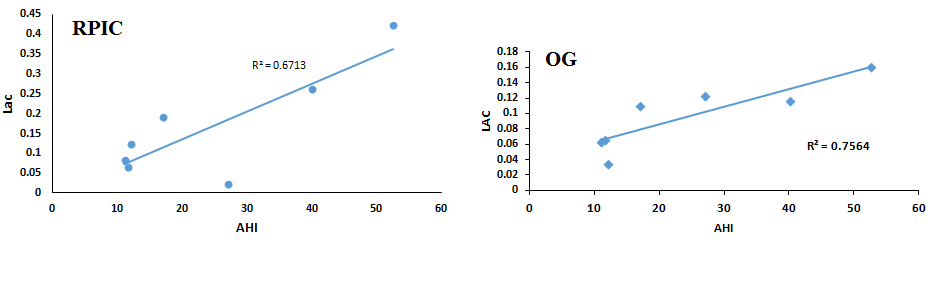
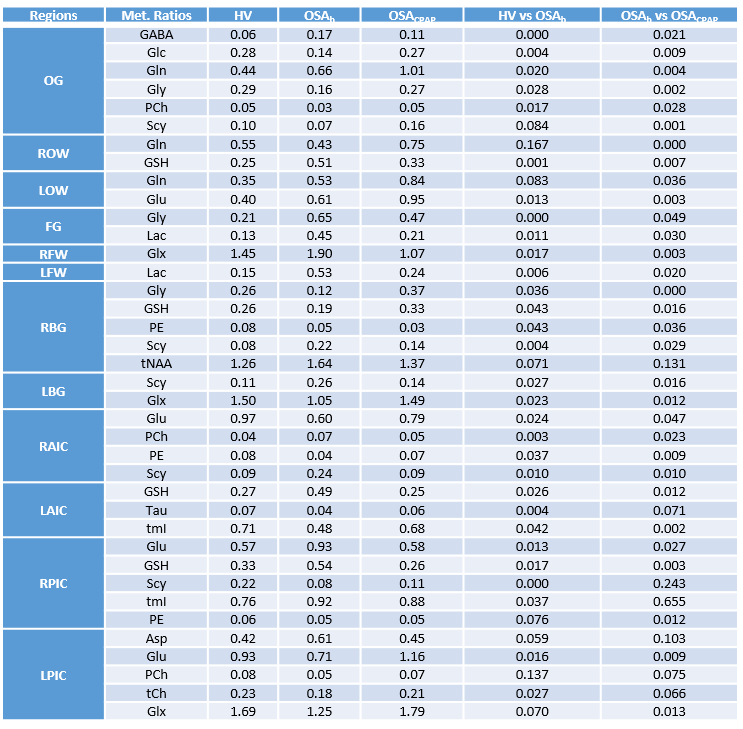
Figure 1(A) shows the PRESS-localized volume of interest on a T1-weighted axial brain MRI of a healthy volunteer brain. Representative 2D J-resolved spectra extracted from the right basal ganglia (RBG) and occipital gray (OG) regions of the same subject are shown in Figure 1(B) with 1(C) showing the ProFit fitting results. Figures 2 and 3 show the selected metabolite ratios with respect to Cr in HV, OSAb and OSACPAP respectively. Additionally, summaries of the metabolite ratios for the 12 regions are in Table 1. Figure 4 shows the scatter plot of AHI and metabolite ratios in the RPIC and OG in the baseline OSA subjects. We found AHI correlated positively with lactate in right parietal insular cortex, GABA in left parietal insular cortex, and lactate (Lac) in OG. Negative correlations were found with GABA in right parietal insular cortex, glutamine (Gln) in OG and total choline (tCh) in right frontal white.
In summary, we observed changes in OSA with and without CPAP treatment in metabolite ratios of GABA, glucose (Glc), Gln, glycine (Gly), phosphocholine (PCh), scyllo inositol (Scy), glutathione (GSH), glutamate (Glu), Glx (Glu+Gln), Lac, phosphoethanolamine (PE), tNAA (NAA, N-acetylaspartate + NAAG, N-acetylaspartylglutamate, tmI (myo inositol + glycine), taurine, and aspartate in different brain regions. Most differences appeared reversed in the OSA patients on CPAP. However, differences in some regions were not reversed completely, perhaps due to residual effects of many years of OSA.
Lactate is considered to be a marker of tissue hypoxia. Our observation of increased lactate in OSA patients and positive correlation with the degree of hypoxia is in agreement with previous findings16,17. This may be the result of hypoxemia and tissue hypoxia during sleep caused by OSA. Also, it is noted that in the pressure of sleep-associated hypoxemia in OSA patients, conversion of pyruvate to lactate by the process of anaerobic glycolysis conversion of pyruvate to lactate occurs17.
Conclusion:
Our findings are consistent with the known phenomenon of oxidative stress in OSA and reversibility of neurofunctional changes after CPAP. Further studies using a large number of longitudinal subjects before and after CPAP are required.Acknowledgements
This research was supported by NHLBI 1R56131010-01A1 and NINR 5R0101369305.References
1. Malhotra A, White DP. Obstructive sleep apnoea. Lancet 2002;360:237–45.
2. Anderson KN, Bradley AJ. Sleep disturbance in mental health problems and neurodegenerative disease Nat Sci Sleep 2013:5:61–75.
3. Pornsriniyom D., Shinlapawittayatorn K., Fong J., Andrews N.D., Foldvary-Schaefer N. Continuous positive airway pressure therapy for obstructive sleep apnea reduces interictal epileptiform discharges in adults with epilepsy. Epilepsy Behav. 2014;37:171–174.
4. Campos-Rodriguez F., Martinez-Garcia M.A., Reyes-Nunez N., Caballero-Martinez I., Catalan-Serra P., Almeida-Gonzalez C.V. Role of sleep apnea and continuous positive airway pressure therapy in the incidence of stroke or coronary heart disease in women. Am. J. Respir. Crit. Care Med. 2014;189(12):1544–1550.
5. Zimmerman M.E., Aloia M.S. A review of neuroimaging in obstructive sleep apnea. J. Clin. Sleep Med 2006;2(4):461–471
6. Canessa N, Castronovo V, Cappa SF, et al. Obstructive sleep apnea: brain structural changes and neurocognitive function before and after treatment. Am J Respir Crit Care Med 2011;183(10):1419-26.
7. Huynh NT, Prilipko O, Kushida CA, Guilleminault C. Volumetric Brain Morphometry Changes in Patients with Obstructive Sleep Apnea Syndrome: Effects of CPAP Treatment and Literature Review. Front Neurol 2014;5:58.
8. O'Donoghue FJ, Wellard RM, Rochford PD, et al. Magnetic resonance spectroscopy and neurocognitive dysfunction in obstructive sleep apnea before and after CPAP treatment. Sleep 2012;35(1):41-8.
9. Alchanatis M, Deligiorgis N, Zias N, et al. Frontal brain lobe impairment in obstructive sleep apnoea: a proton MR spectroscopy study. Eur Respir J 2004;24:980–86.
10. Kamba M, Inoue Y, Higami S, et al. Cerebral metabolic impairment in patients with obstructive sleep apnoea: an independent association of obstructive sleep apnoea with white matter change. J Neurol Neurosurg Psychiatry 2001;71:334–39.
11. Sarma MK, Nagarajan R, Macey PM, et al. Accelerated Echo-Planar J-Resolved Spectroscopic Imaging in the Human Brain Using Compressed Sensing: A Pilot Validation in Obstructive Sleep Apnea. AJNR Am J Neuroradiol 2014;35(6 0):S81–S89.
12. Sarma MK, Macey PM, Nagarajan R, et al. Accelerated Echo Planer J-resolved Spectroscopic Imaging of Putamen and Thalamus in Obstructive Sleep Apnea. Sci Rep 2016; 6: 31747.
13. Wilson NE, Iqbal Z, Burns BL, et al. Accelerated five-dimensional echo planar J-resolved spectroscopic imaging: Implementation and pilot validation in human brain.Magn Reson Med 2015 [Epub ahead of print].
14. Schulte RF, Lange T, Beck J, Meier D, Boesiger P. Improved two dimensional J-resolved spectroscopy. NMR Biomed 2006;19(2):264–270.
15. Schulte RF, Boesiger P. ProFit: two-dimensional prior-knowledge fitting of J-resolved spectra. NMR Biomed 2006;19(2):255–263.
16. Ucar ZZ, Taymaz Z, Erbaycu AE, Kirakli C, Tuksavul F, Guclu SZ. Nocturnal hypoxia and arterial lactate levels in sleep-related breathing disorders. South Med J 2009;102(7):693-700.
17. Hira HS, Shukla A, Kaur A, Kapoor S. Serum uric acid and lactate levels among patients with obstructive sleep apnea syndrome: which is a better marker of hypoxemia? Ann Saudi Med 2012;32(1):37-42.
Figures