0455
Elevated brain NAA occurs without loss of neuronal integrity and correlates with increasing Sickle Cell Disease related stress.1Radiology, Albert Einstein College of Medicine, Bronx, NY, United States, 2Hematology, Albert Einstein College of Medicine, Bronx, NY, United States, 3Physiology & Biophysics, Albert Einstein College of Medicine, Bronx, NY, United States, 4Pathology, Albert Einstein College of Medicine, Bronx, NY, United States, 5Medicine, Albert Einstein College of Medicine, Bronx, NY, United States
Synopsis
Brain NAA is known to be elevated in Canavan’s disease but is usually decreased in association with loss of neuronal integrity. Elevated NAA is herein reported in murine models of sickle cell disease (SCD) and is associated with anemia, hypoxic and oxidative stress and may reflect increased glutathione turnover and / or increase demand for mitochondrial energy. These findings provide insight into why elevated NAA has been observed in children but not adults with SCD, and suggests a mechanism for increased susceptibility to stroke, and alternative roles for NAA in the brain.
Introduction
Brain levels of N-acetyl-aspartate (NAA) are often associated with neuronal integrity 1-3 largely due to its involvement in fatty acid synthesis and myelin production 4-6. Elevations in NAA do occur in Canavan’s disease 7,8 secondary to a aspartoacylase (ASPA) deficiency 1, and rarely NAA elevations have been observed in other diseases 9-12. A few recent studies have reported brain elevations in NAA in children and adolescents with sickle cell disease (SCD) 13-15 and we recently reported elevated NAA in a murine SCD model and suggested an association with mitochondrial energy utilization16. We now present additional animal data that further support this hypothesis.Methods
Control mice (C57BL6) were compared to four transgenic murine models expressing human sickle hemoglobin (HbS); (1) the BERK mouse which is fully transgenic for human sickle hemoglobin (HbSS) and with low fetal hemoglobin (BERK-LG). These animals have RBC’s that sickle spontaneously and suffer severe anemia, shortened life span and stroke. (2) The non-anemic hemizygous sickle transgenic mouse (HEMI) expressing human HbS (aH bS) and a mouse b human S transgene (mb/hS) which exhibits low O2 affinity hemoglobin (P50 ~ 57 vs. Wt 39 mmHg) but do not sickle. (3) The mild phenotype NY1DD mouse whose RBC’s sickle only under severe hypoxic conditions(previously reported data 16). Finally, (4) we studied evolution of cerebral pathology in the BERK-TX mouse (4), which are C57BL6 mice that are irradiated to lethal levels and subsequently infused with nucleated cells from the bone-marrow of BERK sickle mice (thus evolving to the BERK HbSS phenotype). Cerebral measurements were conducted using MRI/MRS methods at 9.4 Tesla (Agilent, Santa Clara, CA). We measured cerebral blood flow (FAIR CBF), an index of the brain oxygen extraction ratio (OER) (obtained from the BOLD response to a bolus of hyperoxia [BOLD-RHO] 16,17), brain microstructural integrity from Diffusion Tensor Imaging DTI fractional isotropy (FA) and tissue inflammation (mean diffusivity, MD). Magnetic Resonance Spectroscopy (MRS) was accomplished using LASER18 in the thalamus, which provided NAA, glutamate (Glu), myoinositiol (Ins), and other metabolite measures.Results
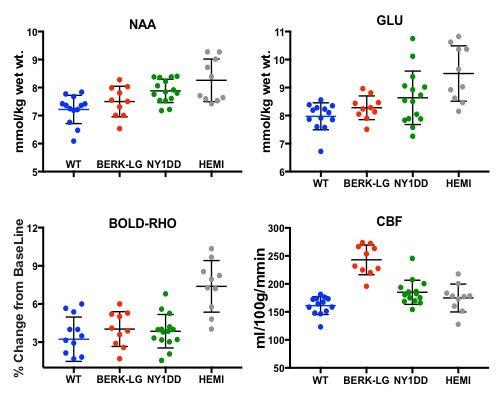
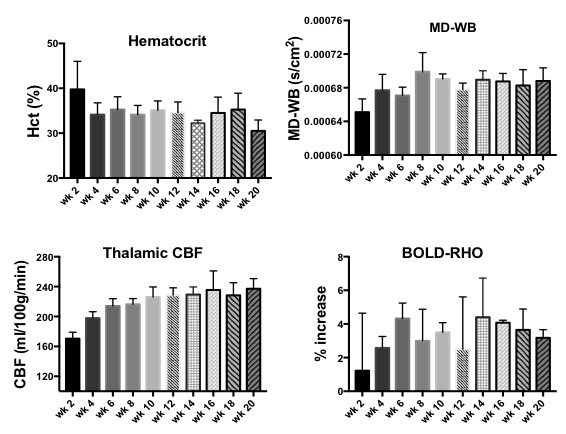
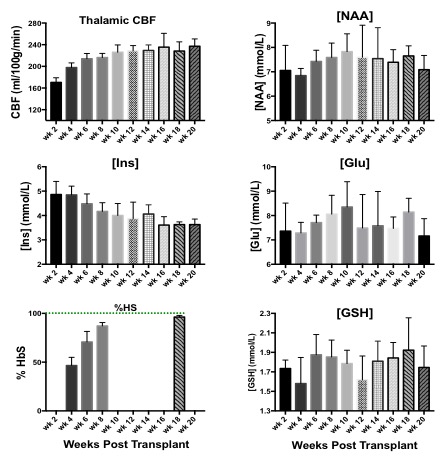
NAA and Glu were elevated in all three animal models (NY1DD, HEMI and BERK-LG). The increase was not related to the severity of the models, but seemed to reflect metabolic adjustment to factor(s) other than anemia (Figure 1); BERK-HEMI animals exhibit the most significant increases in NAA and Glu which were accompanied by elevated OER, while in the BERK-LG animals, with the highest CBF, worst anemia and most severe pathology, NAA and GLU were only mildly elevated compared to WT levels. As BERK-TX phenotype evolves, CBF, OER and MD increased and hematocrit decreased (Figures 2). NAA and Glu increased comcommitantly with CBF, MD and OER and appeared to peak with CBF, but then fell, as CBF and OER stabilized (Figure 3). Interstingly, GSH dropped when NAA peaked but then recovered, and myoinositol (Ins) decreased inversely with CBF. Full BERK-like systemic pathology was established by ~ 12 weeks. BERK-TX animals thus look much like BERK-LG animals after 12 weeks, with lower NAA, GLU and high CBF. FA was unchanged from WT in any of these models.Discussion
NAA was highest in NY1DD and HEMI (both without significant anemia or altered FA), and surged early in the BERK-TX as they transitioned to full BERK phenotype. Concomitant increases in NAA, Glu, MD, OER and CBF with the subsequent drop in NAA and Glu as the other measures peaked suggests that something other than ischemia or neuronal degradation drives the NAA elevations. Decreases in Ins may be related to altered astrocyte/neuronal homeostasis, or increased cerebrovascular activity associated with ensuing anemia. These findings suggest an evolving compensatory response to hypoxic stress rather than the result of severe anemi, and suggests that either oxidative stress, Hb O2 affinity, blood products or degradation in oxygen carrying capacity are responsible. Possibilities include chronic mild hypoxia (from low hemoglobin O2 affinity, reperfusion injury, or oxidative stress). The compensatory alterations in energy homeostasis (increased NAA and Glu, decreased Ins and other metabolite changes) may reflect a shift toward increased neuronal glycolysis or increased GSH production and recycling, both of which require increased mitochondrial energy utilization.Conclusion
The observed changes may explain why NAA increases have been reported only in children with SCD and not adults. The decline of pediatric NAA levels to normal levels in adults may signal emergence of cerebral dysfunction leading to impaired cognition 19 and are consistent with elevations in OER and exhaustion of cerebrovascular reserves 20 which may predispose the brain to a higher risk for stroke. These findings suggest a role for NAA in metabolic mitochondrial energy homeostasis.
Acknowledgements
No acknowledgement found.References
References
1. IMoffett, J.R., Ross, B., Arun, P., Madhavarao, C.N. & Namboodiri, A.M. N-Acetylaspartate in the CNS: from neurodiagnostics to neurobiology. Prog. Neurobiol. 81, 89-131 (2007).
2. Paslakis, G., Traber, F., Roberz, J., Block, W. & Jessen, F. N-acetyl-aspartate (NAA) as a correlate of pharmacological treatment in psychiatric disorders: a systematic review. Eur. Neuropsychopharmacol. 24, 1659-1675 (2014).
3. Manji, H., et al. Impaired mitochondrial function in psychiatric disorders. Nat. Rev. Neurosci. 13, 293-307 (2012).
4. D'Adamo AF, G.L., Yatsu FM. Acetyl Transport Mechanism. Involvement of N-Acetyl Aspartic Acid in de novo Fatty Acid Biosynthesis in the Developing Rat Brain. Exp. Brain Res. 5, 267-273 (1968).
5. Ramos, M., et al. Deficiency of the mitochondrial transporter of aspartate/glutamate aralar/AGC1 causes hypomyelination and neuronal defects unrelated to myelin deficits in mouse brain. J. Neurosci. Res. 89, 2008-2017 (2011).
6. Burri R, S.C., Herschkowitz N. N-Acetyl-L-Aspartate is a major source of acetyl groups for lipid synthesis during rat brain development. Dev Neuro0sci 13, 403-411 (1991).
7. Janson, C.G., et al. Natural history of Canavan disease revealed by proton magnetic resonance spectroscopy (1H-MRS) and diffusion-weighted MRI. Neuropediatrics 37, 209-221 (2006).
8. Baslow, M.H. & Guilfoyle, D.N. Are astrocytes the missing link between lack of brain aspartoacylase activity and the spongiform leukodystrophy in Canavan disease? Neurochem. Res. 34, 1523-1534 (2009).
9. Hagenfeldt, L., Bollgren, I. & Venizelos, N. N-acetylaspartic aciduria due to aspartoacylase deficiency--a new aetiology of childhood leukodystrophy. J. Inherit. Metab. Dis. 10, 135-141 (1987).
10. Hanefeld, F.A., et al. Quantitative proton MRS of Pelizaeus-Merzbacher disease: evidence of dys- and hypomyelination. Neurology 65, 701-706 (2005). 11. Michael, N., Erfurth, A. & Pfleiderer, B. Elevated metabolites within dorsolateral prefrontal cortex in rapid cycling bipolar disorder. Psychiatry Res. 172, 78-81 (2009).
12. de la Fuente-Sandoval, C., et al. Higher levels of glutamate in the associative-striatum of subjects with prodromal symptoms of schizophrenia and patients with first-episode psychosis. Neuropsychopharmacology 36, 1781-1791 (2011).
13. Wang, Z., et al. Investigation of stroke in sickle cell disease by 1H nuclear magnetic resonance spectroscopy. Neuroradiology 35, 57-65 (1992).
14. Steen, R.G. & Ogg, R.J. Abnormally high levels of brain N-acetylaspartate in children with sickle cell disease. AJNR Am. J. Neuroradiol. 26, 463-468 (2005).
15. Emam, A.T., Ali, A.M. & Babikr, M.A. Magnetic resonance spectroscopy of the brain in children with sickle cell disease. Neurosciences (Riyadh) 14, 364-367 (2009).
16. Cui MH, S.S., Branch NA, Ambadipudi K, Thangaswamy S, Acharya SA, Billett HH, Branch CA. Brain neurochemical and hemodynamic findings in the NY1DD mouse model of mild sickle-cell disease. NMR Biomed. In Press, 1-12 (2017).
17. Kennan, R.P., Suzuka, S.M., Nagel, R.L. & Fabry, M.E. Decreased cerebral perfusion correlates with increased BOLD hyperoxia response in transgenic mouse models of sickle cell disease. Magn. Reson. Med. 51, 525-532 (2004).
18. Garwood, M. & DelaBarre, L. The return of the frequency sweep: Designing adiabatic pulses for contemporary NMR. J. Magn. Reson. 153, 155-177 (2001).
19. Strouse, J.J., et al. Inverse correlation between cerebral blood flow measured by continuous arterial spin-labeling (CASL) MRI and neurocognitive function in children with sickle cell anemia (SCA). Blood 108, 379-381 (2006).
20. Kosinski, P.D., et al. The severity of anaemia depletes cerebrovascular dilatory reserve in children with sickle cell disease: a quantitative magnetic resonance imaging study. Br. J. Haematol. 176, 280-287 (2017).
Figures