0454
Evidence for Two T2 Components of N-Acetyl-Aspartate (NAA) In Healthy White Matter1MR Clinical Science, Philips Healthcare Canada, Markham, ON, Canada, 2UBC MRI Research Centre, University of British Columbia, Vancouver, BC, Canada, 3ImageTech Lab, Simon Fraser University, Surrey, BC, Canada, 4Physics & Astronomy, University of British Columbia, Vancouver, BC, Canada, 5International Collaboration on Repair Discoveries, Vancouver, BC, Canada, 6Pathology and Laboratory Medicine, University of British Columbia, Vancouver, BC, Canada, 7Radiology, University of British Columbia, Vancouver, BC, Canada
Synopsis
N-acetyl-aspartate (NAA) is commonly referred to as an ‘axonal marker’ but recent electron microscopy evidence demonstrates higher levels of NAA in myelin than in neurons. Given the multi-exponential T2 nature of water in white matter (WM), we sought to determine if there are similarly two pools of NAA in WM. We performed multi-echo magnetic resonance spectroscopy in the WM of 5 healthy volunteers at 3T with TE from 10-800ms and observed a short T2 component between 13-40ms arising from 16-20% of the total signal. These preliminary results encourage further research into the bi-exponential nature of NAA in WM.
Introduction
N-acetyl-aspartate (NAA) is commonly referred to as an ‘axonal marker’. However, a recent report utilizing electron microscopy and immunogold labeling demonstrated that NAA is more highly concentrated in oligodendrocytes/myelin than in any parts of the neuron1. Thus, the NAA signal measured with in vivo magnetic resonance spectroscopy (MRS) may arise from both neuronal and myelinic components.
It is well established that water in healthy white matter (WM) also arises from two compartments2,3. Water trapped within myelin bilayers has a shorter T2 (10-20ms at 3T) than water in the intra/extra-cellular spaces (>60ms)3. These two water compartments can be separated by acquiring multi-echo magnetic resonance images and fitting a multi-exponential model to extract the fraction of the total signal amplitude that arises from the short T2 component. This fraction is the myelin water fraction (MWF)3, which strongly correlates with myelin staining4,5. Given the new evidence for an NAA compartment in myelin, the goal of this project was to perform multi-echo MRS measurements to determine if in vivo MRS can detect a short T2 component of NAA in human WM.
Methods
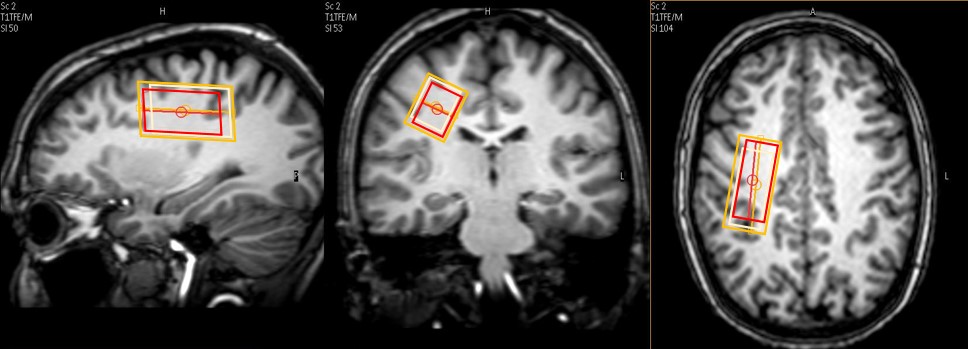
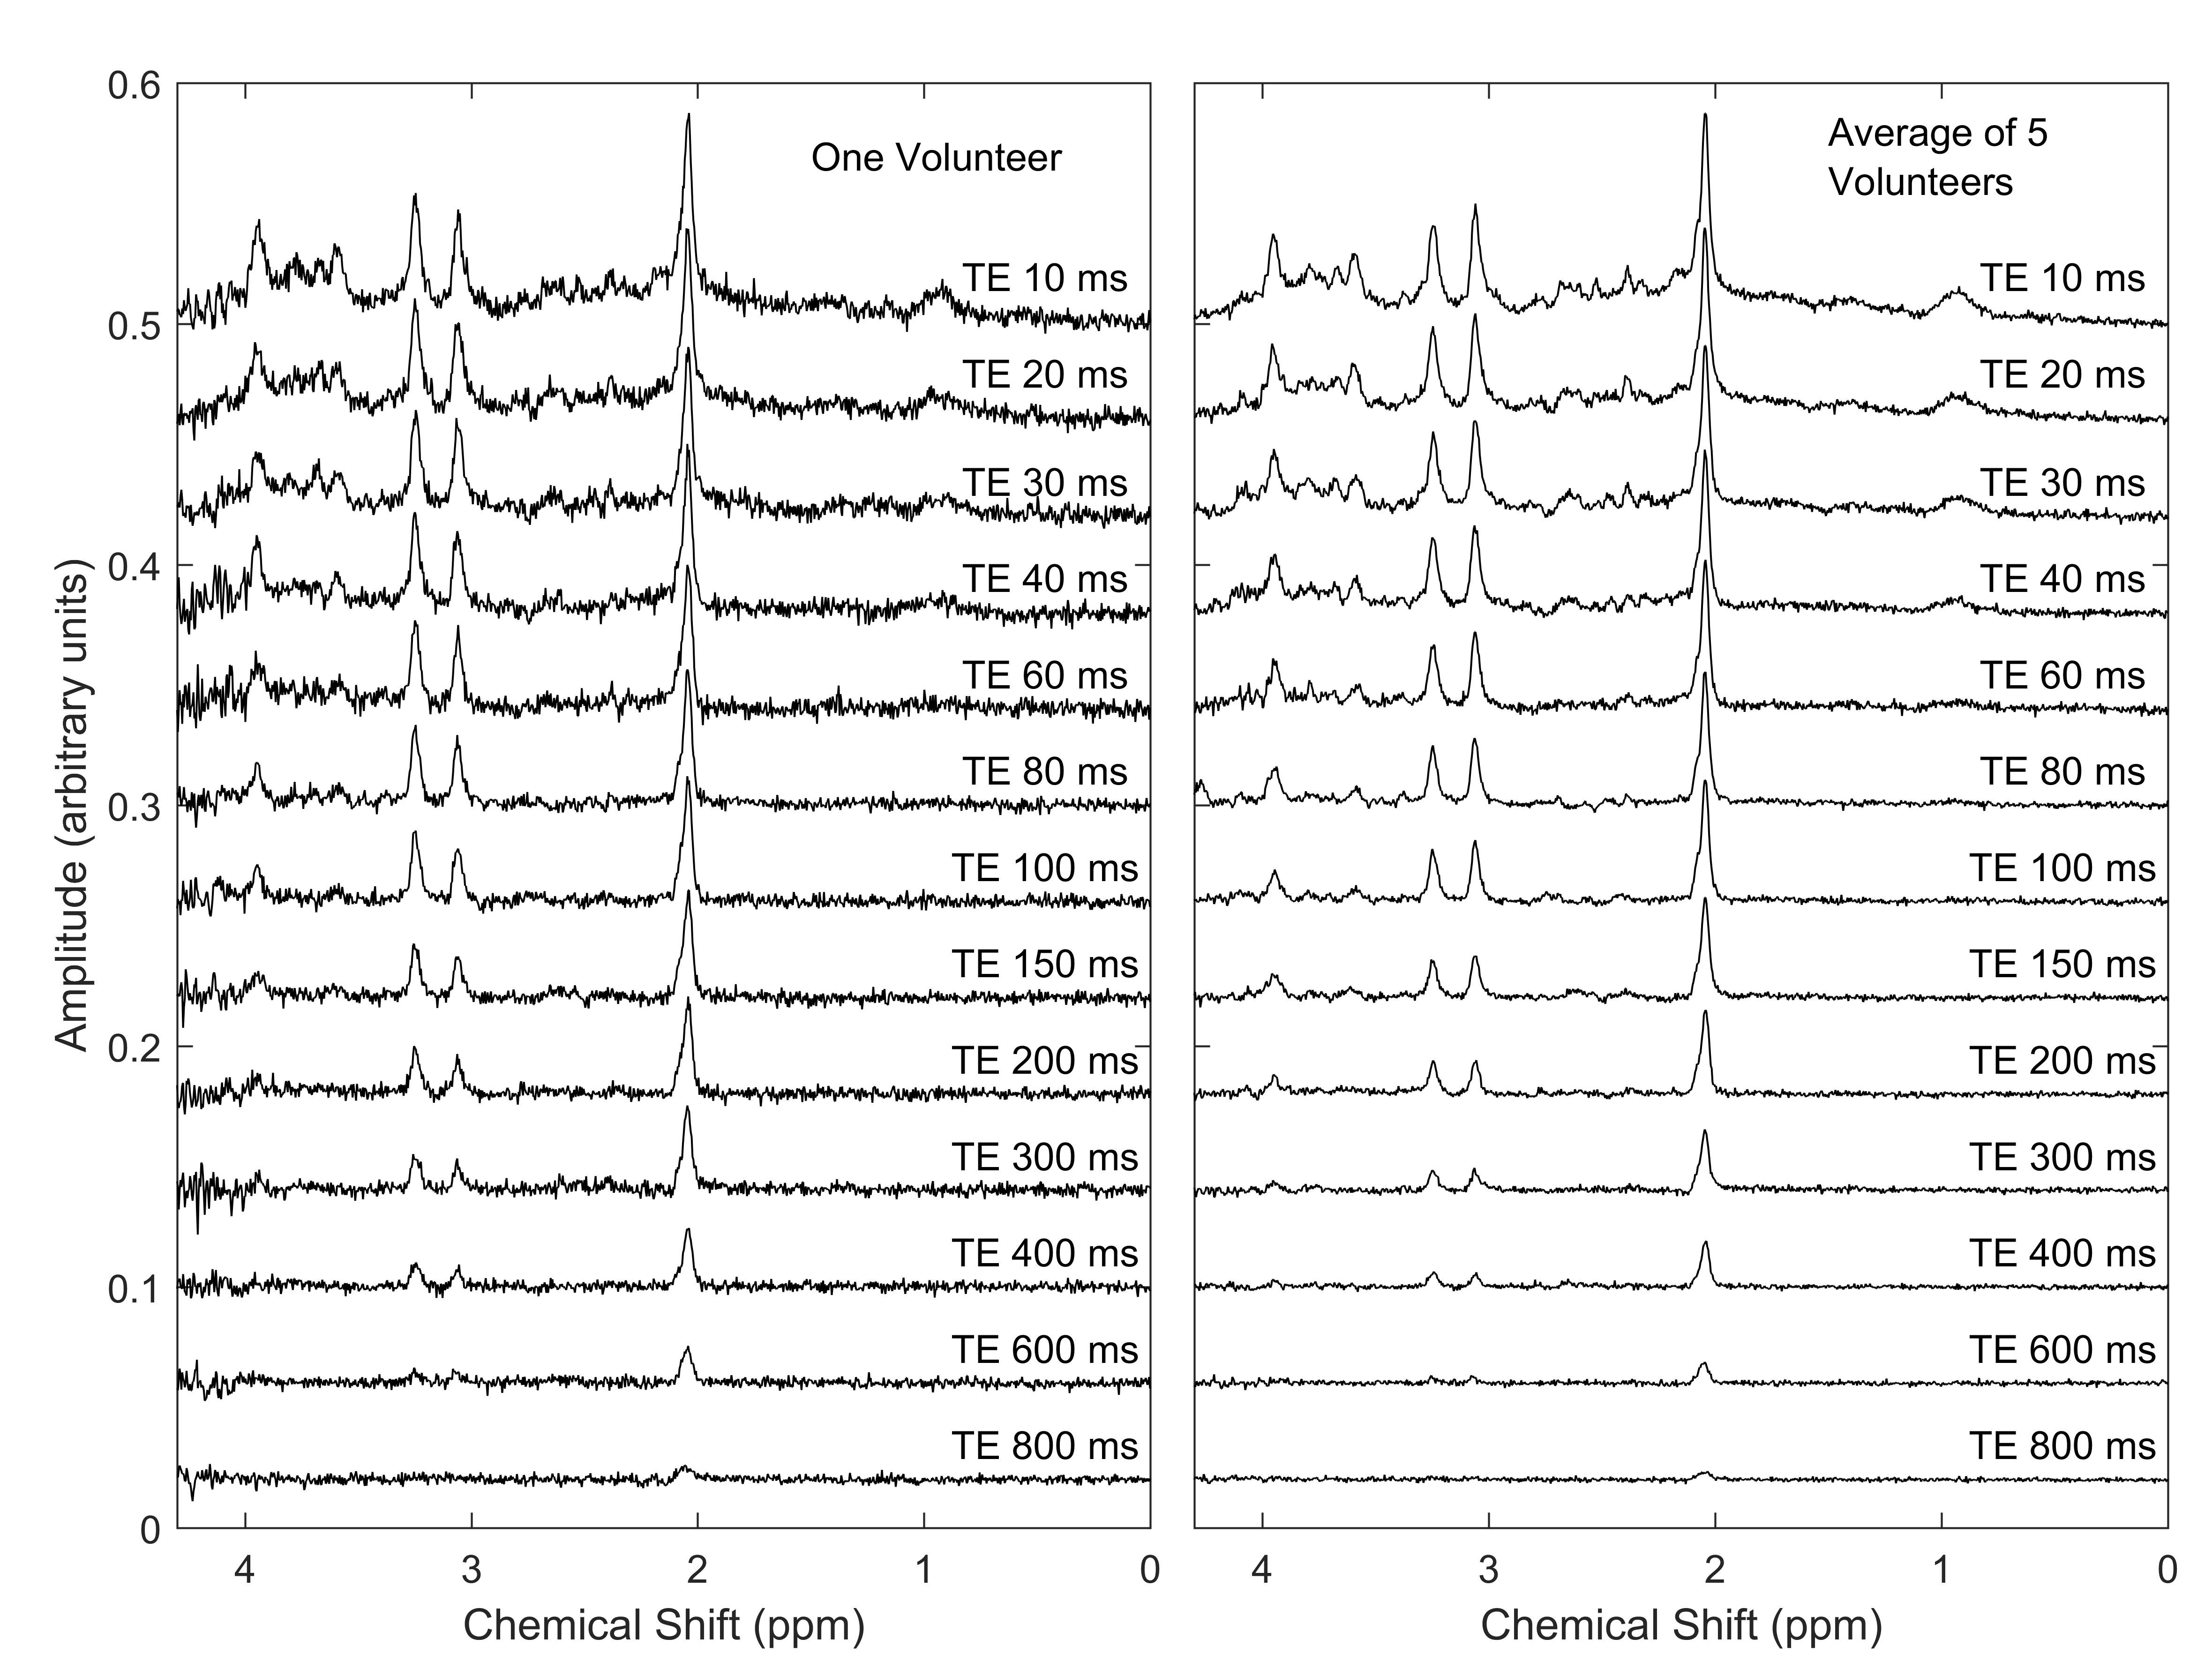
MR Experiments: 4 females (23, 34, 38, 48yrs) and 1 male (23yrs) were scanned at 3T (Philips Achieva, Best, The Netherlands) with a transmit/receive head coil. A 3DT1 was acquired for voxel planning and tissue segmentation (MPRAGE, TR/TE/TI=3000/3.5/950ms). Left centrum semiovale MRS data was collected (volume = 12mL, Figure 1) using STEAM: TR/TM=4000/33ms, 16 phase cycle steps, second order shimming, VAPOR water suppression6, increasing TE (Figure 2), 2 non-water-suppressed shots per TE for eddy current correction, scan time = 57min. Spectra were acquired in one dynamic scan to ensure constant receiver gain and shim.
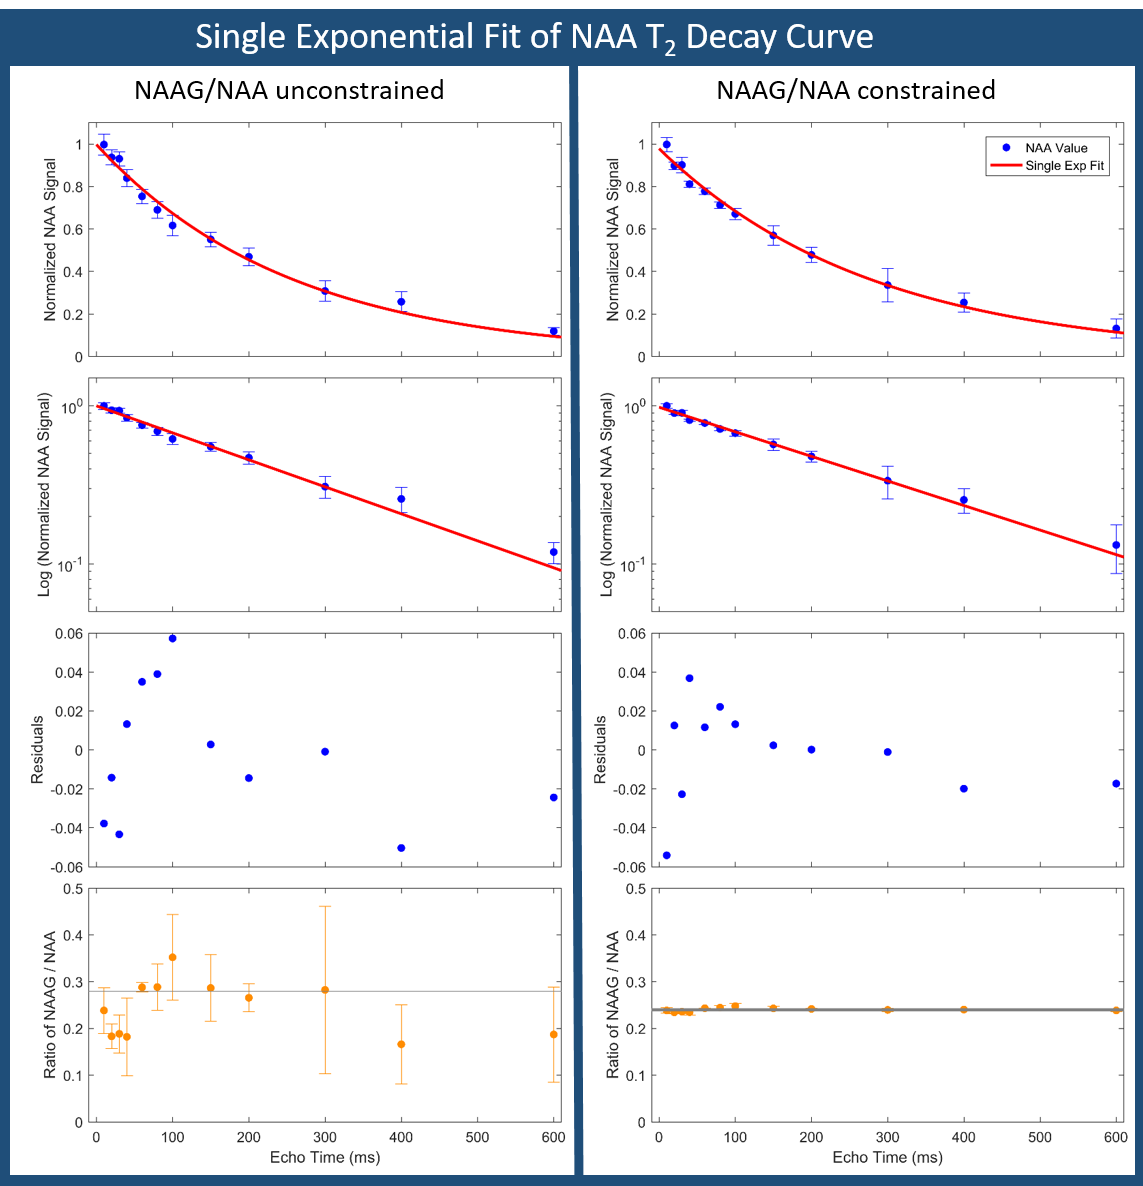
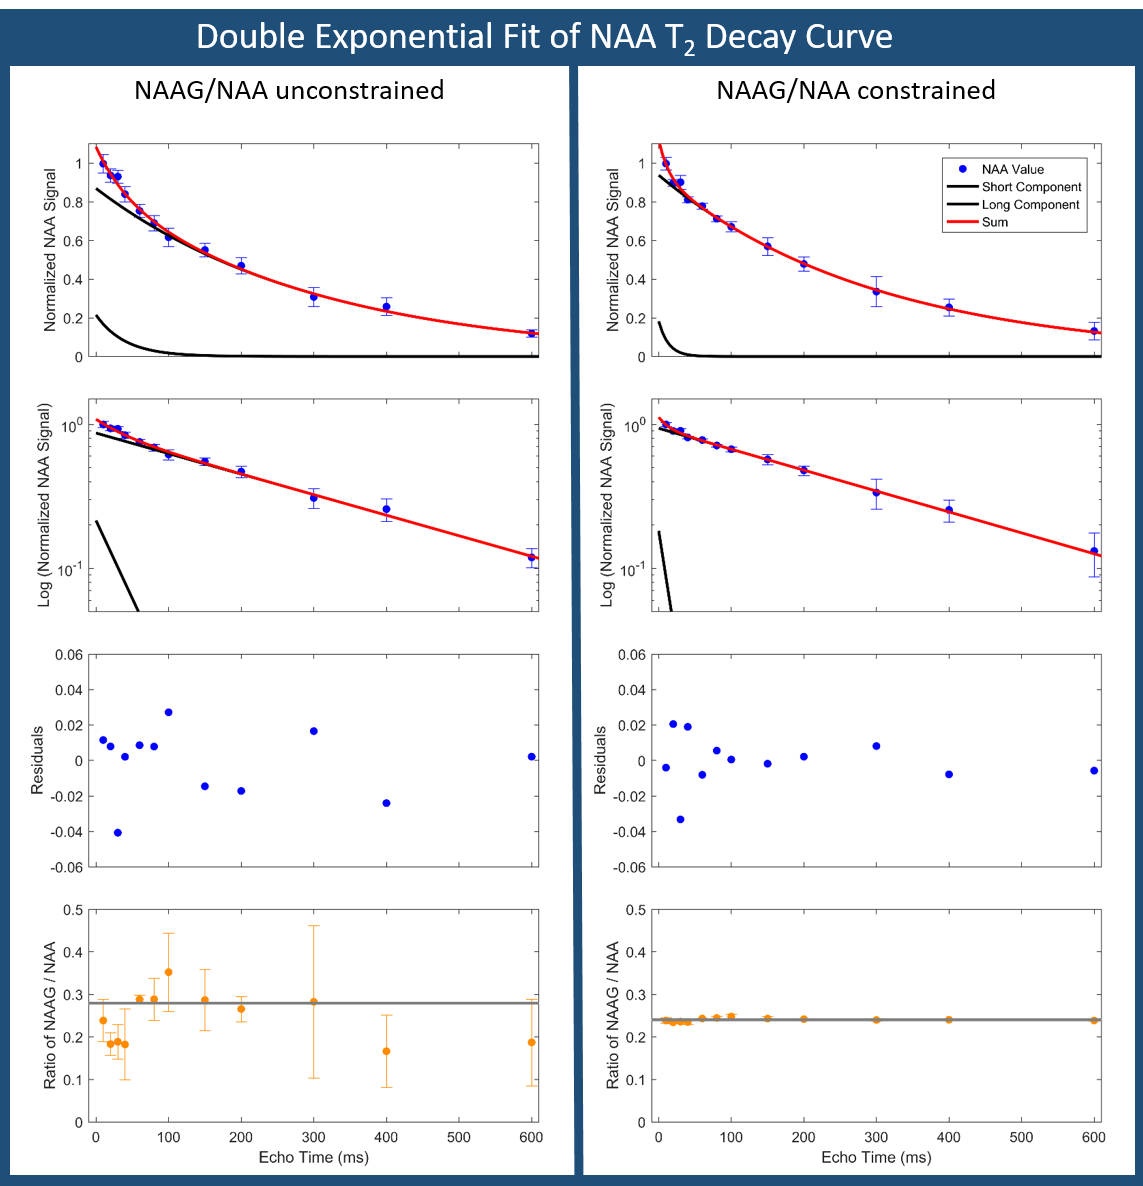
MRS analysis: Spectra were analyzed with LCModel v6.3 without water scaling7. Basis sets for each TE were created from simulated templates of 23 metabolites with FID-A8. To investigate the role of N-acetyl-aspartyl-glutamate (NAAG) in NAA signal estimation, the LCModel fit was also performed with a constraint on the NAAG/NAA ratio = 0.24±0.01 (mean ratio across all volunteers at TE=10). The arbitrary concentration of NAA, SNR, and linewidth were extracted from each LCModel fit. NAA values were normalized by the amplitude of a single exponential fit to each volunteer’s decay curve. NAA values were then fit in MATLAB (lsqcurvefit algorithm, Mathworks, USA) to a double exponential with the constraint that amplitudes and T2 times must be non-negative.
Results
Good spectral quality was obtained from all 5 volunteers (Figures 2,3). A single exponential fit to the average NAA yielded an apparent T2=255ms (Figure 4), with a root-mean-squared-error (RMSE)=0.1145. A double exponential fit to average NAA estimated T2’s of 40ms and 304ms, from 20% and 80% of the total amplitude, respectively. The double exponential fit resulted in a RMSE=0.0699, and low residuals that fluctuate about zero (Figure 5). NAAG/NAA constrained analysis (Figures 4,5) yielded an apparent single exponential T2=280ms (RMSE=0.0804) and double exponential T2 estimates of 13ms and 299ms, from 16% and 84% of the total amplitude, respectively (RMSE=0.0469).Discussion & Conclusions
These multi-echo MRS measurements provide preliminary evidence of a bi-exponential T2 decay of NAA in WM at 3T. It is well established that signal from water in WM is comprised of a short T2 component from myelin water (10-20ms, ~10-20% of the total signal), and a longer T2 component (>60ms) from intra- and extracellular water2,3. We observed that fitting the NAA T2 decay curve with a double exponential model similarly revealed a short T2 component (13-40ms, 16-20% of the total signal). The NAA long T2 time (299-304ms, 80-84% of the total signal) is in excellent agreement with previous reports of NAA T2 in WM using a single exponential fit and first TE≥30ms9,10. The contribution of NAAG to NAA levels may be a confounding factor, although the short T2 component was still present when the NAAG/NAA ratio was constrained in LCModel.
A recent electron microscopy report demonstrated that NAA is more highly concentrated in myelin than in neurons1. Our measured short T2 component arises from a smaller fraction of the total NAA signal, suggesting that the majority of NAA in myelin is bound to larger complexes or lipid membranes and is not detectable with in vivo MRS. However, the presence of a short T2 component for NAA in WM suggests that some NAA may be dissolved in the myelin water. More research is needed to confirm this observation, particularly to minimize the effect of the variable NAAG/NAA ratio on NAA measurements. These preliminary results encourage further work to confirm the presence of a short T2 component for NAA in WM.
Acknowledgements
The authors sincerely appreciate the support of the UBC MRI Research Centre technologists, and the volunteers who participated in this study. ELM is supported by Philips Healthcare Canada. CG is supported by a Multiple Sclerosis (MS) Society of Canada endMS Masters Studentship Award. CL holds an operating grant from the MS Society of Canada. CL and ALM hold Program Discovery Grants from the Natural Sciences and Engineering Research Council of Canada.References
1. Nordengen K, Heuser C, Rinholm JE, et al. Localisation of N-acetylaspartate in oligodendrocytes/myelin. Brain Struct Funct 2015;220:899–917.
2. Mackay AL, Whittall K, Adler J, et al. In Vivo Visualization of Myelin Water in Brain by Magnetic Resonance. Magn Reson Med 1994;31:1-5
3. MacKay AL, Laule C. Magnetic Resonance of Myelin Water: An in vivo Marker for Myelin. Brain Plast 2016;2:71–91.
4. Laule C, Leung E, Li DKB, et al. Myelin water imaging in multiple sclerosis: quantitative correlations with histopathology. Mult Scler 2006;12:747–53.
5. Laule C, Kozlowski P, Leung E,et al. Myelin water imaging of multiple sclerosis at 7T: Correlations with histopathology. Neuroimage 2008;40:1575–1580.
6. Tkác I, Starcuk Z, Choi IY, Gruetter R. In vivo 1H NMR spectroscopy of rat brain at 1 ms echo time. Magn Reson Med 1999;41:649–56.
7. Provencher SW. Estimation of metabolite concentrations from localized in vivo proton NMR spectra. Magn Reson Med 1993;30:672–679.
8. Simpson R, Devenyi GA, Jezzard P, et al. Advanced processing and simulation of MRS data using the FID appliance (FID-A)-An open source, MATLAB-based toolkit. Magn Reson Med 2017;77(1):23-33
9. Mlynárik V, Gruber S, Moser E. Proton T(1) and T(2) relaxation times of human brain metabolites at 3 Tesla. NMR Biomed 2001;14:325–31.
10. Träber F, Block W, Lamerichs R, et al. 1H Metabolite Relaxation Times at 3.0 Tesla: Measurements of T1 and T2 Values in Normal Brain and Determination of Regional Differences in Transverse Relaxation. J Magn Reson Imaging 2004;19:537–545.
Figures