0451
Patch-based super-resolution of 7 T MRSI of Glioma: Initial results1High Feld MR Centre, Medical University of Vienna, Vienna, Austria, 2Christian Doppler Laboratory for Clinical Molecular MR Imaging, Vienna, Austria, 3icometrix, R&D, Leuven, Belgium, 4Diagnostic Image Analysis Group, Radboud University Medical Center, Nijmegen, Netherlands, 5Athinoula A. Martinos Center for Biomedical Imaging, Department of Radiology, Massachusetts General Hospital, Harvard Medical School, Boston, MA, United States, 6Russell H. Morgan Department of Radiology and Radiological Science, The Johns Hopkins University School of Medicine, Baltimore, MD, United States, 7F. M. Kirby Research Center for Functional Brain Imaging, Kennedy Krieger Institute, Baltimore, MD, United States, 8Department of Neurosurgery, Medical University of Vienna, Vienna, Austria, 9Department of Medicine 1, Division of Oncology, Medical University of Vienna, Vienna, Austria, 10Department of Electrical Engineering-ESAT, STADIUS Center for Dynamical Systems, Signal Processing and Data Analytics, KU Leuven, Leuven, Belgium, 11BioImaging Lab, Universiteit Antwerpen, Antwerp, Belgium
Synopsis
The application of high-resolution MRSI at 7T to the measurement of brain tumours was recently shown with preliminary data. In order to better resolve the glioma structure and metabolism for clinical use, a further increase in resolution over the currently achievable would be necessary. This can be achieved by the application of modern image up-sampling techniques. Therefore, we demonstrate the successful application and benefits of one such technique, patch-based superresolution, to 7T MRSI maps in glioma patients. Our results show the resolution of metabolic hotspots with unprecedented detail.
Purpose
For the clinical assessment of brain tumours, the determination of tumour proliferation and graduation, location of foci and recurrences as well as the IDH-mutation status are highly relevant. MRSI could be a powerful tool in this regard, but the clinically available sequences offer only low resolution maps of few metabolites like N-acetyl-aspartate(NAA), Creatine(Cr) and Choline(Cho) typically restricted by a selection box. 7T MRSI allows to separate more metabolites resulting in a wider neurochemical profile, higher resolutions and full-slice measurements[1,2] and preliminary data for high-resolution MRSI of brain tumours have recently been shown[3].
Despite all improvements, metabolic maps of further improved spatial resolutions would be needed for the clinical assessments described above. Patch-based superresolution(PBSR) is an up-sampling method shown to work better than standard interpolation techniques for MRSI maps in MS patients[4]. PBSR uses imaging data to search for similar neighbourhood voxels during up-sampling for increased fidelity. We present the first application of PBSR to glioma measurements, reaching an in-plane-resolution of 0.86mm, which allows resolving tumour metabolism better than ever before.
Methods
Eight glioma patients (5 male, 3 female, 43±5 years) were measured on a Siemens 7T Magnetom scanner using a 32-channel head coil. Written informed consent and institutional review board approval were obtained. All glioma were histologically verified (2×WHO-grade III, 1×grade II-III, 5×grade II).
The measurement protocol consisted of anatomical imaging (MPRAGE/SWI/B1+-map) prior to MRSI. Additional clinical imaging data (contrast-enhanced T1w/T2-TSE/ FLAIR/PET) was also available. An FID-MRSI sequence[5,6] with the following scan parameters was acquired in 6 min: acquisition delay 1.3ms, TR 600ms, 64×64 matrix, FOV 220×220×8mm³, 1024 readout points, 6000Hz readout bandwidth, WET water suppression, MUSICAL[7] coil combination and 5-fold CAIPIRINHA[6] acceleration.
Data processing utilised an in-house routine[8] including lipid signal removal[9](Fig.1). The spectra were fitted between 1.8-4.2 ppm using LCModel and evaluated for SNR, FWHM and CRLBs for NAA. The resulting MRSI maps were masked based on a combination of NAA CRLB, NAA FHWM and the sum of myoInositol(Ins)+Cr+Cho CRLB values. Imaging data (7T MPRAGE/clinical MPRAGE pre and post contrast-enhancement/TSE/ FLAIR) were co-registered and brain-masked using BET[10]. GM/WM/CSF were segmented using FSL while the gliomas were manually segmented by a neuroradiologist.
PSBR processing[4] (Fig.1) used the segmentation data, MPRAGE, FLAIR and MRSI maps as input. It was applied in two iterations to reach a 256×256 resolution for tNAA(NAA+NAAG), tCho(Cho+PCho), tCr(Cr+PCr), Ins, Glutamate(Glu) and Glutamine(Gln) maps as well of the ratios of tCho, Ins and Gln to tNAA and tCr. The results were compared to the original MRSI maps.
Results
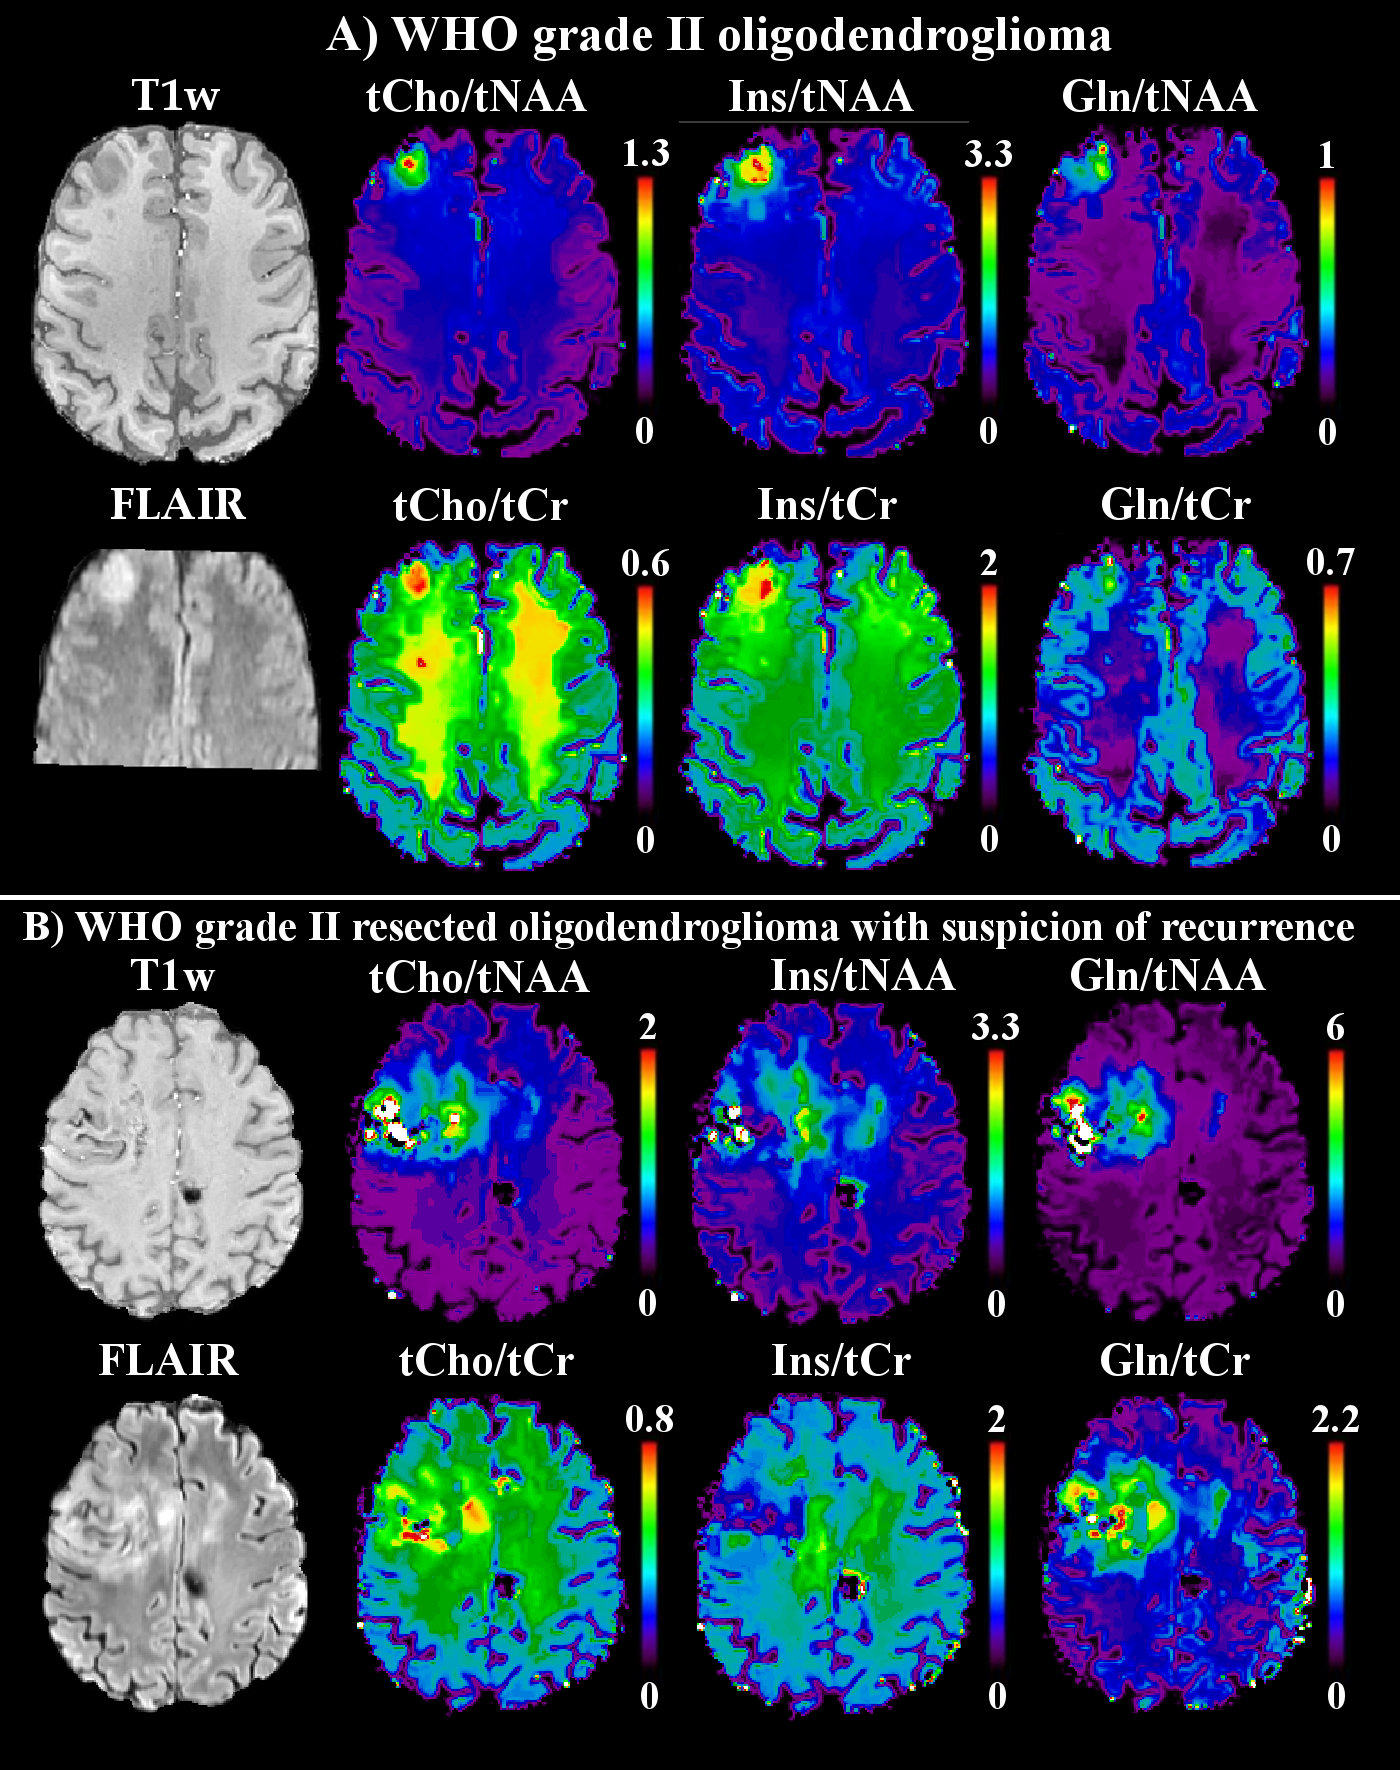
Average NAA SNR was >20 in all patients. tNAA, tCho, tCr, Glu, Gln and Ins could be quantified in all cases. Fig.2 shows examples of spectra in glioma compared to healthy tissue. In all patients, we found regions with reduced tNAA and increased tCho and Gln. Ins was nearly always increased and Glu nearly always decreased except for one grade III oligoastrocytoma with recurrence, where Ins was decreased/Glu increased. tCr was reduced or unchanged in all oligodendrogliomas, but increased in case of astrocytomas or tumour recurrence. Examples of these behaviours can be found in Fig.3-5.
In comparison to the original maps and standard linear interpolation, the PBSR maps show better anatomical correspondence and more detailed metabolic deviations in glioma(Fig.3). Especially in inhomogeneous lesions, PBSR-MRSI could resolve local differences and hotspots of metabolic activities within the glioma that appear to correspond well with PET imaging(Fig.4). This held true for the ratio maps(Fig.5), which allowed to resolve metabolic differences within tumours better than before, especially for Gln. At ≤3T Glu and Gln are often assessed together as Glx, but our maps clearly showed different behaviour in most of the gliomas(Glu↓,Gln↑), which is visible in Fig.3-5.
Discussion/Conclusions
PBSR as a method to increase the resolution of MRSI maps was successfully applied to glioma measurements at 7T. It increases anatomical correspondence, eliminates CSF regions (reducing partial volume effects) and works better than standard interpolation. It even worked well in complicated gliomas such as Fig.4, showing metabolic hotspots with remarkable similarities to PET imaging. Our results further show the importance of being able to separate Glu and Gln signals at 7T, a topic which warrants further investigation. The increase of Cr in astrocytomas/recurring gliomas might necessitate a discussion of the use of Cr as reference in metabolic ratios.
Currently, PBSR requires substantial additional postprocessing like manual glioma segmentation, which will benefit from automation in the future. In summary, our results show that the combination of 7T FID-MRSI and PBSR is a powerful tool for clinical studies of brain tumours.
Acknowledgements
This study was supported by TRANSACT (EU-FP7-PEOPLE-2012- ITN-316679); research support from the NIHR/WT Clinical Research Facility; the Austrian Science Fund (FWF): KLI 646 and P 30701; and the FFG Bridge Early Stage Grant #846505.References
[1] Bogner et al., NMR Biomed 2012; 25(6):873-82[2] Hangel et al., NeuroImage 2016, doi: 10.1016/j.neuroimage.2016.10.043
[3] Hangel et al., ISMRM 25 (2017):4425
[4] Jain et al., Front Neurosci 2017, doi: 10.3389/fnins.2017.00013
[5] Hangel et al., NMR in Biomed 2015; 28(11): 1413-25
[6] Strasser et al., MRM 2016, doi: 10.1002/mrm.26386
[7] Strasser et al.; NMR in Biomed 2013; 26(12): 1796-805
[8] Považan et al., ISMRM 23 (2015):1973
[9] Bilgic et al., MRM 2013; 69(6):1501-11
[10] Smith, Hum. Brain Mapp. 2002; 17:143–55, doi: 10.1002/hbm.10062
Figures