0445
Improved Quantification of Hepatic Fatty Acid Metabolism in Nonalcoholic Steatohepatitis: Serum Biochemistry and In vivo Proton MRS Study with Spin-Spin Relaxation Time Correction at 9.4 T1Department of Biomedical Engineering and Research Institute of Biomedical Engineering, College of Medicine, The Catholic University of Korea, Seoul, Republic of Korea
Synopsis
Changes in saturated and unsaturated fatty acids with hepatic triglycerides following the formation of abnormal metabolites, which play an important pathogenic role, can be measured by magnetic resonance (MR) spectroscopy. High-field-strength MR imaging scanners, which have an improved signal-to-noise ratio and high resolution for multiple lipid resonance components, are used to detect each component of lipid resonance. The aims of this study were to quantify hepatic lipid content and triglyceride composition in a preclinical nonalcoholic steatohepatitis model during the progression of steatohepatitis by assessing potential biomarkers, including spin-spin relaxation time, and applying in vivo proton MR spectroscopy with serum biochemistry.
Purpose
Currently, liver biopsies are not routinely performed in patients with suspected non-alcoholic fatty liver disease (NAFLD) or non-alcoholic steatohepatitis (NASH) because of its invasiveness and perceived risks.1 Therefore, this method does not accurately assess the degree of NASH. Studies of NASH have suggested the need for a method to accurately diagnose and assess the progressive severity of NASH independent of NAFLD.2 The aims of this study were to establish an animal model for steatohepatitis with serum biochemistry and quantify hepatic lipid contents and composition of triglycerides with potential biomarkers, including spin-spin relaxation time, during the progression of steatohepatitis in a preclinical NASH model. Additionally, the relationships of the lipid components were investigated by in vivo 9.4 T proton MR spectroscopy to overcome limitations such as low resolution of the stimulated echo acquisition mode (STEAM).Materials and Methods
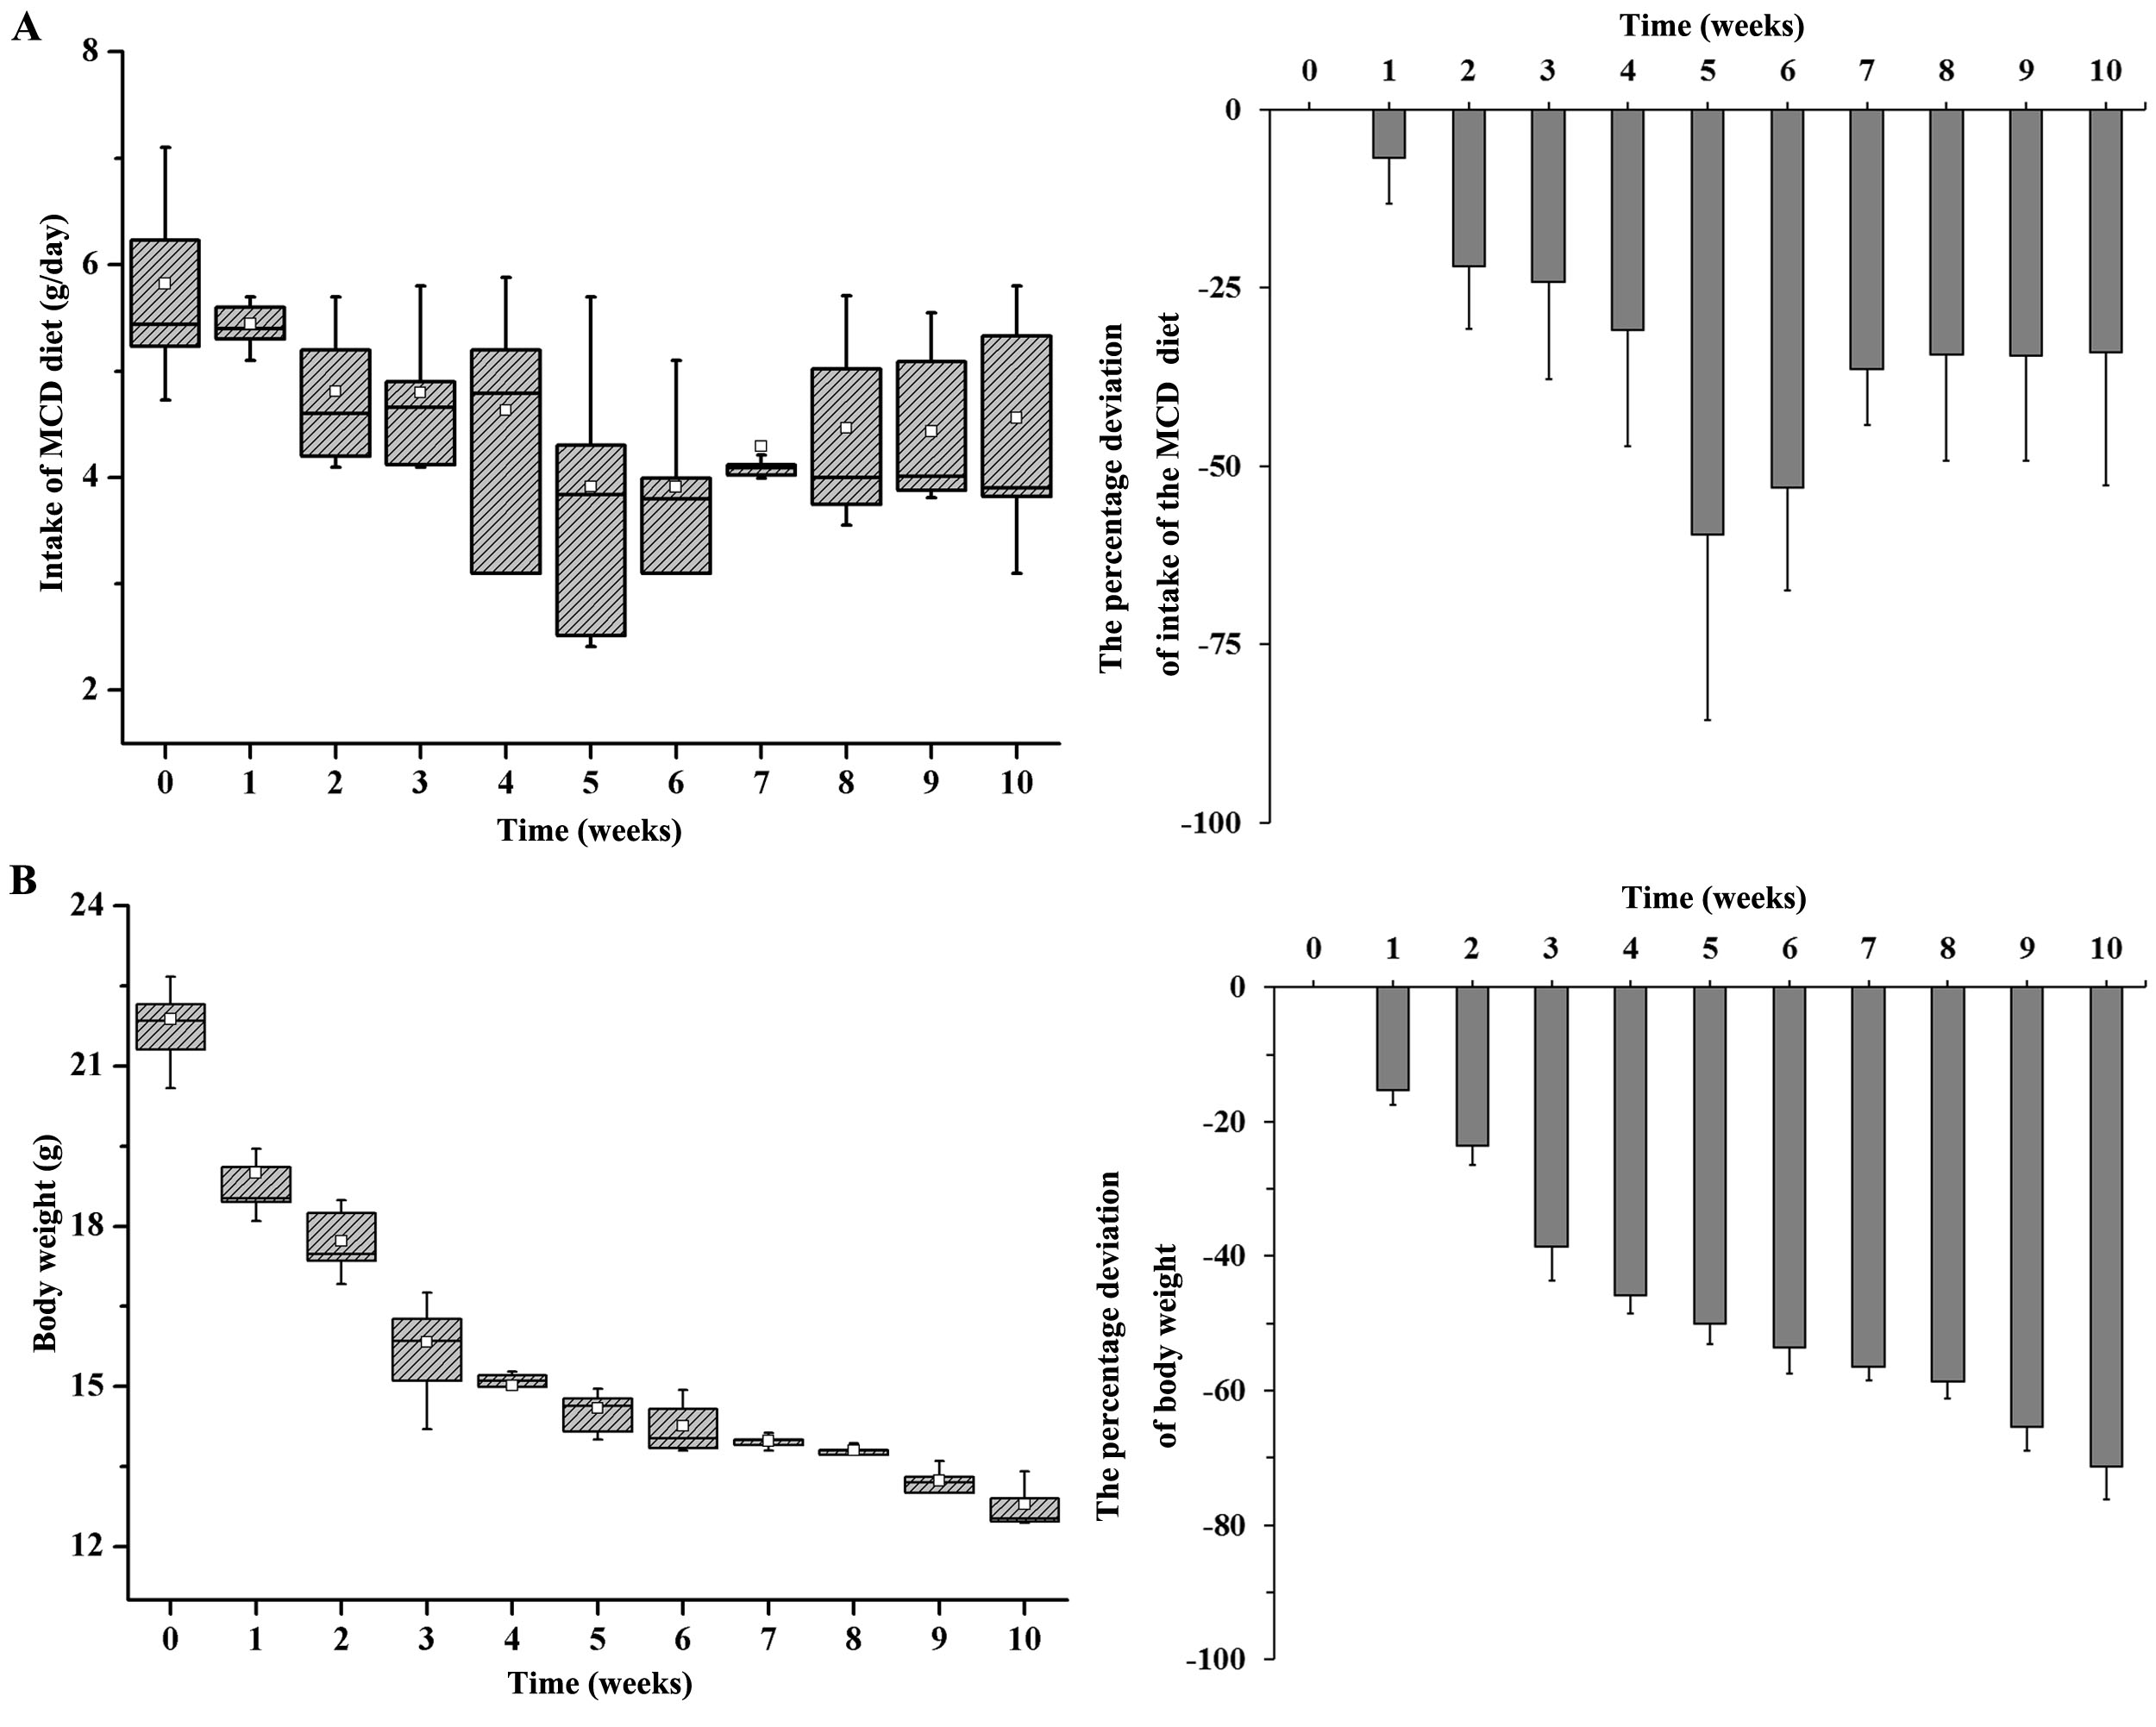
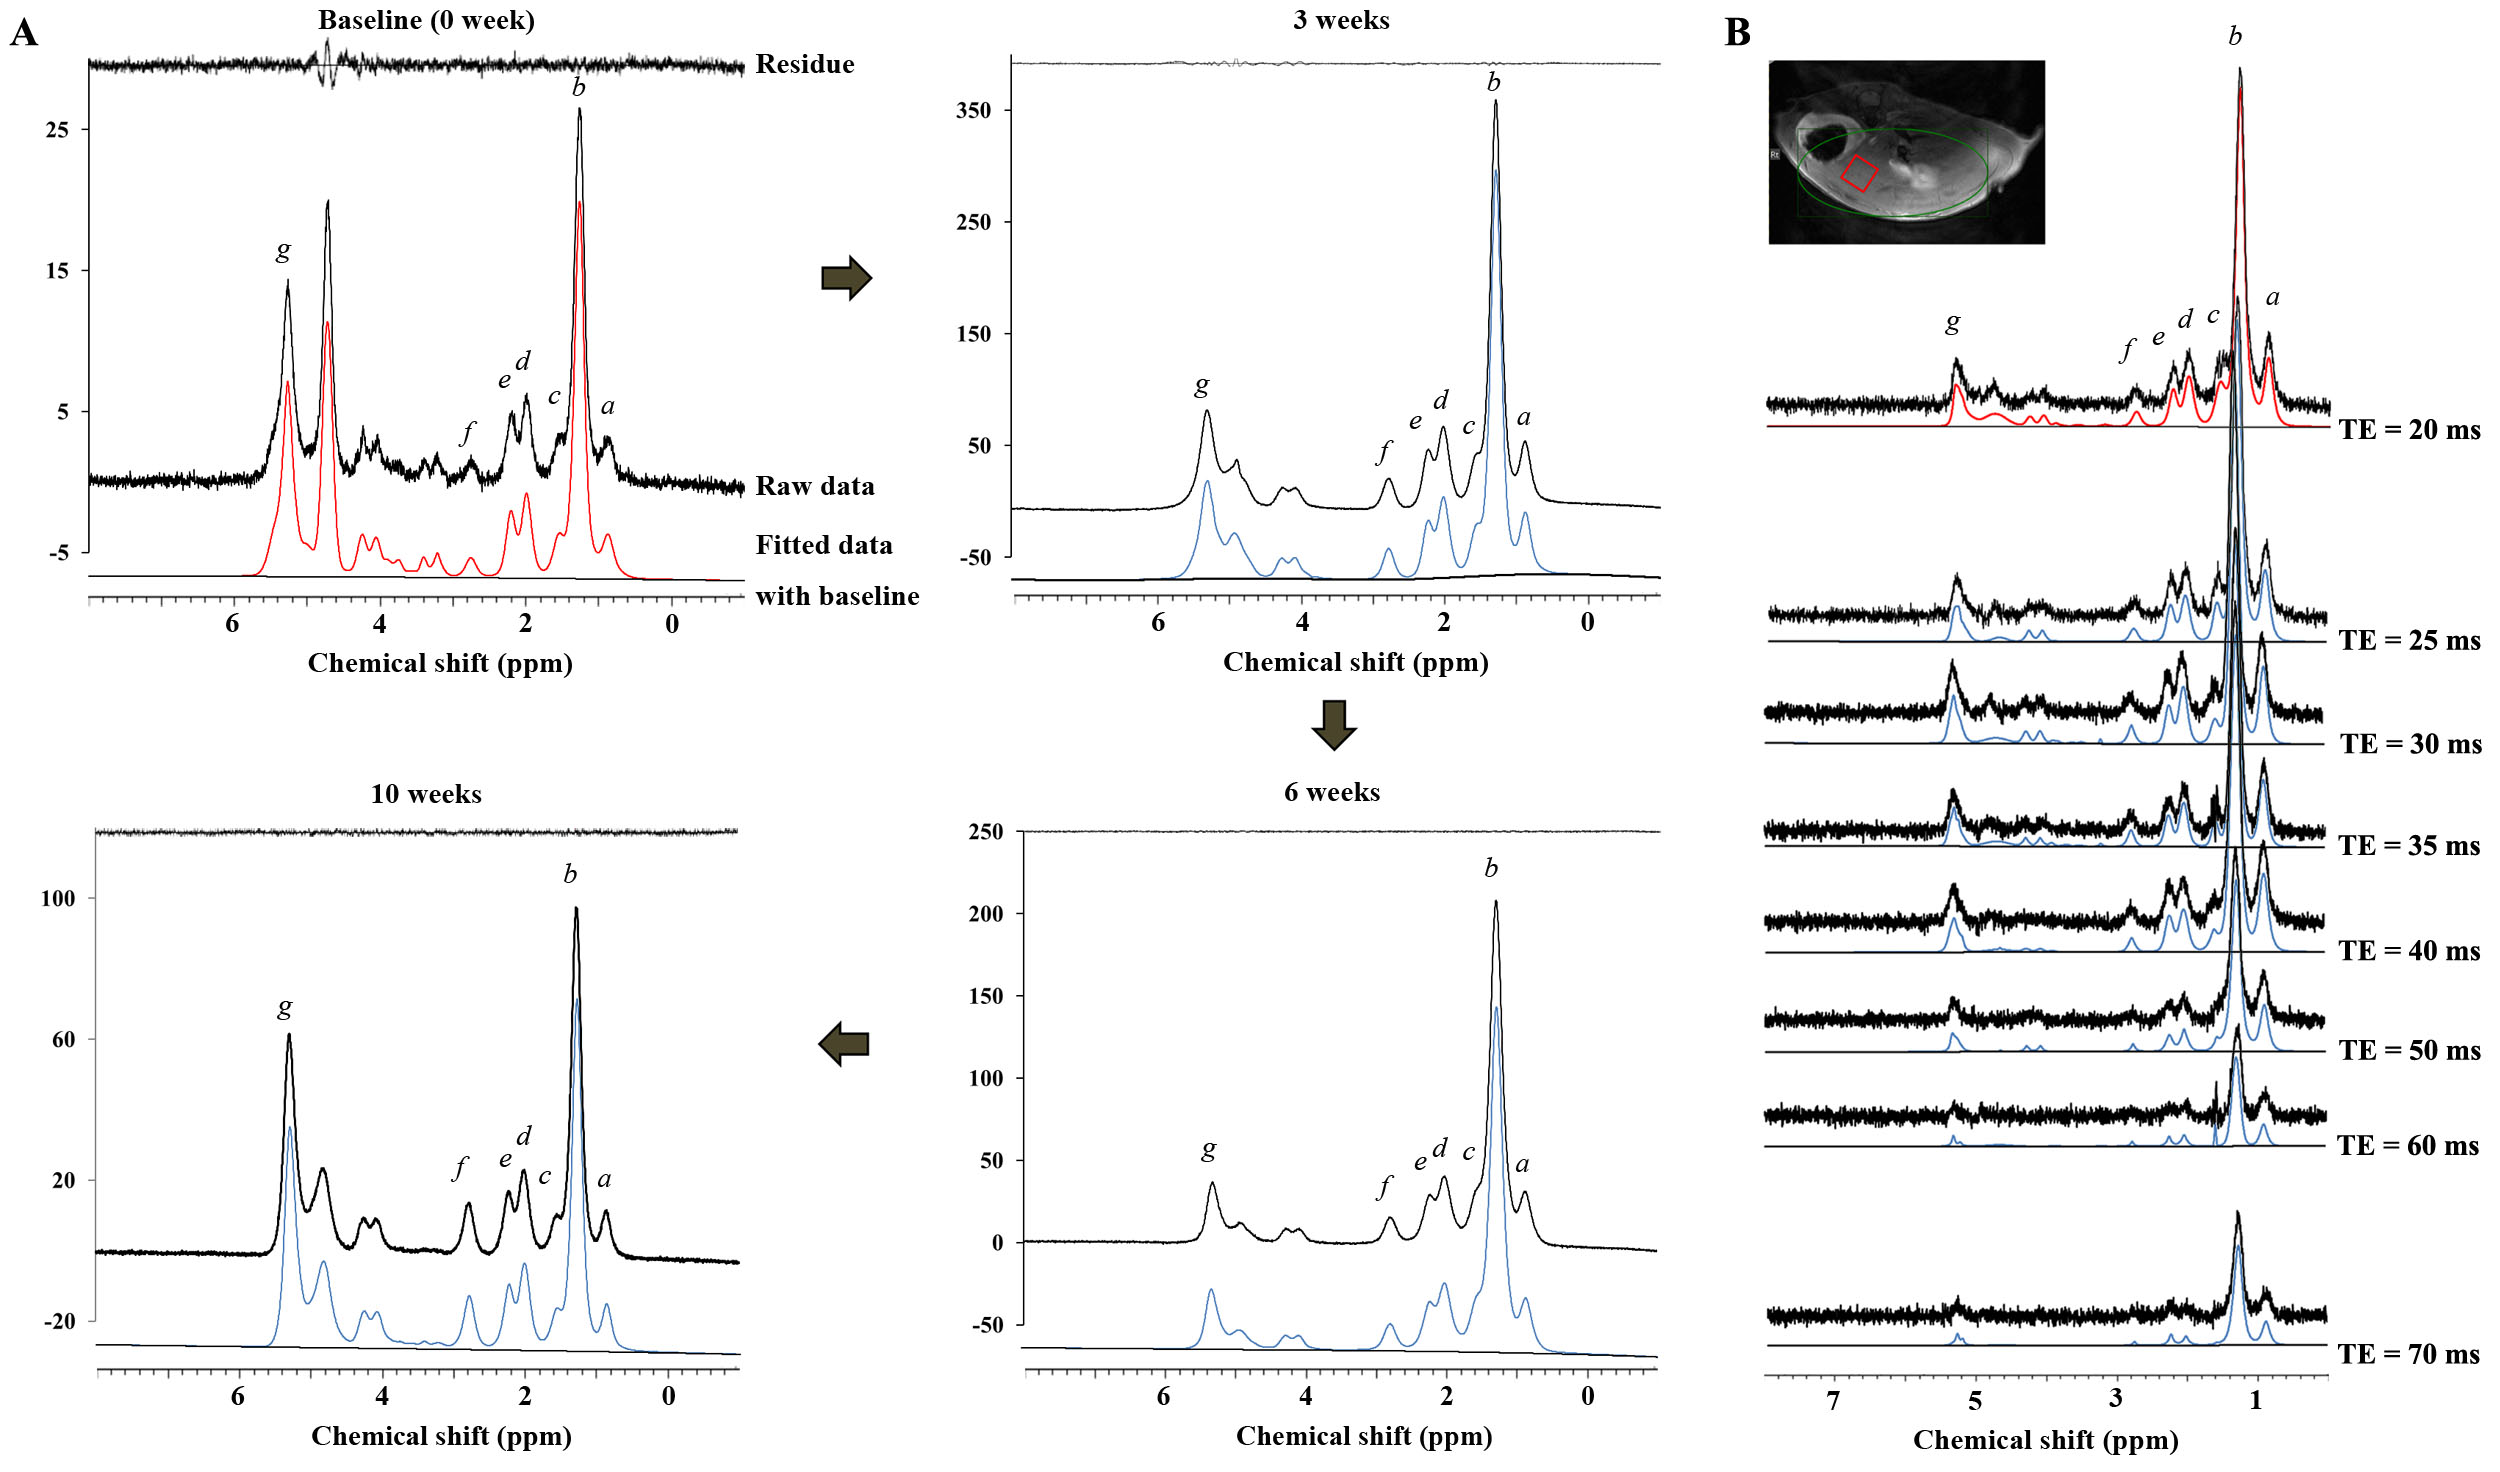
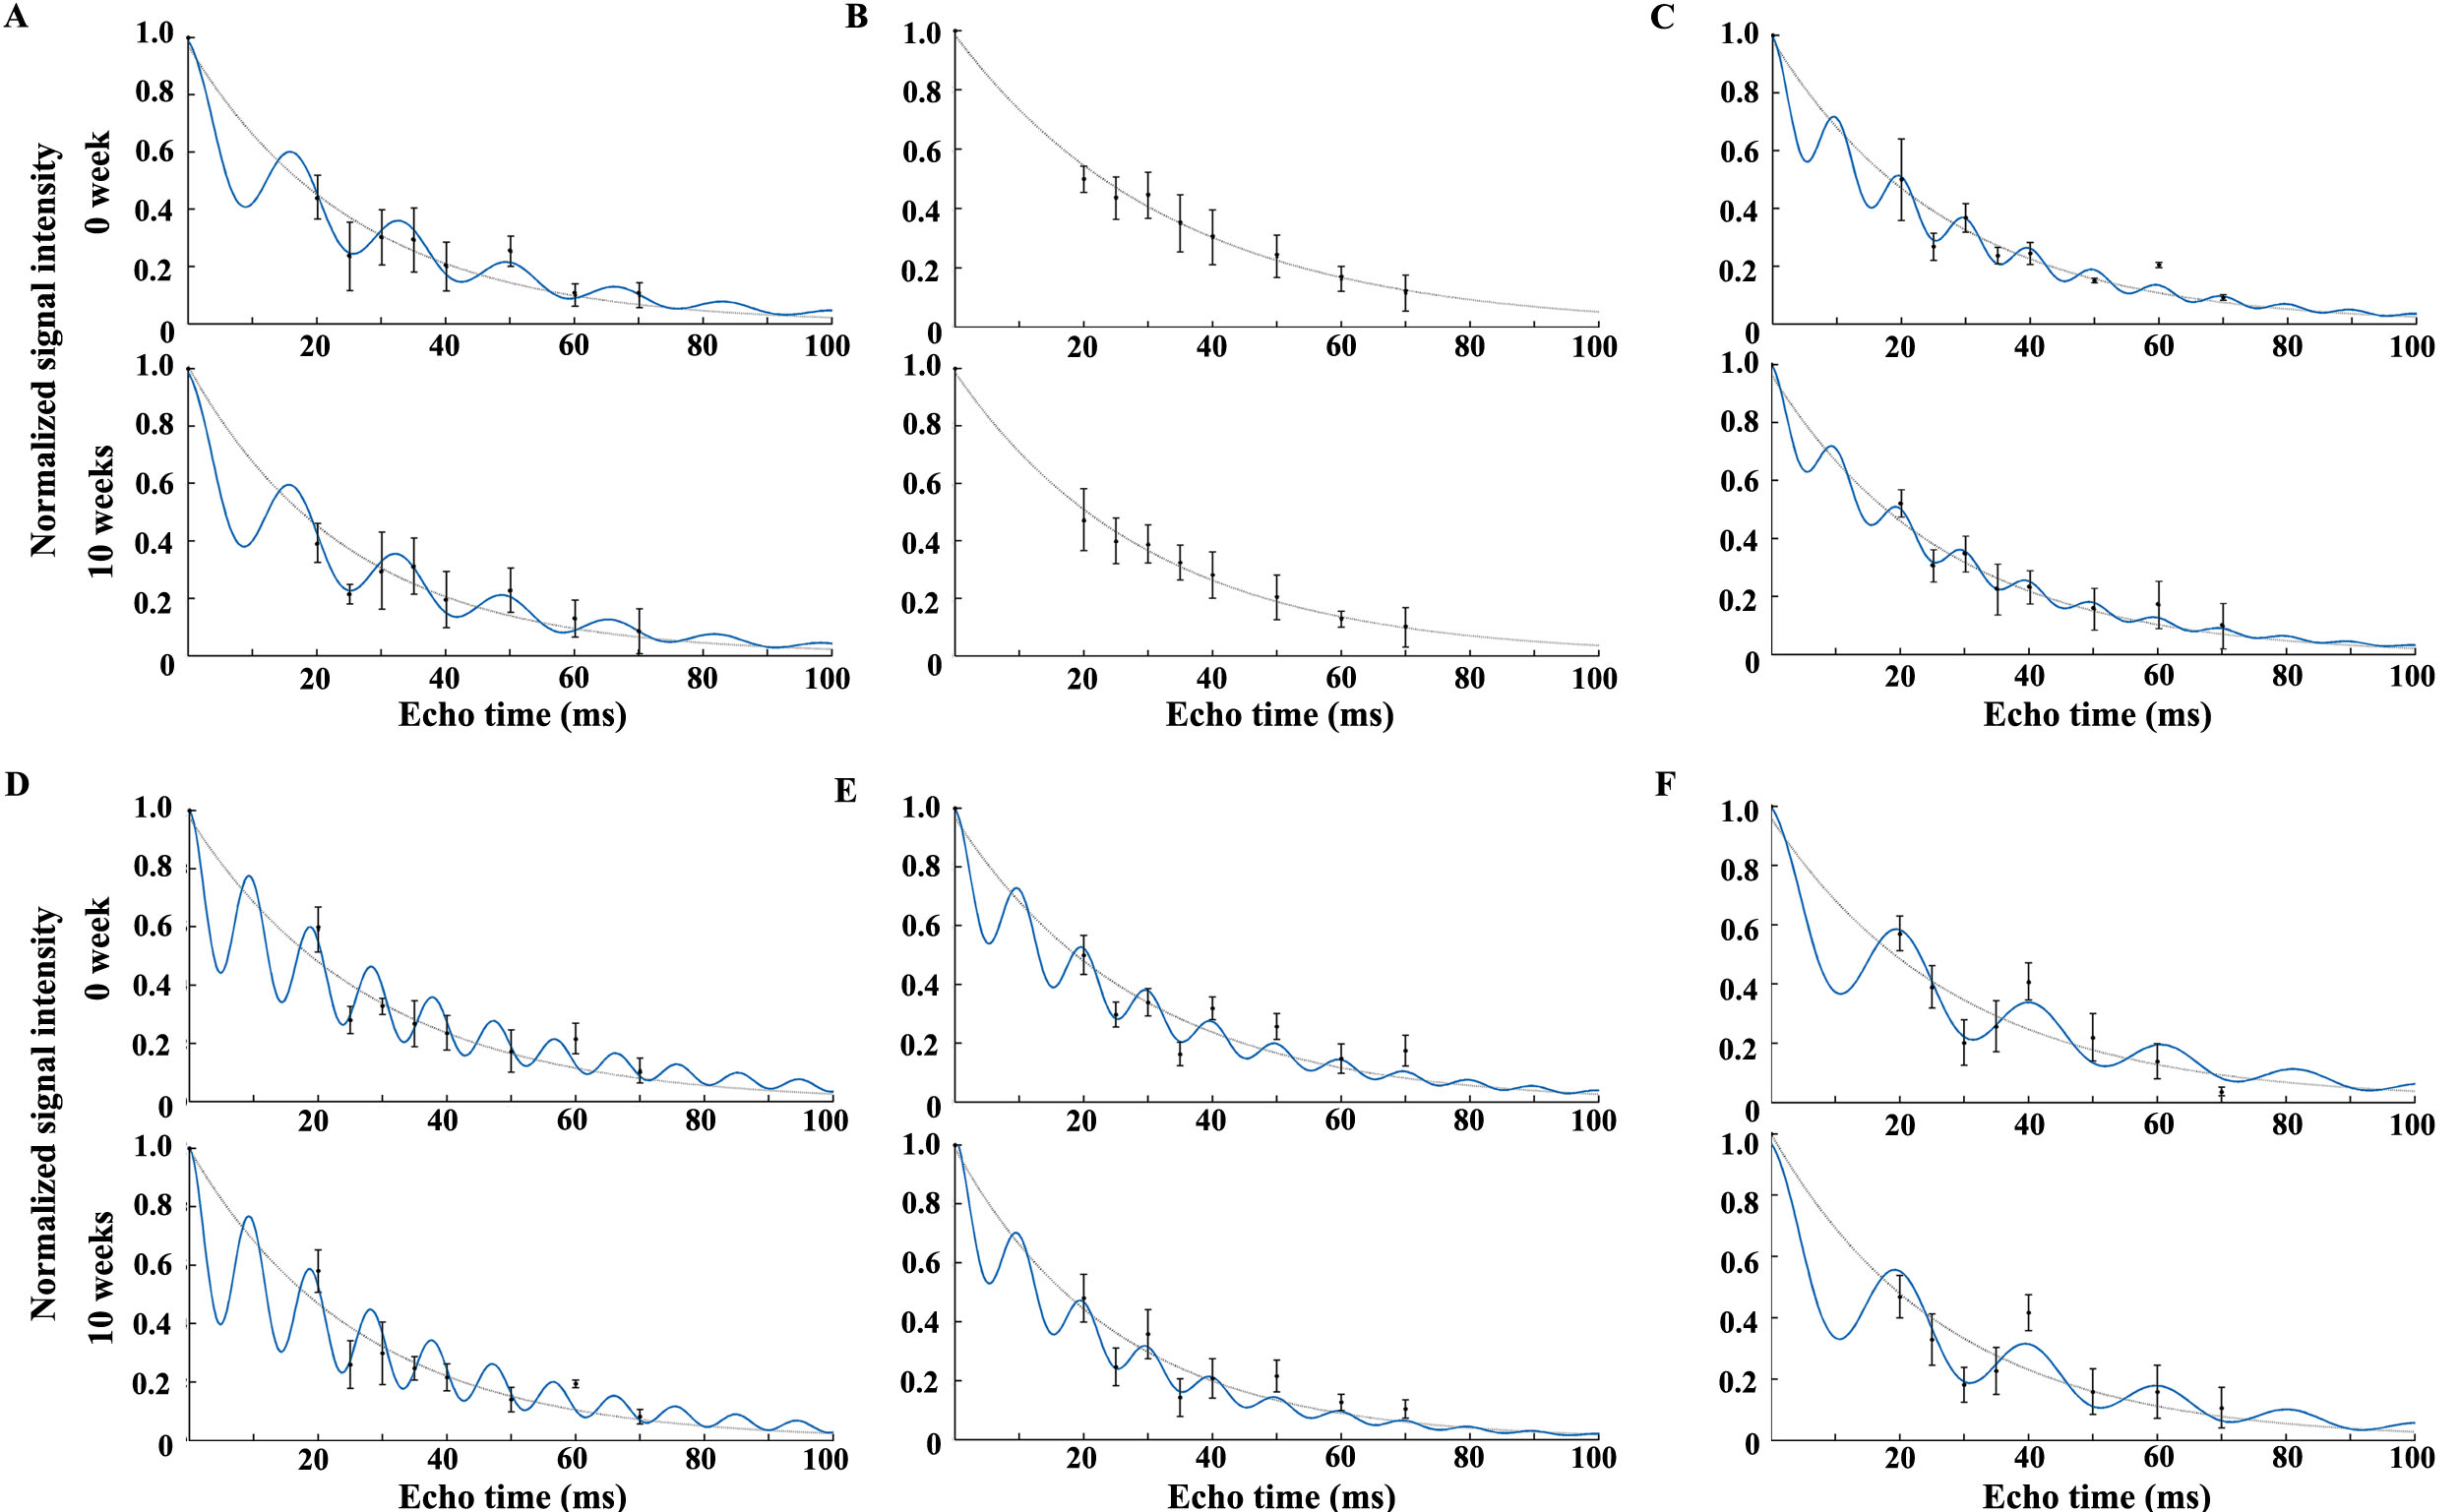
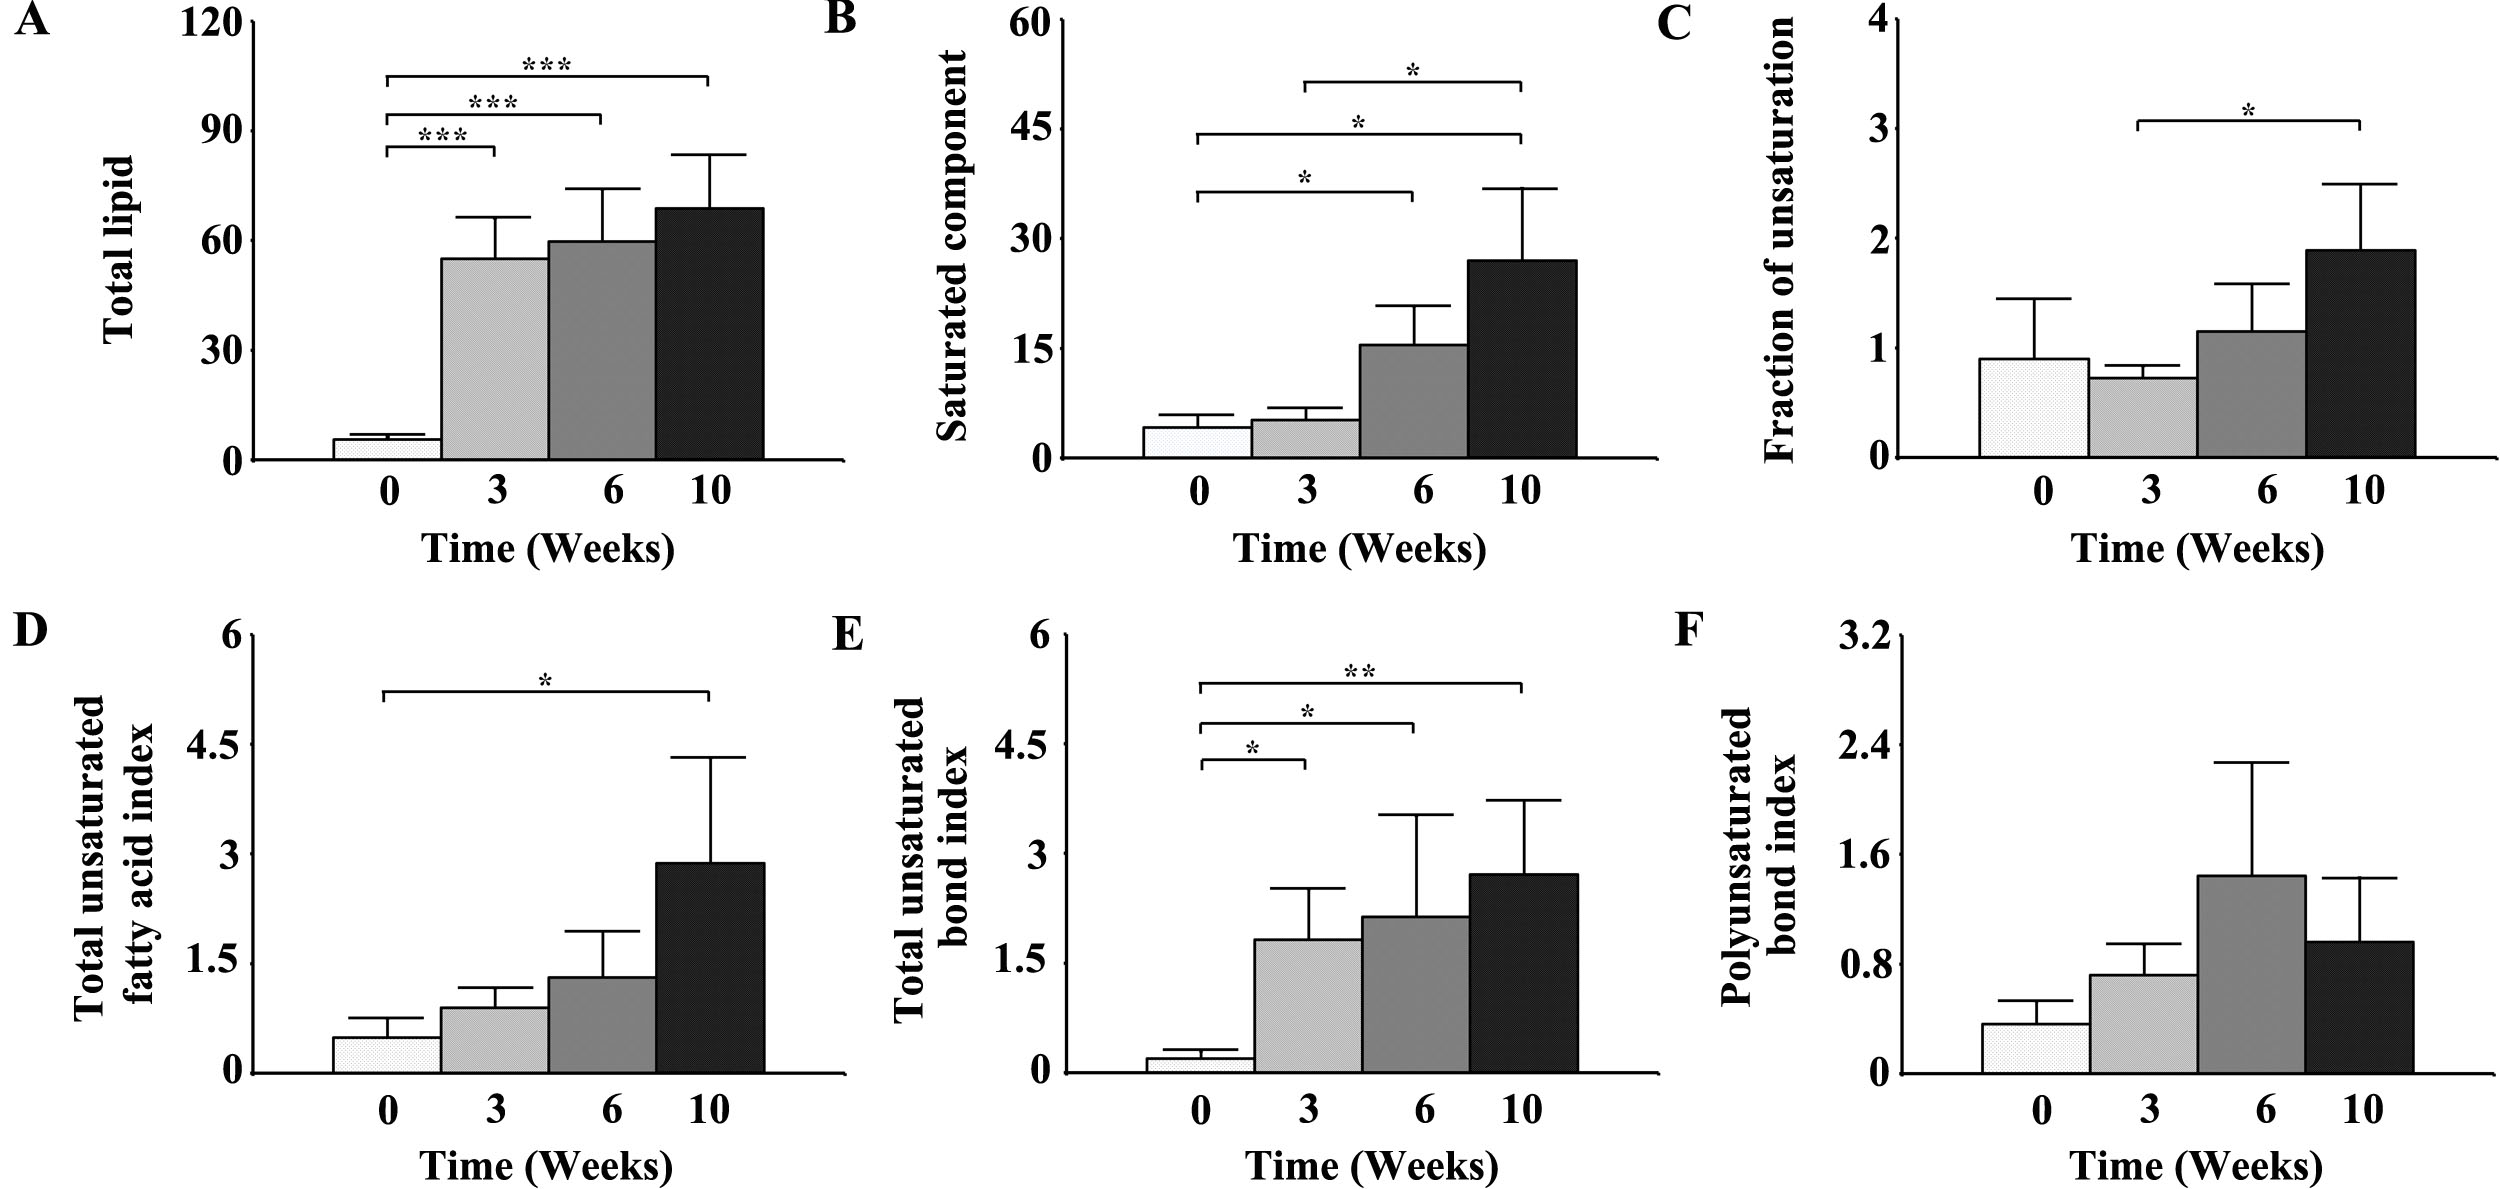
All animals (eight male C57BL/6J mice weighting 22-24 g) were housed in standard plastic cages with ad libitum access to water. Their weight was monitored for 10 weeks. All animals were fed a methionine- and choline-deficient (MCD) diet of pellets composed of 10% cornstarch, 10% dextrin, and 41% sucrose. Acquisition of MR imaging and spectroscopy were performed on a 9.4 T magnetic resonance animal scanner (Biospec 94/20 USR, Bruker BioSpin MRI GmbH, Ettlingen, Germany) equipped with a 20-cm bore magnet with a 400 mT/m gradient. We used the localized STEAM [repetition time (TR) = 5000 ms; mixing time (TM) = 3.5 ms; echo time (TE) = 20 ms; number of signal averages (NSA) = 128; acquisition data points = 2,048; acquisition bandwidth = 5,000 Hz; voxel size = 3×3×3 mm3 (2.7 mL)] and multiple-TE STEAM [TR = 5000 ms; TM = 3.5 ms; multiple-TE = 20, 25, 30, 35, 40, 50, 60, and 70 ms; NSA = 16; acquisition data points = 2,048; acquisition bandwidth = 5,000 Hz; voxel size = 3×3×3 mm3 (2.7 mL)]. The water resonance signal (~4.75 ppm) of the volume of interest in the MCD-fed mice liver was suppressed by variable pulse power and optimized relaxation delays with outer volume suppression.3 All MR spectroscopy data were quantified with Linear Combination of Model spectra (LCModel, version 6.3.1-1K) software, which is useful for fitting data acquired by STEAM sequences.4 The mono-exponential equation (M(TE)=M0e(-TE/T2)) and enhanced-curve equation (M(TE)=M0e(-TE/T2)[cos(πJETE)+b]) were used to measure the spin-spin relaxation time (T2) of the lipid resonances with the J-coupling evolution value (JE) and zero TE value (M0).5 The saturated component [SC; 3(CH2)n/2(CH3)] was used as an estimate for saturated fatty acids. The unsaturated components [fraction of unsaturation (FU): CH2-CH=CH-CH2-CH2/2(CH2‑CH2‑CO); total unsaturated fatty acid index (TUFA): 3(CH2-CH=CH-CH2)/4(CH3); total unsaturated bond index (TUBI): 3(CH=CH)/2(CH3); and polyunsaturated bond index (PUBI): 3(CH=CH-CH2-CH=CH)/2(CH3)] were scaled using the terminal methyl group (CH3) resonance as an internal reference.Results
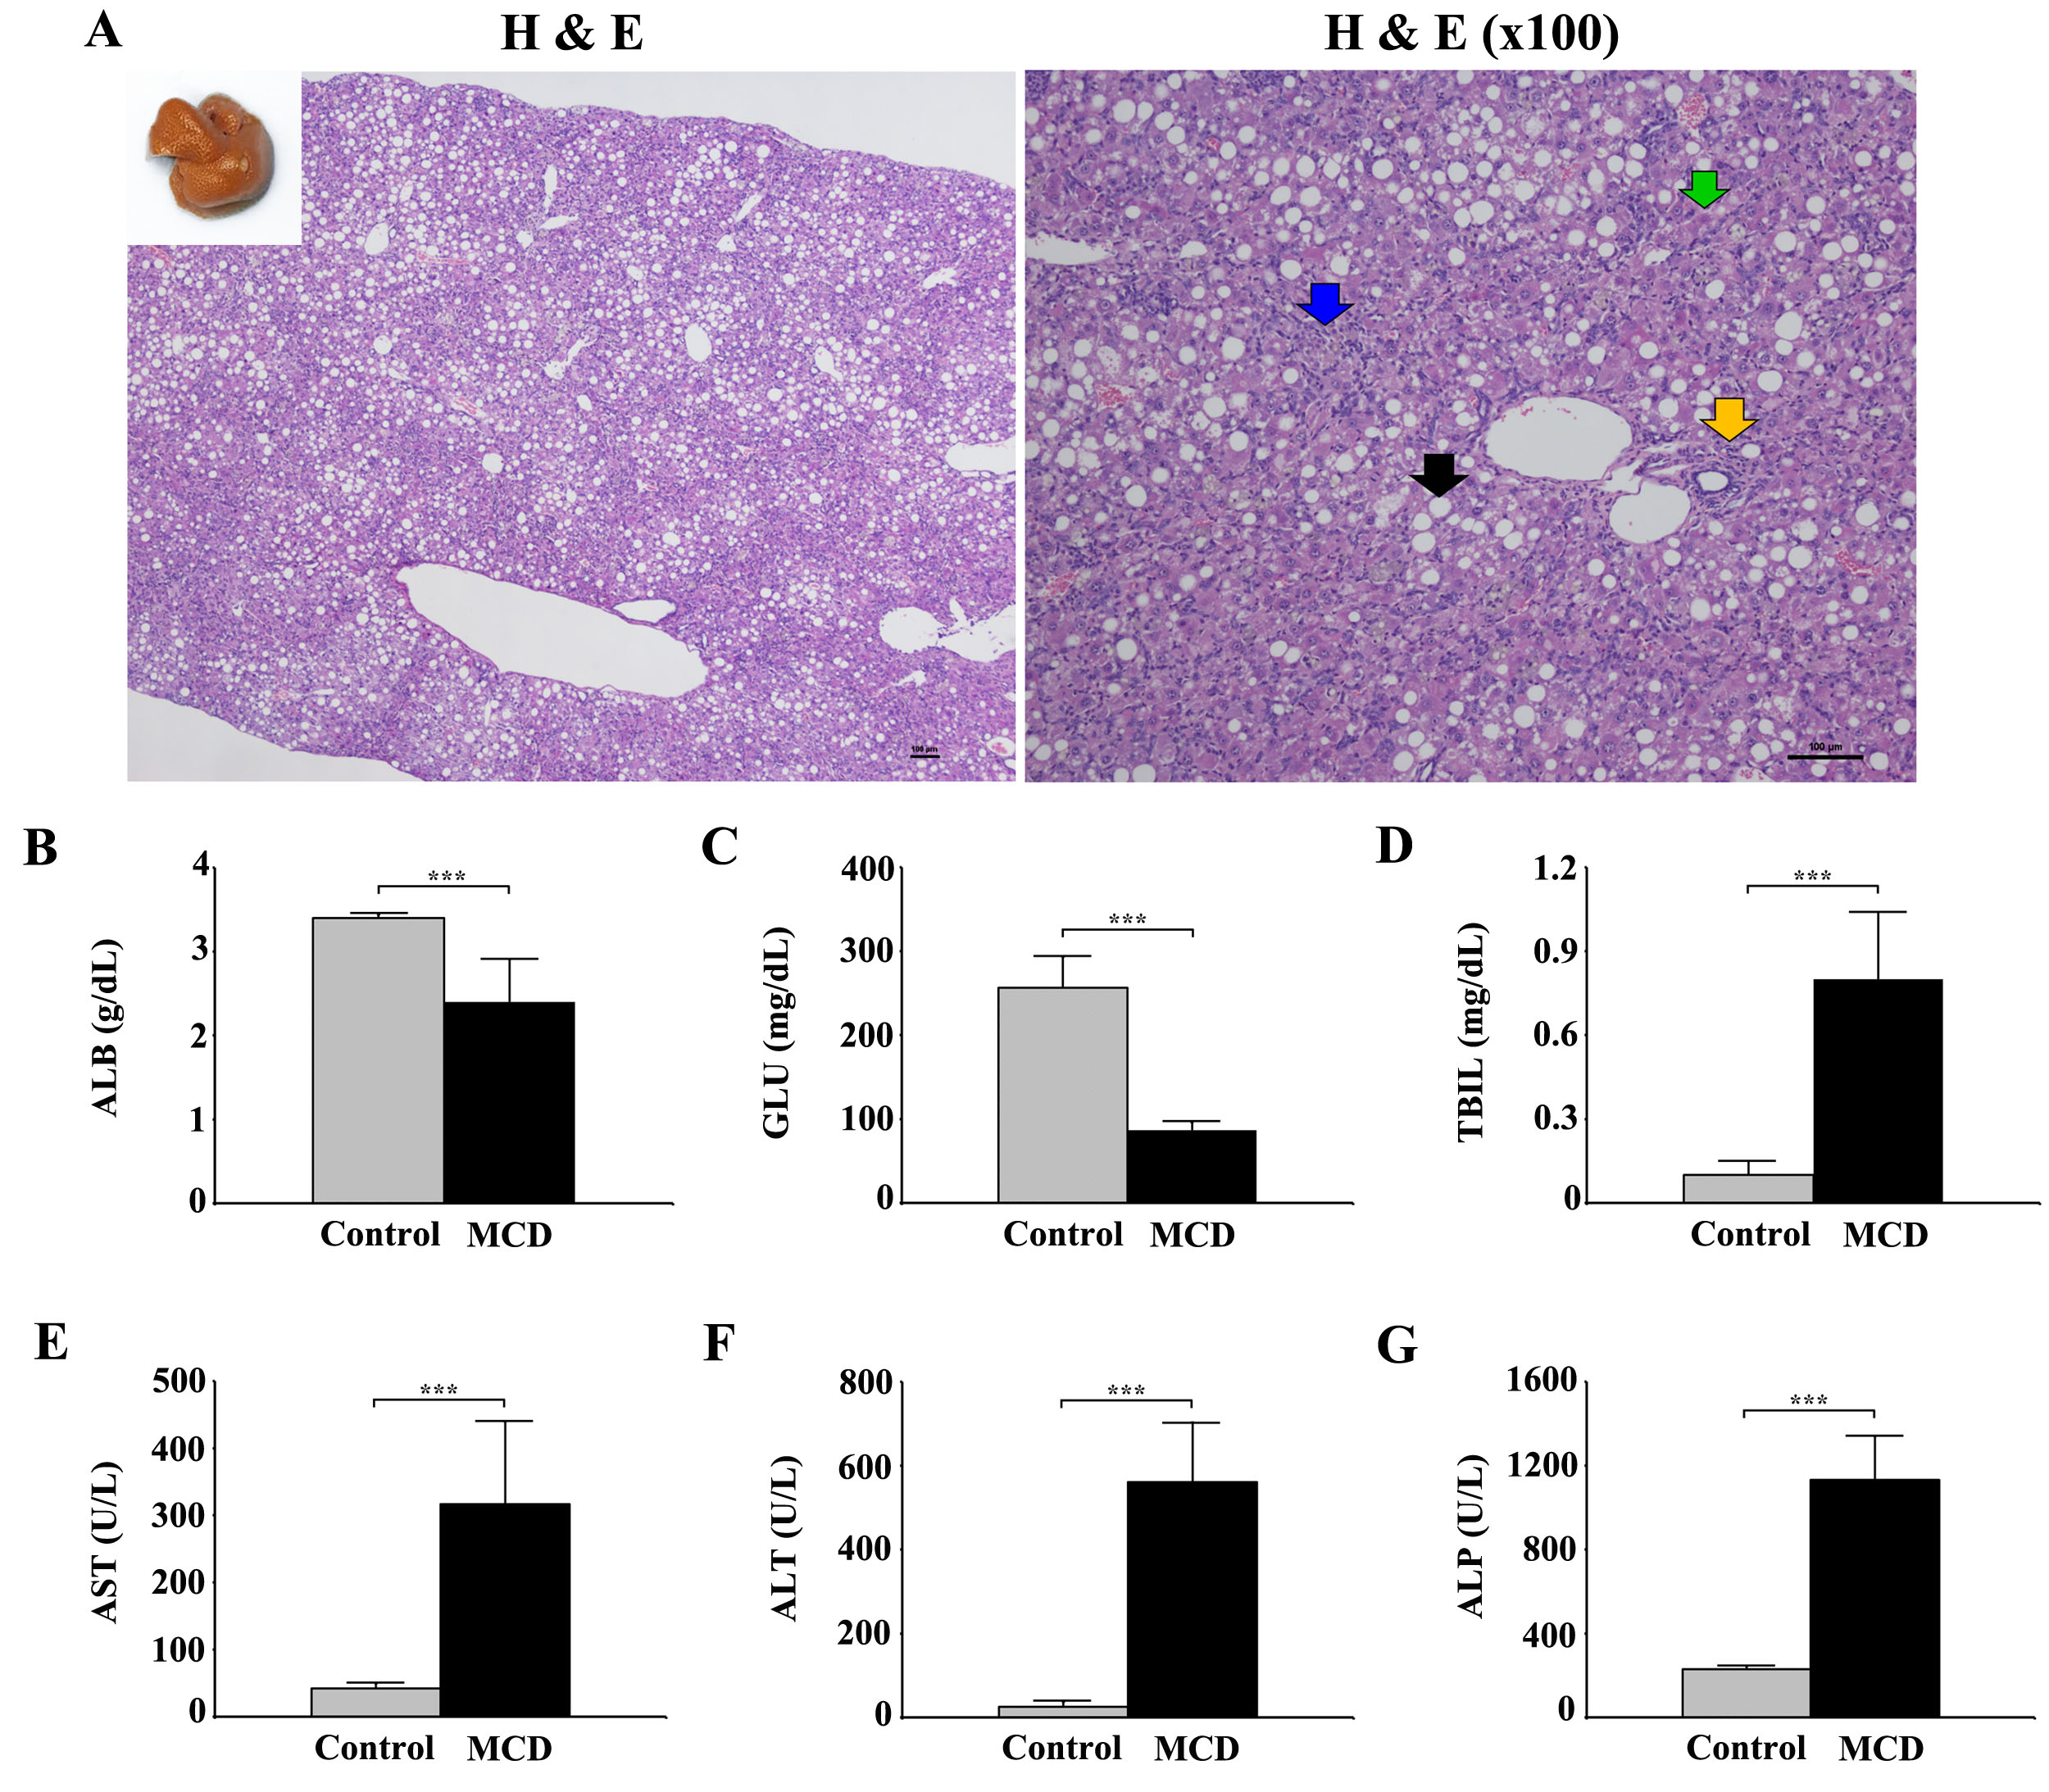
As shown in Fig. 1, early metabolic changes and body weight loss were observed at three weeks. As shown in Fig. 2, we obtained strong signals for the lipid resonances with significant increases. Figure 3 shows that serum albumin and glucose levels was significantly lower in MCD-fed mice (ALB, 2.4 ± 0.51 g/dL, p < 0.001; GLU, 86.8 ± 9.32 mg/dL, p < 0.001 compared to in control mice). Total bilirubin (TBIL), aspartate aminotransferase (AST), alanine aminotransferase (ALT), and alkaline phosphatase (ALP) levels were significantly higher in MCD-fed mice (TBIL, 0.8 ± 0.24 mg/dL, p < 0.001; AST, 316.8 ± 123.34 U/L, p < 0.001; ALT, 560.8 ± 141.90 U/L, p < 0.001; ALP, 1131.0 ± 209.13 U/L, p < 0.001 compared to in control mice). As shown in Fig. 4, the differences in the T2 relaxation times were > 1 ms, and these resonances differed significantly between 0 and 10 weeks (~2.03 ppm, p < 0.05; ~2.25 ppm, p < 0.001; ~2.78 ppm, p < 0.01). Figure 5 shows that the lipid contents (TL, p < 0.001; SC, p < 0.05; TUFA, p < 0.05; TUBI, p < 0.01) were significantly upregulated in MCD-fed mice compared to the values obtained at 0 weeks, while FU (p = 0.096) and PUBI (p = 0.188) were not significantly different.Discussion and Conclusion
The results of this study demonstrated that hepatic unsaturated fatty acid levels increased during the development of NASH. In addition, we investigated the relaxation behaviors of the resonances of lipid components (methyl, methylene, β-methylene to the carboxyl group, allylic group, α-methylene to the carboxyl group, and diallylic group). Our findings suggest that fatty acid metabolism in NASH induced by a MCD diet was distinguishable from progressive NAFLD by in vivo spectra quantification and relaxation measurements.Acknowledgements
This study was supported by grants (2012-007883) from the Mid-career Researcher Program through the National Research Foundation (NRF) funded by the Ministry of Science, ICT & Future Planning (MSIP) of Korea.References
1. Cheung JS, Fan SJ, Gao DS, et al. In vivo lipid profiling using proton magnetic resonance spectroscopy in an experimental liver fibrosis model. Acad. Radiol. 2011;18(3):377-383.
2. Hamilton G, Middleton MS, Bydder M, et al. Effect of PRESS and STEAM sequences on magnetic resonance spectroscopic liver fat quantification. J. Magn. Reson. Imaging. 2009;30(1):145-152.
3. Tkáč I, Starčuk Z, Choi IY, et al. In vivo 1H NMR spectroscopy of rat brain at 1 ms echo time. Magn. Reson. Med. 1999;41(EPFL-ARTICLE-177519):649-656.
4. Provencher SW, 2001. Automatic quantitation of localized in vivo 1H spectra with LCModel. NMR Biomed. 2001;14(4):260-264.
5. Yahya A, Tessier AG, Fallone BG. Effect of J-coupling on lipid composition determination with localized proton magnetic resonance spectroscopy at 9.4 T. J. Magn. Reson. Imaging. 2011;34(6):1388-1396.
Figures