0444
Standardisation and quantification of 23Na-MRI: repeatability and reproducibility of sodium imaging1Informatics, Imaging and Data Sciences, The University of Manchester, Manchester, United Kingdom, 2CRUK and EPSRC Cancer Imaging Centre in Cambridge and Manchester, United Kingdom, 3Department of Radiology, University of Cambridge, Cambridge, United Kingdom, 4Bioxydyn Ltd., Manchester, United Kingdom
Synopsis
Based on its sensitivity to cell viability and tissue microstructure, sodium MRI has the potential to provide quantitative biomarkers of tumor grade and response to therapy. For biomarkers such as total sodium concentration (TSC) to have clinical utility, they require technical and biological validation. This work focuses on the technical validation of TSC, specifically assessing the repeatability and reproducibility of measurements in healthy volunteers. The results presented here show consistent TSC measurements across repeated scans at different sites, and good repeatability and reproducibility (coefficients of variation, CoVs < 10%).
Introduction
Sodium MRI is sensitive to changes in cell viability and tissue microstructure, and as such has the potential to provide quantitative biomarkers of tumor grade and response to therapy. Total sodium concentration (TSC), for example, is sensitive to therapy-induced changes in both breast and brain tumors1,2. Biomarkers such as TSC require technical and biological validation to become useful clinical tools, establishing their accuracy and precision, and their relationship to cancer biology3. This work provides an initial step in the technical validation of TSC by assessing the repeatability and reproducibility of measurements in healthy volunteers performed at two sites.Methods
Eleven healthy volunteers (mean ± standard deviation (SD) = 32 ± 6 years, 3 females) were scanned at two sites, A and B. Six volunteers were scanned twice at both sites, and 5 were scanned twice at one site and once at the other. Repeatability (intra-site variation) and reproducibility (inter-site variation) were assessed with scans <1 hour and between 1 and 41 days apart, respectively. Sites had different scanners (GE 3 T MR750 and Philips 3 T Achieva), but both used the same model of 1H/23Na dual-tuned head coil (RAPID Biomedical GmbH, Germany). A 23Na 3D cones acquisition4,5 was performed at both sites: 4 mm isotropic, TE = 0.5 ms, TR = 100 ms, readout = 10 ms, 3 averages, 11 minutes. 1H T1 images were also acquired for registration and segmentation.
Images were reconstructed6 after applying k-space density compensation weights7, and TSC maps were generated based on calibration phantoms placed in the field of view. TSC values were obtained from white matter (WM), grey matter (GM), and CSF, based on segmentations of co-registered 1H T1 images. In addition, a manual ROI analysis was performed by two observers to assess inter-observer agreement. Coefficients of variation (CoVs) of mean values were used to assess repeatability (from scans 1 and 2 at a given site) and reproducibility (from the first scan at each site).
Results and discussion
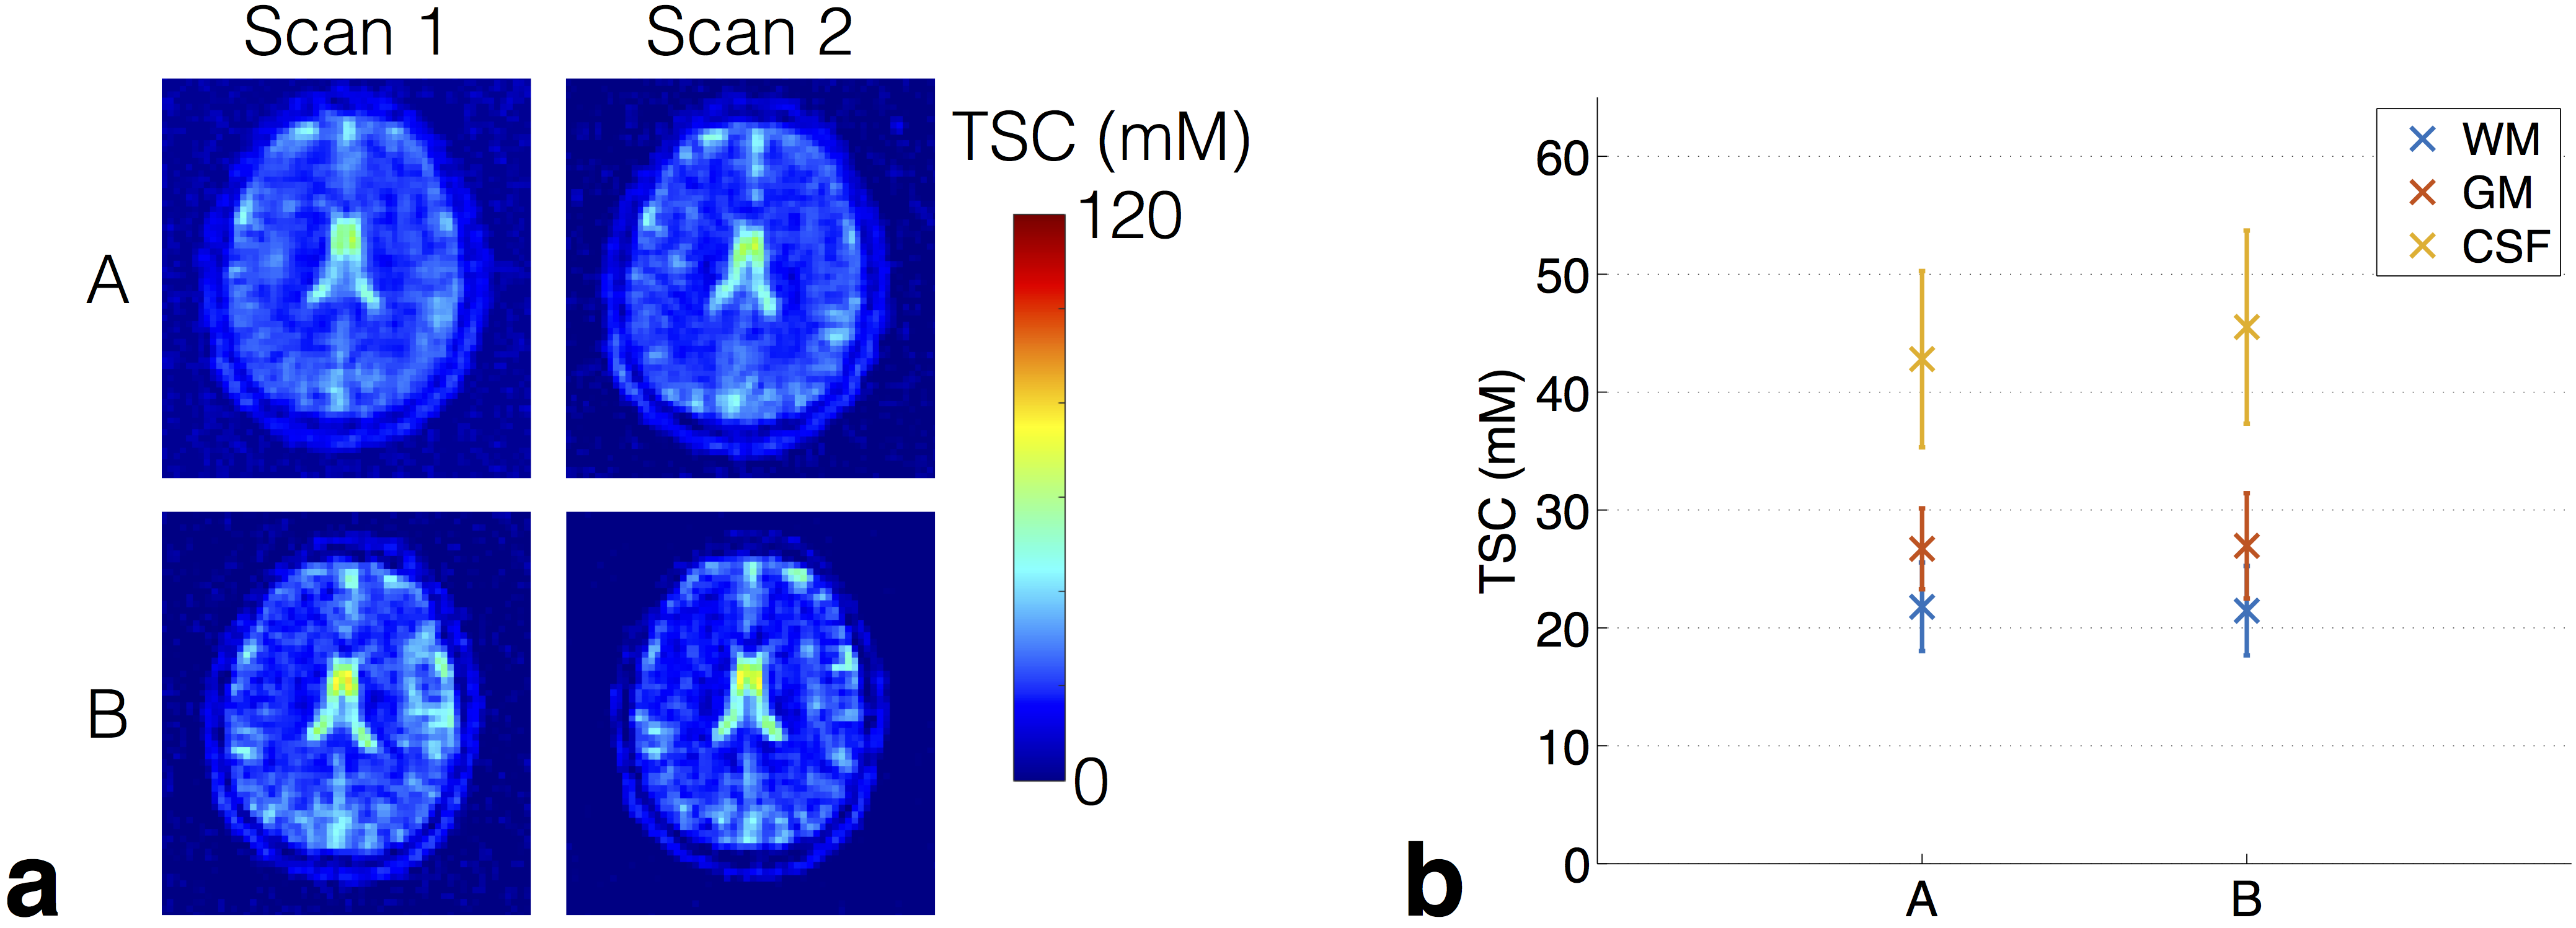
Example TSC maps are shown in Figure 1a, with the average WM, GM and CSF values for all subjects shown in Figure 1b. General TSC trends were consistent across sites, with mean GM concentrations slightly higher than WM; CSF values were higher and will be underestimated due to partial T1 recovery.
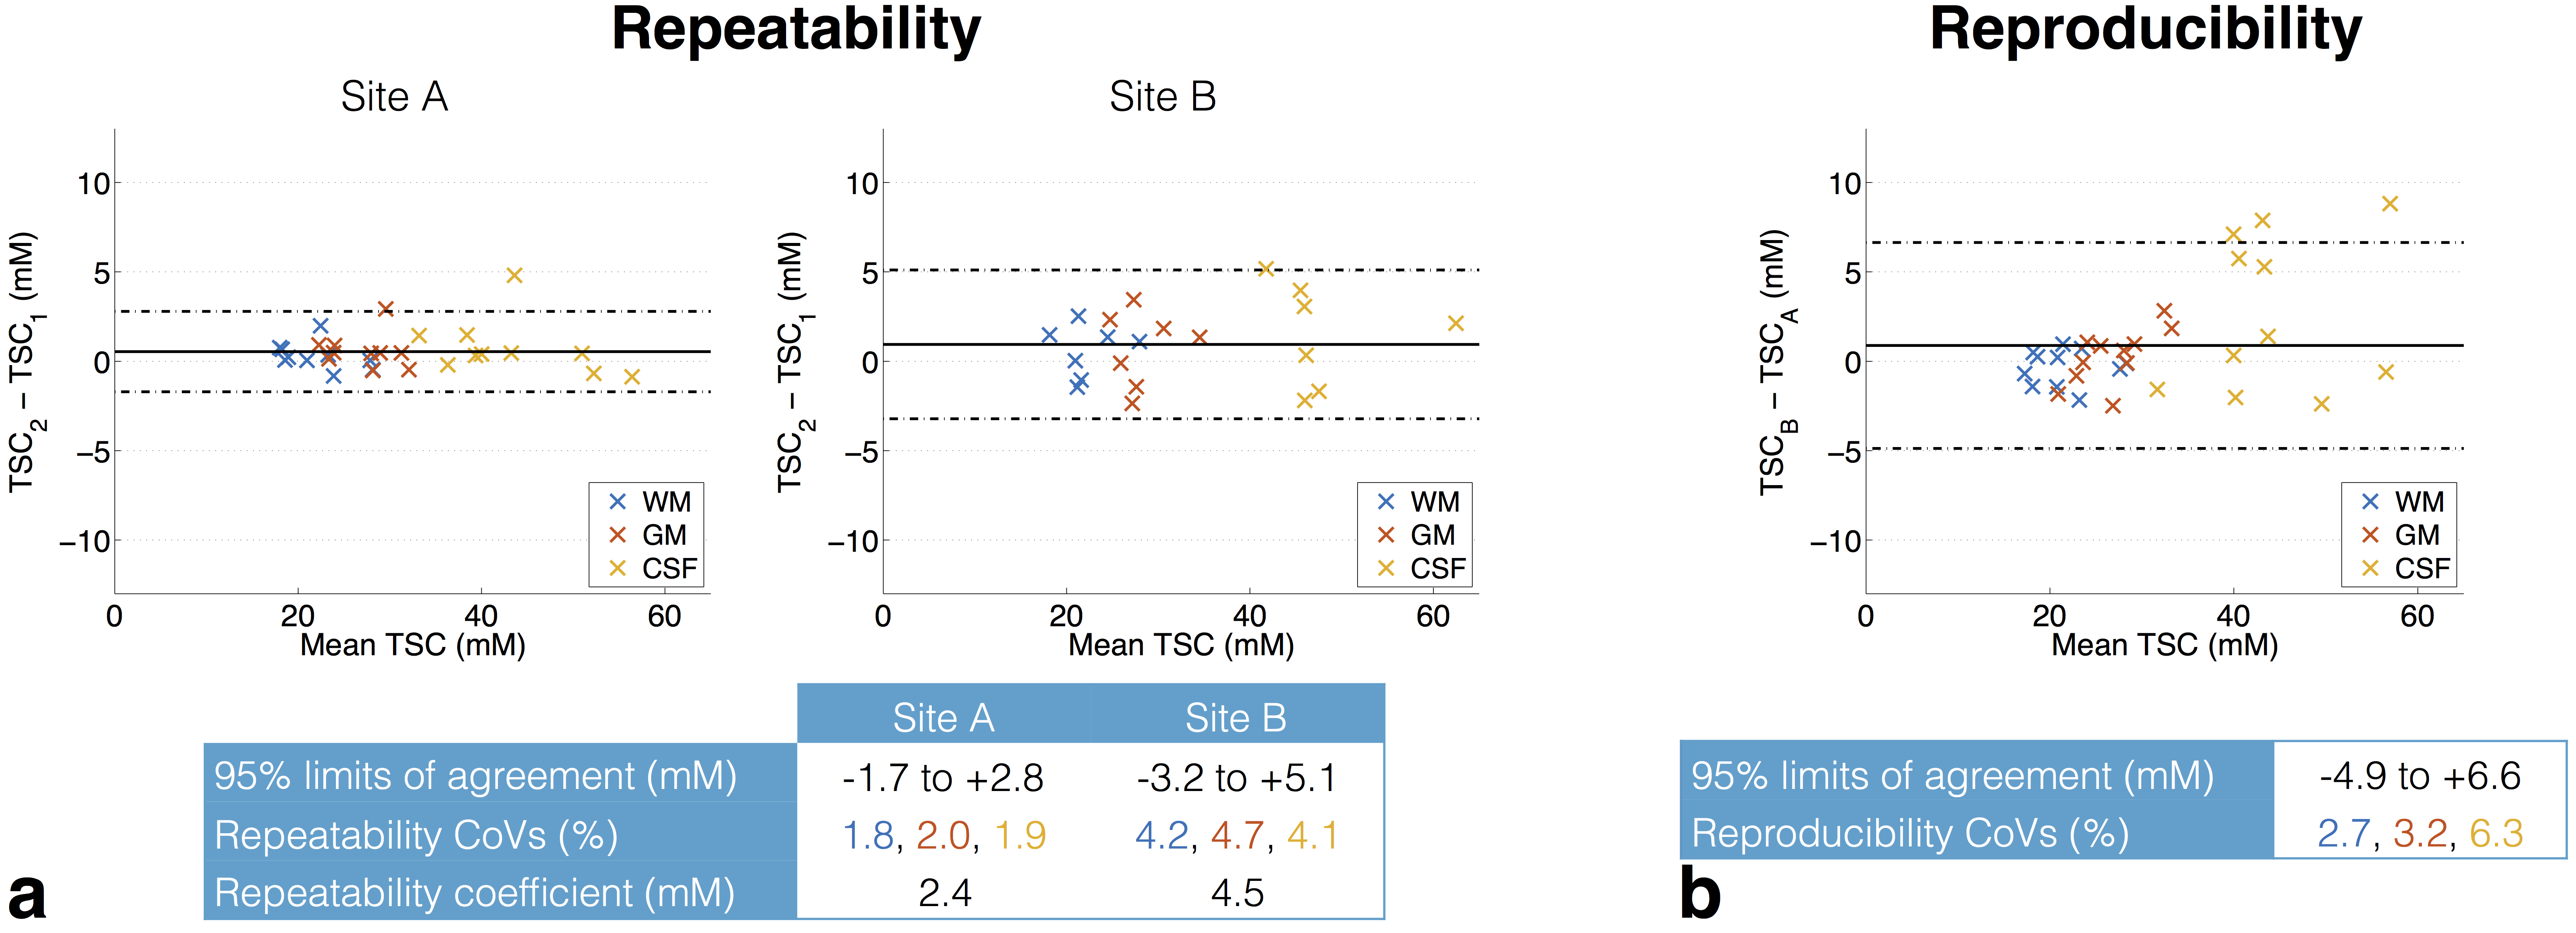
The repeatability and reproducibility of segmented TSC values are presented in Bland-Altman plots in Figures 2a and b, respectively. Measurements were more repeatable at site A than B, with mean repeatability coefficients of 2.4 and 4.5 mM, respectively (Figure 2a). CSF values were less reproducible than WM and GM (Figure 2b).
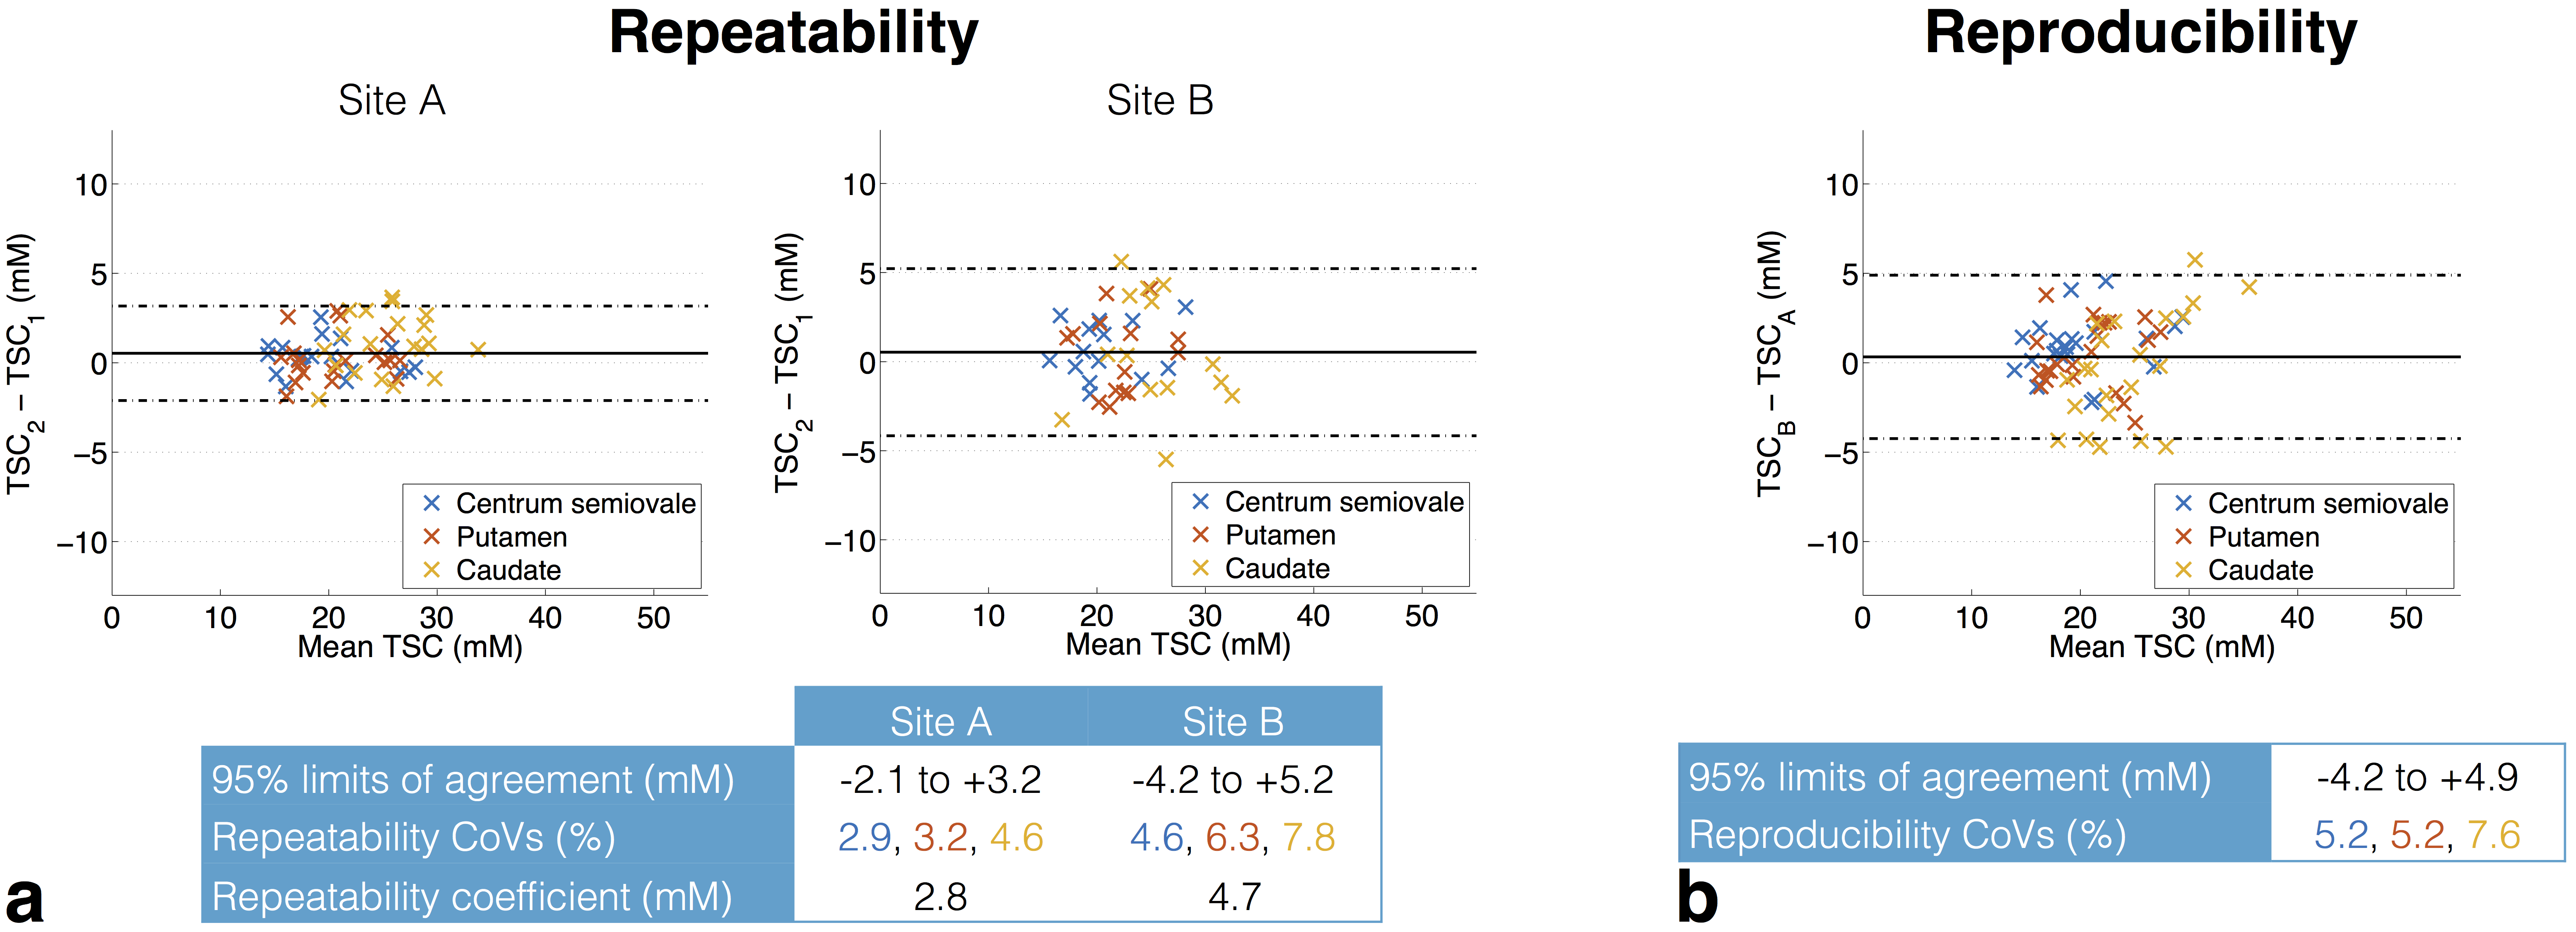
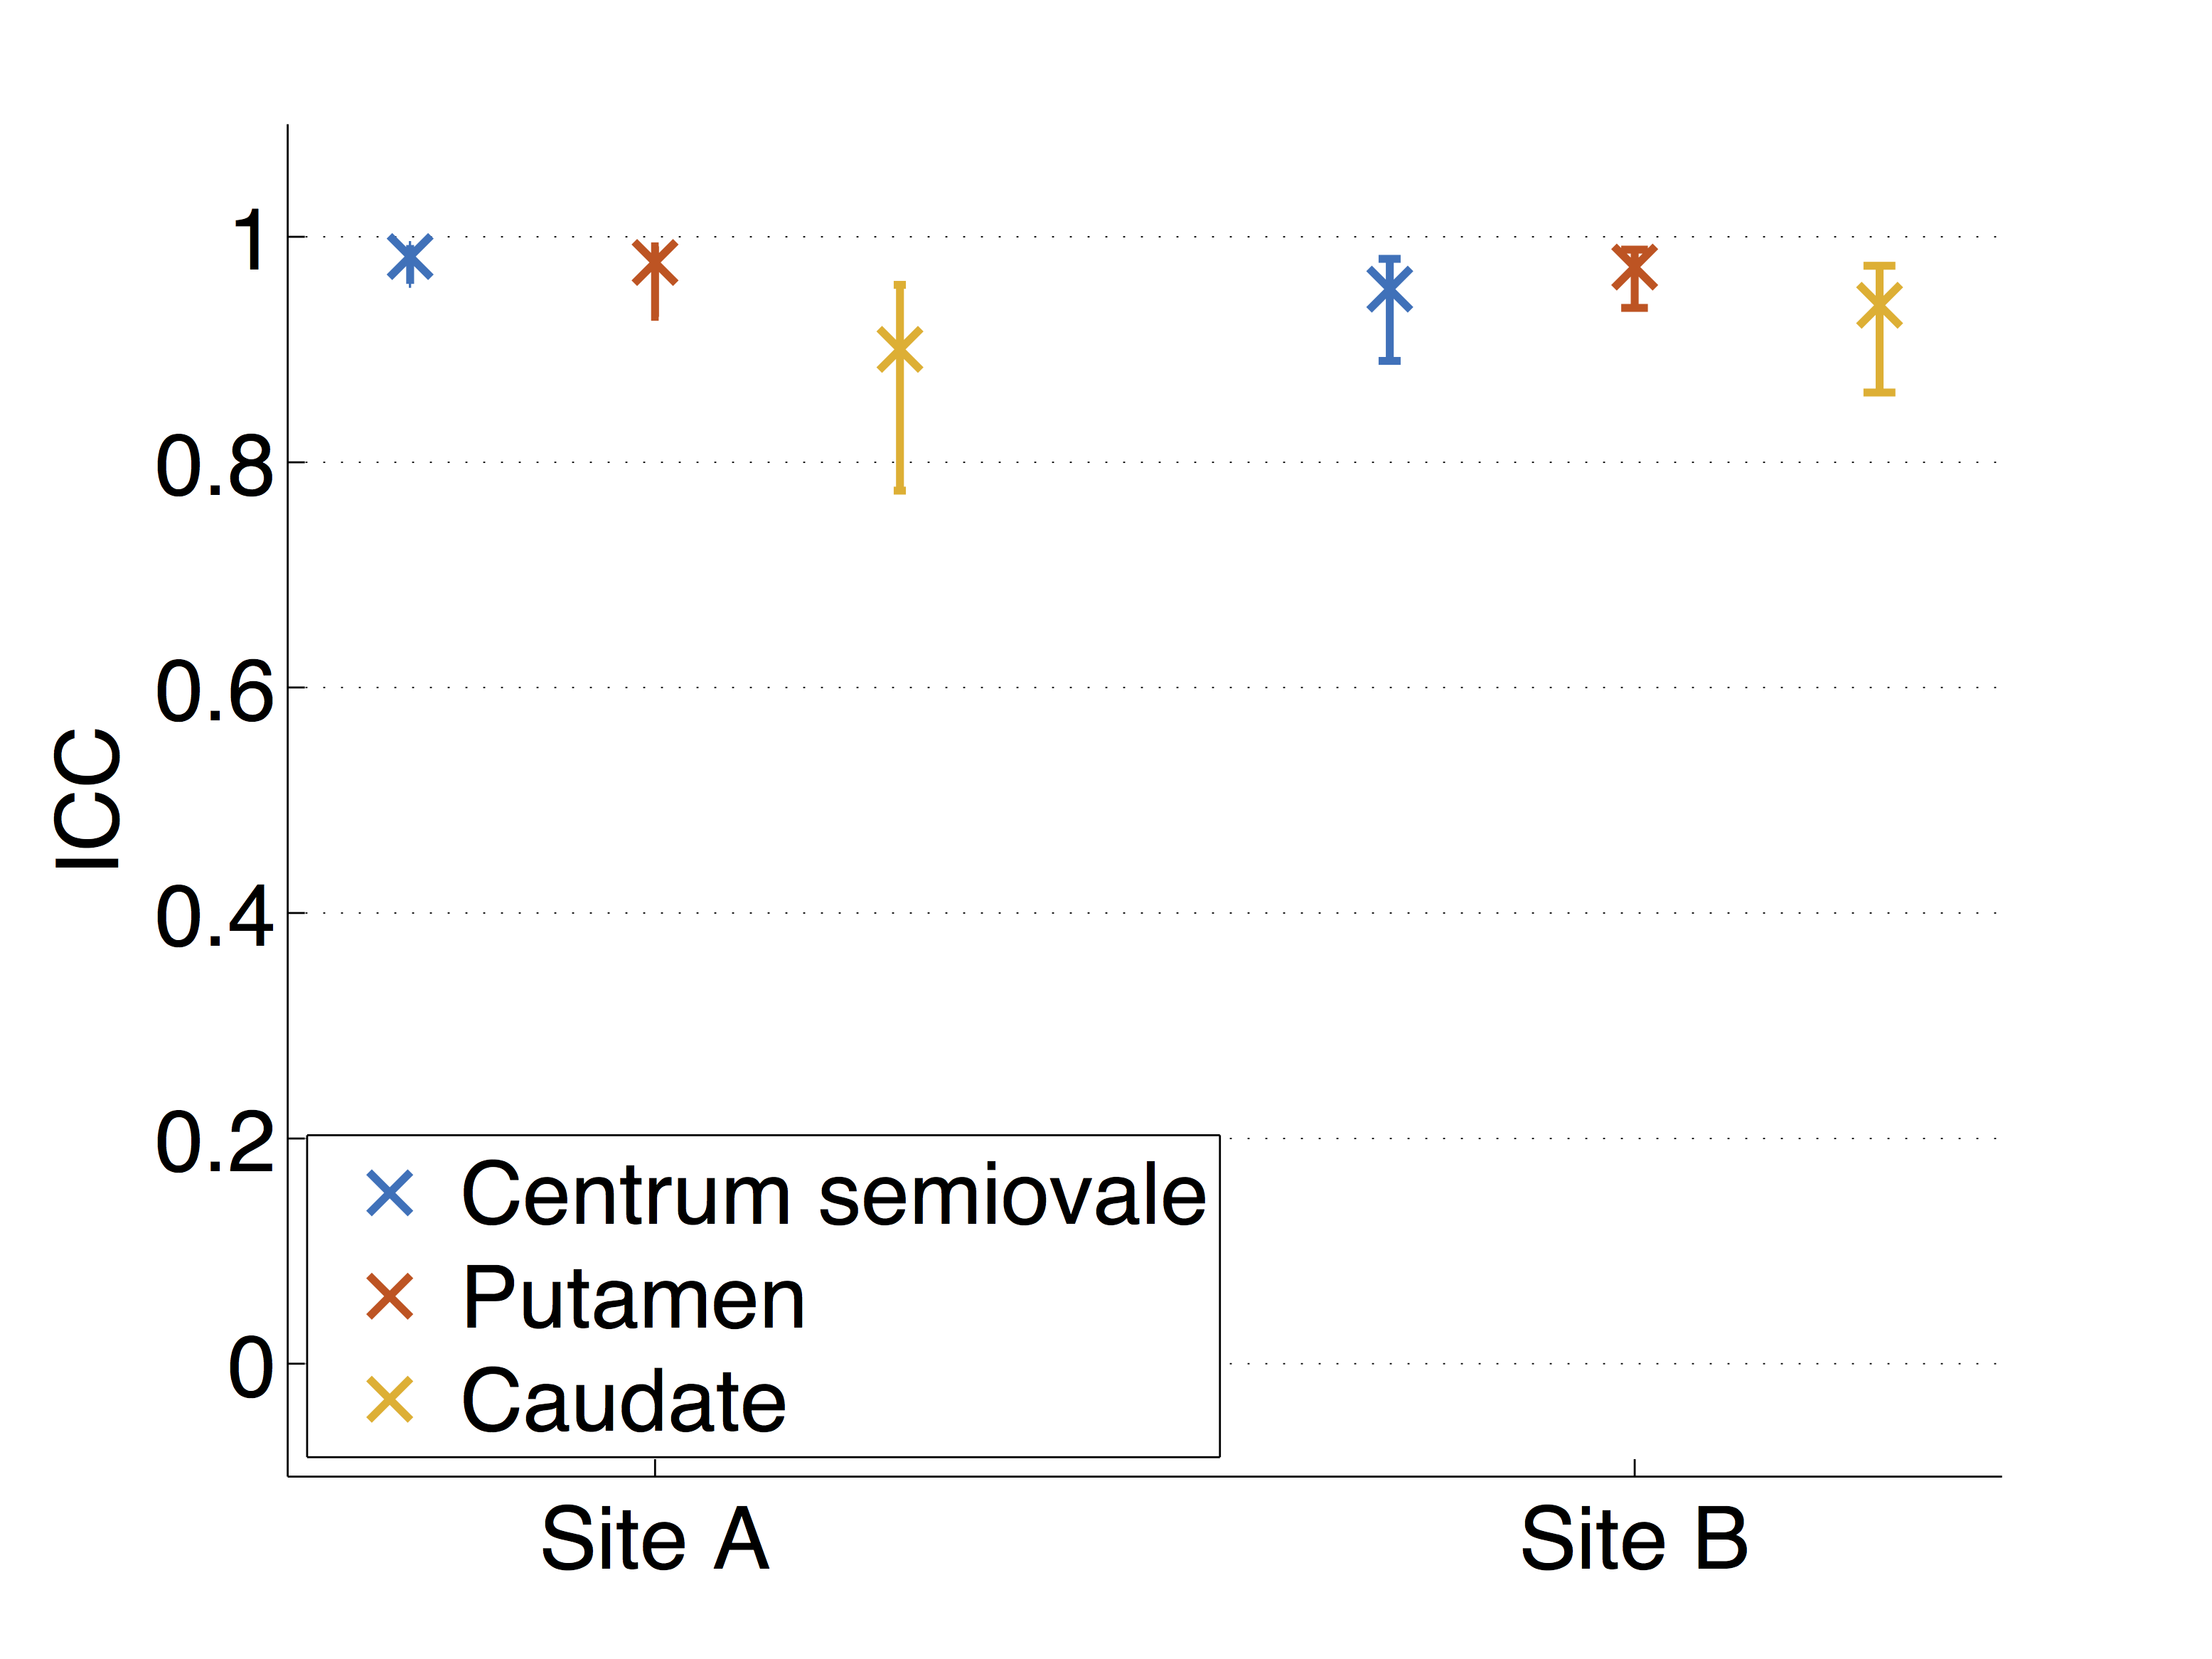
The repeatability and reproducibility of TSC in manually-defined ROIs are shown in Figures 3a and b, respectively, for one observer. As with the segmentation analysis, repeatability was better at site A than B, with repeatability coefficients of 2.8 and 4.7 mM, respectively (Figure 3a). The reproducibility analysis provides evidence of poorer reproducibility for higher TSC (Figure 3b). These trends were also seen in the second observers’ analysis; intraclass correlation coefficients (ICCs) calculated separately for each ROI in the first scan at each site generally indicated good inter-observer agreement (Figure 4), with ICC point estimates > 0.85 in all cases.
TSC trends in WM/GM are consistent with previous studies8,9, although GM values were slightly lower than some of the previous literature (e.g. 26.7±3.4 mM vs. 36.3±1.7 mM from Thulborn et al.10). CSF and caudate nucleus values provide evidence of poorer reproducibility of higher TSC, which may be relevant for tumors where TSC is known to be elevated11.
Conclusion
Comparable 23Na imaging protocols have been successfully implemented on different scanners, with TSC showing consistent results across repeated scans at different sites. TSC exhibited very good repeatability and reproducibility. Manual ROI repeatability suggests differences of at least 5 mM are detectable. These results have important implications for the use of 23Na-MRI as a robust tool for biological and clinical assessment of brain tumors.Acknowledgements
DJM and FR contributed equally to this work. This work was supported by CRUK [C8742/A18097]. This is a contribution from the Cancer Imaging Centre in Cambridge & Manchester, which is funded by the EPSRC and Cancer Research UK. This work was supported by a research agreement between Philips Healthcare and The University of Manchester. The authors acknowledge the contributions of Christian Stehning from Philips Research, Hamburg, Germany, Dave Higgins from Philips Healthcare, UK, and Rolf Schulte from GE Global Research, Munich, Germany.References
1Jacobs et al., Breast Cancer Res Treat. 2011;128:119-126. 2Schepkin et al., Magn Reson Med. 2005;53:85-92. 3O’Connor et al., Nat Rev Clin Oncol. 2017;14:169-186. 4Gurney et al., Magn Reson Med. 2006;55:575-582. 5Riemer et al., MAGMA. 2014;27:35-46. 6Fessler and Sutton, IEEE Trans Signal Process. 2003;51:560-574. 7Zwart et al., Magn Reson Med. 2012;67:701-710. 8Paling et al., Brain. 2013;136:2305-2317. 9Madelin et al., ISMRM. 2008; abstract 3444. 10Thulborn et al., NMR Biomed. 2015;29:137-143. 11Ouwerkerk et al., Radiology. 2003;227:529-537.Figures