0443
Structural Determination Using 129Xe NMR Line-shape in Chemical Shift ImagingStephen Kadlecek1, Mehrdad Pourfathi1, Luis Loza1, Ian Duncan1, Kai Ruppert1, Hooman Hamedani1, Sarmad Siddiqui1, Yi Xin1, Faraz Amzajerdian1, Harrilla Profka1, Ryan Baron1, Mary Spencer1, Tahmina Achekzai1, Shampa Chatterjee2, Maurizio Cereda3, and Rahim R. Rizi1
1Radiology, University of Pennsylvania, Philadelphia, PA, United States, 2Physiology, University of Pennsylvania, Philadelphia, PA, United States, 3Anesthesiology and Critical Care, University of Pennsylvania, Philadelphia, PA, United States
Synopsis
We present a method to discriminate dissolved 129Xe spectra by tissue type and location based on local variations in T2*. Mixed contributions of parenchyma and vasculature can be separated almost completely. The method is particularly useful to high field imaging in species lacking distinct dissolved phase spectral components.
Introduction
Similar to those made using 3He, hyperpolarized 129Xe lung images contain information about ventilation, lung microstructure and oxygen uptake. However, 129Xe images can also be acquired such that an additional dissolved phase component is highlighted that is spectrally separated from that of the gas phase. In some species, the spectrum may be further subdivided into tissue/plasma and red blood cell components, although it may be advantageous to subdivide based on tissue type (e.g., healthy lung parenchyma vs vasculature) instead. Here, we present a method for performing this division efficiently based on local T2*. The method is particularly appropriate to high field imaging in species lacking distinct dissolved phase spectral components.Materials and Methods
Five C57BL/6 mice were used in this study. In one, a series of UTE images with varying echo times was used to determine T2*. In the other four, a custom CSI acquisition was used to measure the complete dissolved phase line-shape at each voxel. All images were acquired on a Bruker Avance 9.4T spectrometer with an imaging gradient insert. During imaging, all animals free-breathed a normoxic mixture containing 30% 129Xe. 500mL of 129Xe was polarized to 40-50% via optical pumping (Xemed XeBox) and was dispensed at 40 ml/min through a tube attached to the mouse bite bar while mixing with 100 ml/min of 70%/30% N2/O2 + 1-4% isoflurane. Gas flow continued until the supply was exhausted (12-13 minutes). Isoflurane concentration was lowered during Xe dispensation in an effort to maintain ~90 BPM. UTE images were acquired with five different echo times ranging from 98ms to 1.5ms, a=20o, TR=100ms, 200 kHz acquisition bandwidth, FOV=35x25mm, 202 spokes acquired and re-gridded to a 64x64 matrix. CSI images were acquired with a=30o, FOV=20x35mm, TR=80ms, BW=50kHz, AT=70ms. 6400 FIDs were acquired on a 64x36 phase-encode grid (1792 acquisitions were used to reacquire points near k=0, and the order of PE points was randomized to minimize the effect of breath and cardiac motion). The resulting voxel-selective spectra were fit to a bi-Lorentzian line-shape in which two components were constrained to be 60±10 Hz and 350±70 Hz FWHM. Both acquisition types utilized spectrally selective pulses centered on the dissolved phase such that the gas phase excitation was suppressed by a factor of approximately 50.Results and Discussion
Figure 1 shows the five UTE images: T2* is considerably longer in the heart and in regions of the lung dominated by major vasculature (for TE=1.5ms, e.g., signal is essentially absent in the parenchyma, but persists in the heart). Parenchymal T2* is typically consistent with values < 1ms, as compared to >2ms in the left ventricle, although the signal decay was clearly non-exponential with TE, preventing us from assigning a single value to each voxel. For this reason, we sought the more detailed spectral line-shape determination possible with a CSI image. Figure 2, middle shows such an image, analyzed by integrating each voxel’s spectrum over a 4kHz region containing the entire dissolved phase line-shape. This image was chosen to exemplify the fitting procedure because an injury (as seen in the proton images, Figure 2, left) greatly reduced the ventilation in the left lung. Simple spectral integration does not highlight this feature in the dissolved phase images, but separately plotting the areas under the two Lorentzian components (Figure 2, right) cleanly separates heart and vasculature (narrow, long T2* component, top right) and lung parenchyma (broad, short T2* component, bottom right). Three exemplary spectra are included, showing CSI spectra and fits from voxels in the aortic arch (long T2*, ‘A’), lung parenchyma only (short T2*, ‘B’), and a voxel with both parenchymal and vascular contribution (mixed line-shape, ‘C’). The latter voxel highlights the non-exponential behavior seen in the series of UTE images, allowing independent determination of the two compartments’ T2* despite the spatial overlap. Typical T2* values derived from the spectral linewidths were 0.45±0.05ms (parenchyma) and 2.5±0.4ms (heart and vasculature). The parenchymal T2* was significantly below that reported in ref. [1], which likely represented a mixture of tissue type contributions.Conclusions
We report a method to discriminate dissolved 129Xe spectra by tissue type and location based on local variations in T2*. Mixed contributions of parenchyma and vasculature can be separated almost completely. Voxels appear to be well characterized by a mixture of components, rather than a single intermediate T2*. Although similar information could be derived from an extensive series of images with varying TE, CSI allows straightforward analysis of a single image to achieve the desired result.Acknowledgements
No acknowledgement found.References
[1] Wakayama T, et al., Hyperpolarized 129Xe Phase-selective Imaging of Mouse Lung at 9.4T Using a Continuous-flow Hyperpolarizing System. Magn Reson Med Sci 7(2): 65-72 (2008).Figures
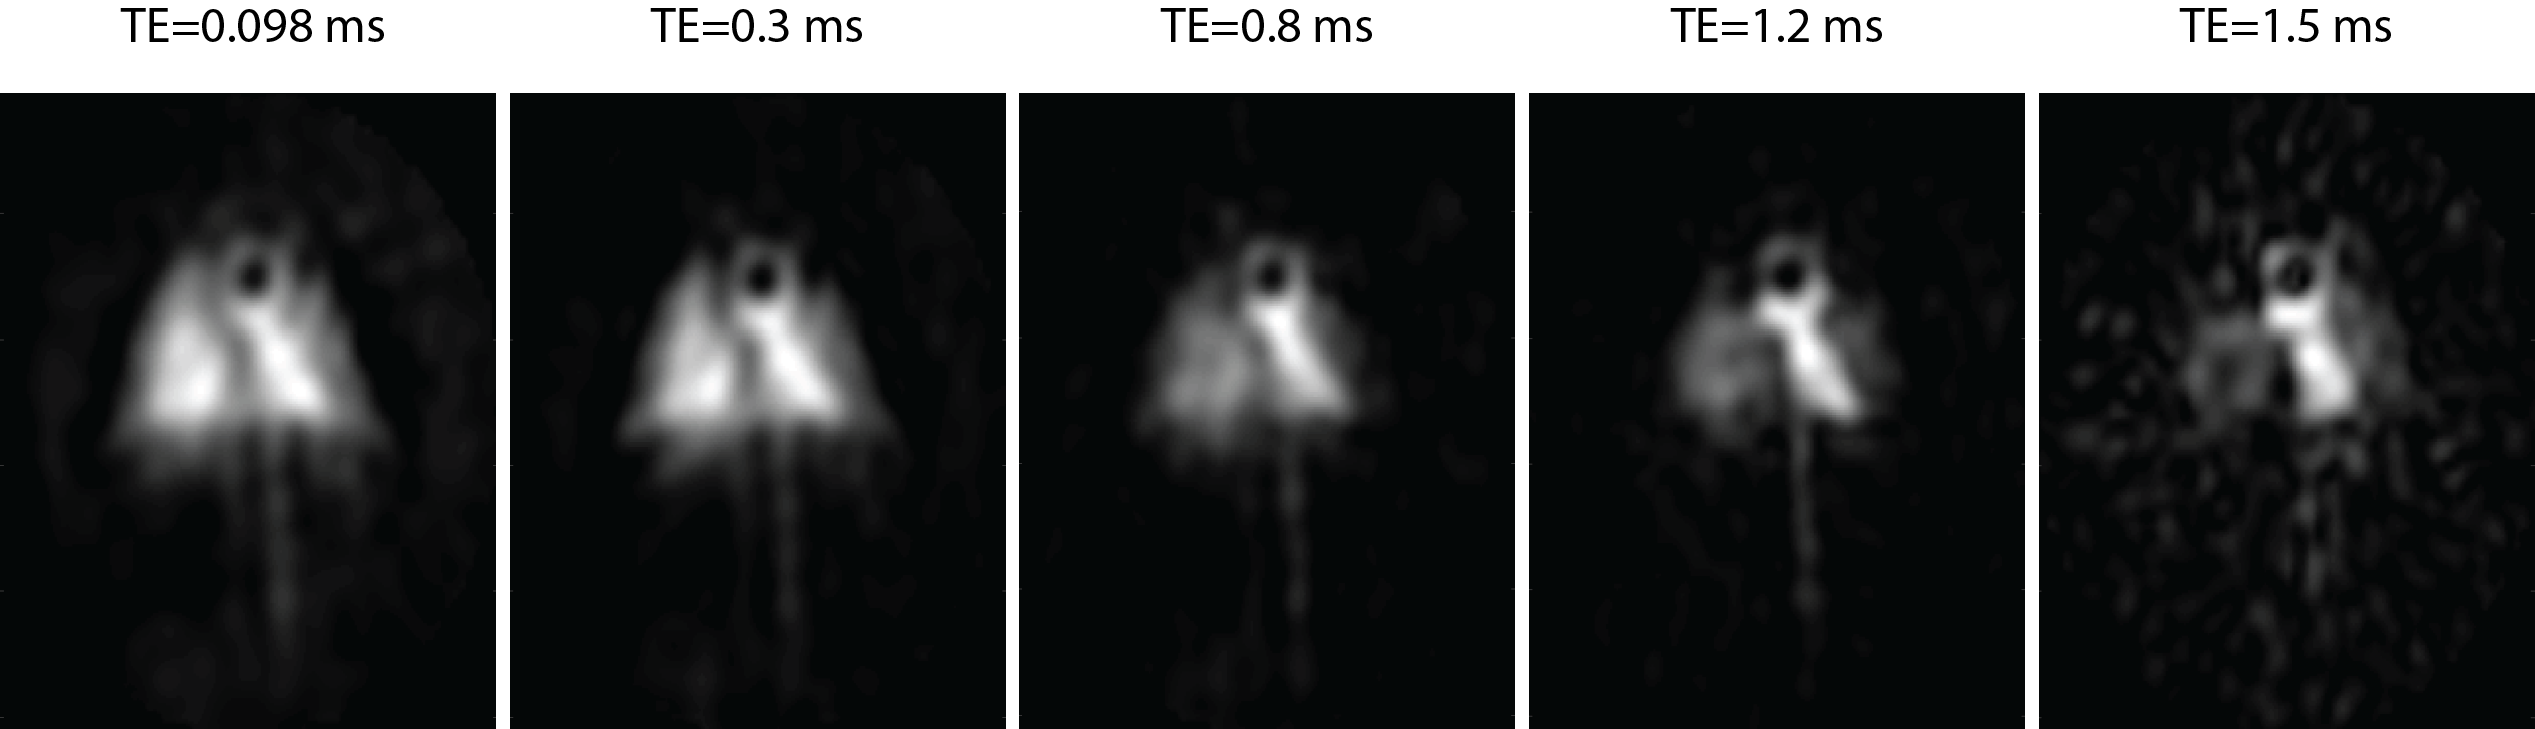
Figure 1. A series of UTE images with varying TE show the greatly reduced T2* in
the lung parenchyma.
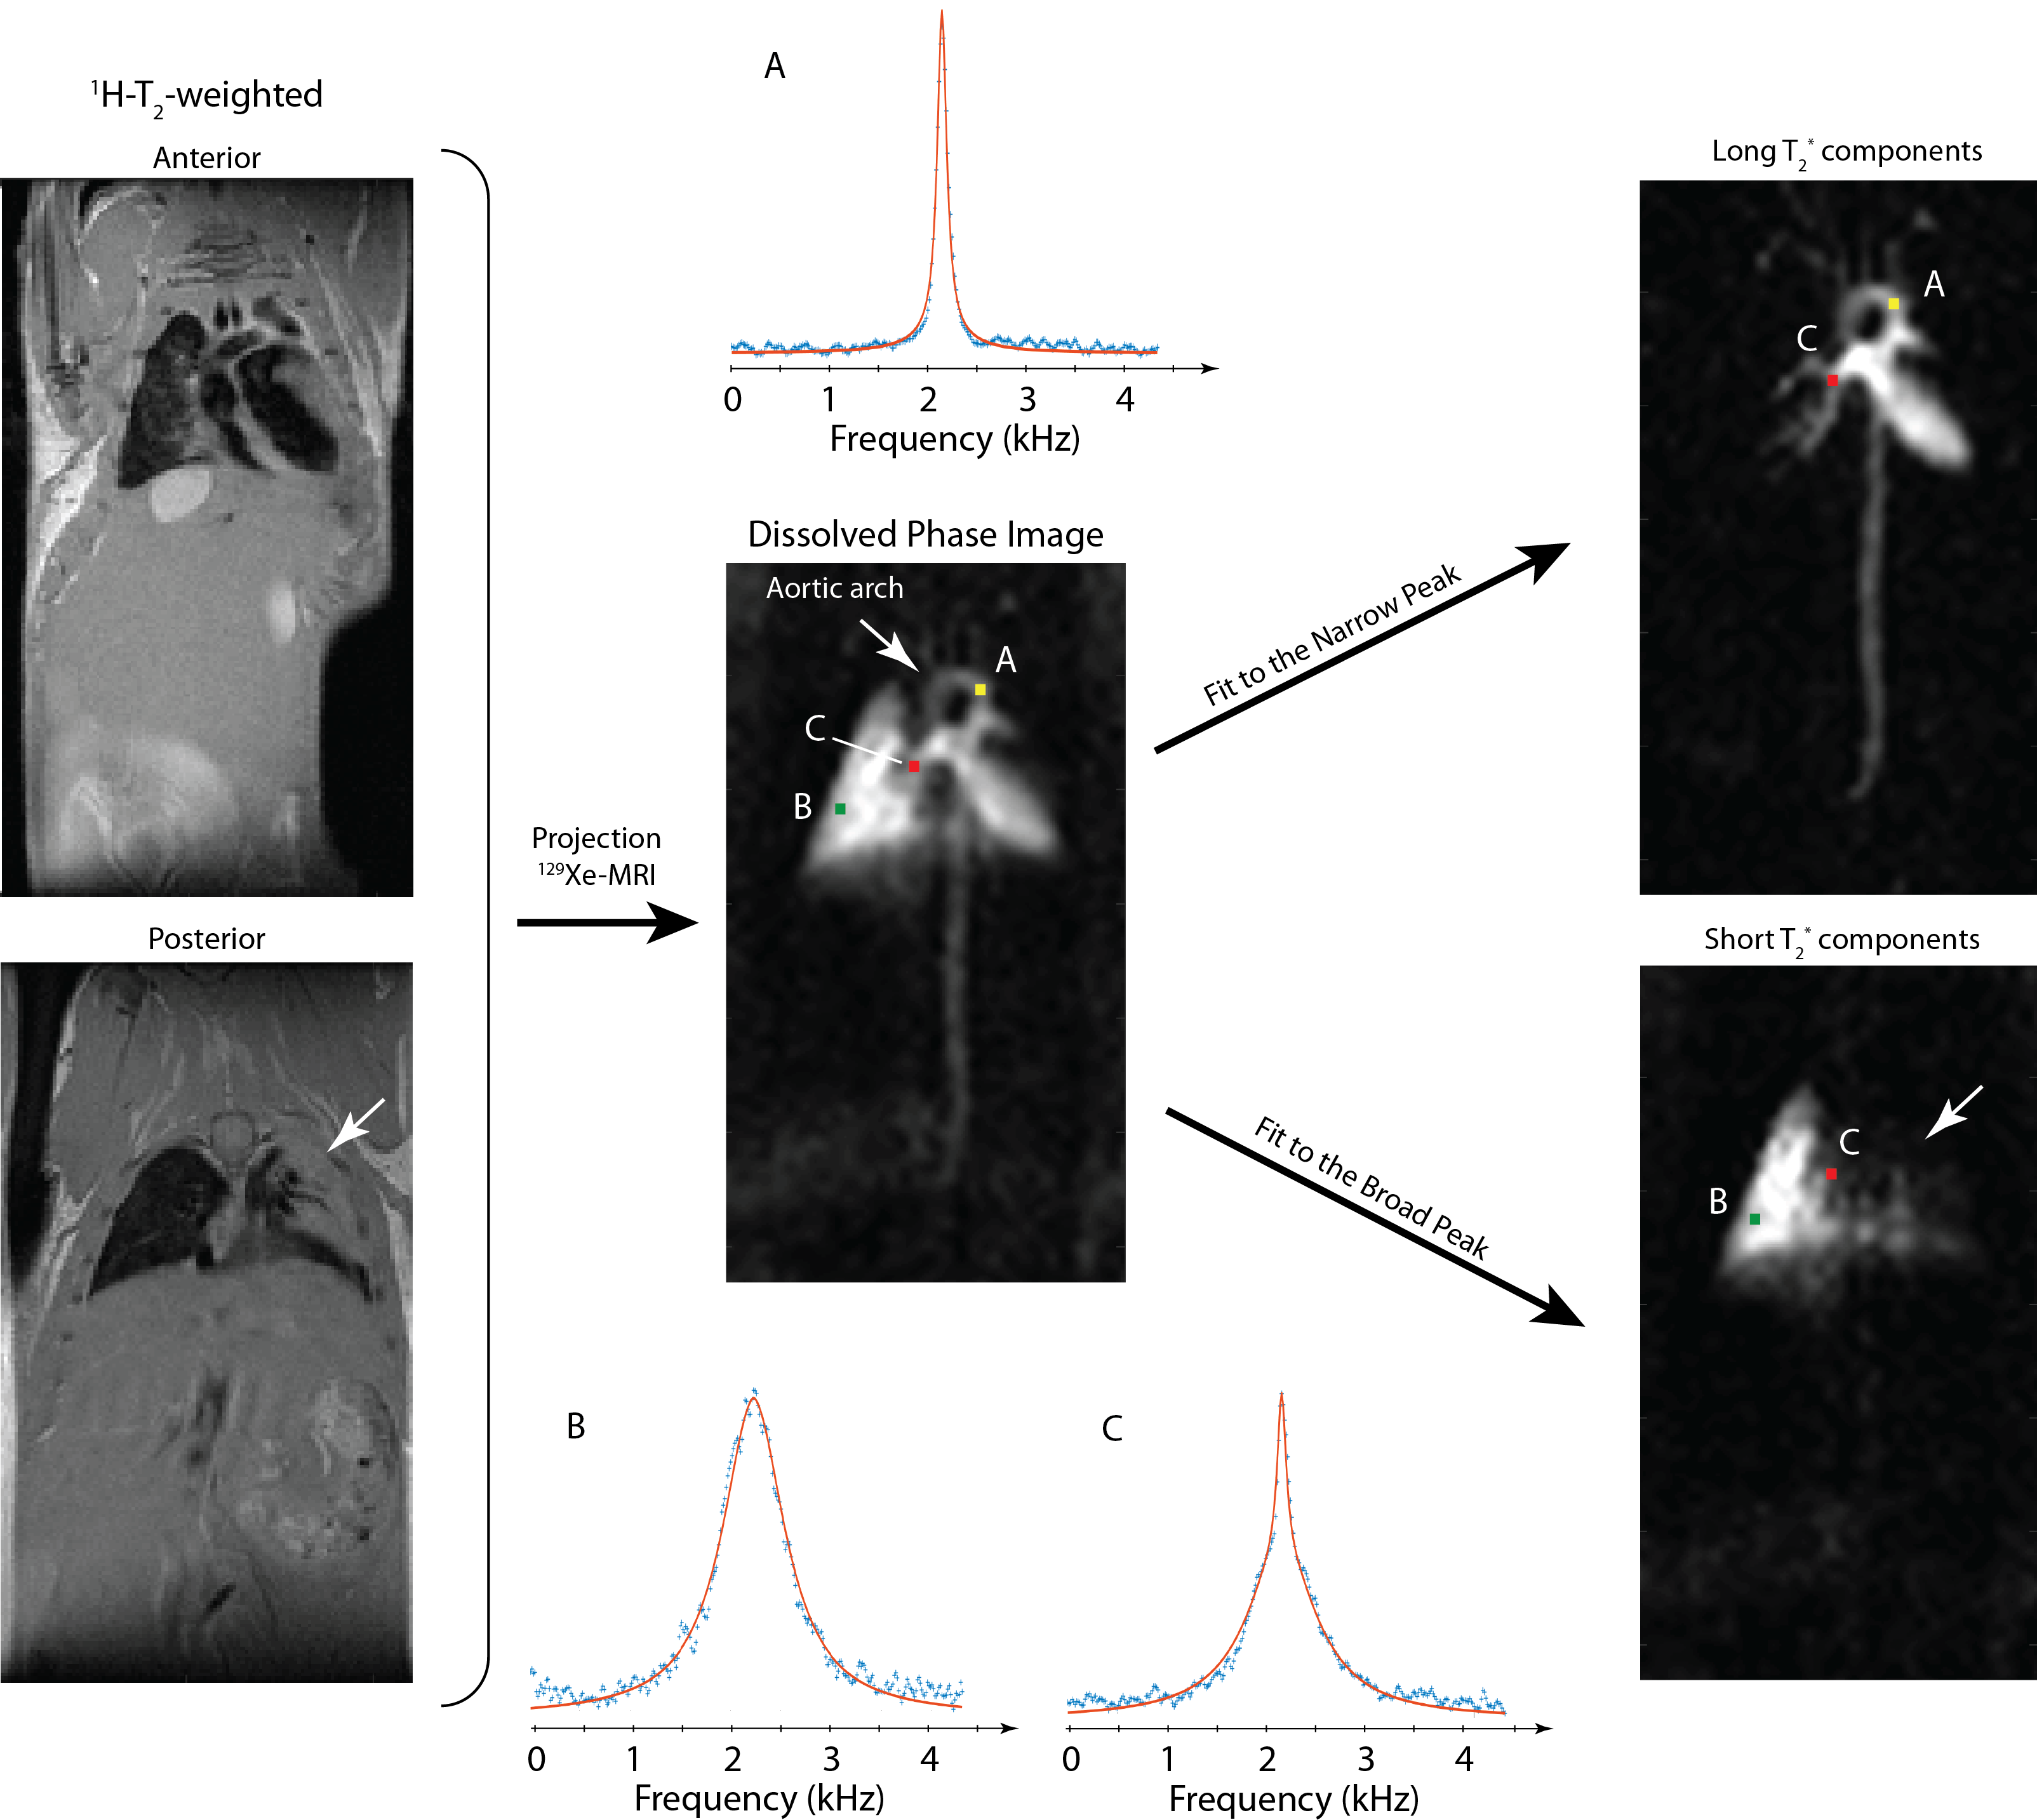
Figure 2. CSI Line-shape fitting procedure allows clean discrimination of tissue
type based on local T2*. Simple integration of the dissolved phase peak (center)
does not allow a clear visualization of ventilation defects (white arrow), but
narrow (right top) and broad (right bottom) line-shape components can be used
to highlight the two tissue types separately. Exemplary fits (center) demonstrate
this procedure.