0440
Artificial neural networks for stiffness estimation in magnetic resonance elastography1Mayo Clinic, ROCHESTER, MN, United States
Synopsis
Artificial neural networks (ANNs) were trained using simulated displacement fields to perform stiffness estimation from MRE data. These neural network-based inversions (NNIs) are evaluated in simulation and in vivo. In a test set of simulated data, NNI is shown to provide a more accurate estimate of stiffness compared to a standard direct inversion (DI) approach. In vivo, NNI-based stiffness strongly correlated with DI-based stiffness across a range of fibrosis stages in the liver and ages in the brain, indicating that NNI can detect relevant biology. Finally, test-retest error in the brain is reduced using NNI compared to DI.
Introduction
Magnetic resonance elastography (MRE) is an MR-based technique for noninvasively measuring tissue stiffness, akin to palpation.1 MRE consists of three steps: introduction of shear waves into the tissue of interest by external mechanical vibration, imaging of the resulting displacement field by a phase-contrast MR pulse sequence, and mathematical inversion of the displacement field to compute stiffness. While MRE is growing in clinical impact, particularly in the liver,2-5 motivation remains to improve the resolution and robustness of the technique thus enabling new applications throughout the body. Toward this goal, this work investigates the use of artificial neural networks (ANNs) to estimate stiffness from displacement measurements, and compares the results to standard direct inversion approaches.Methods
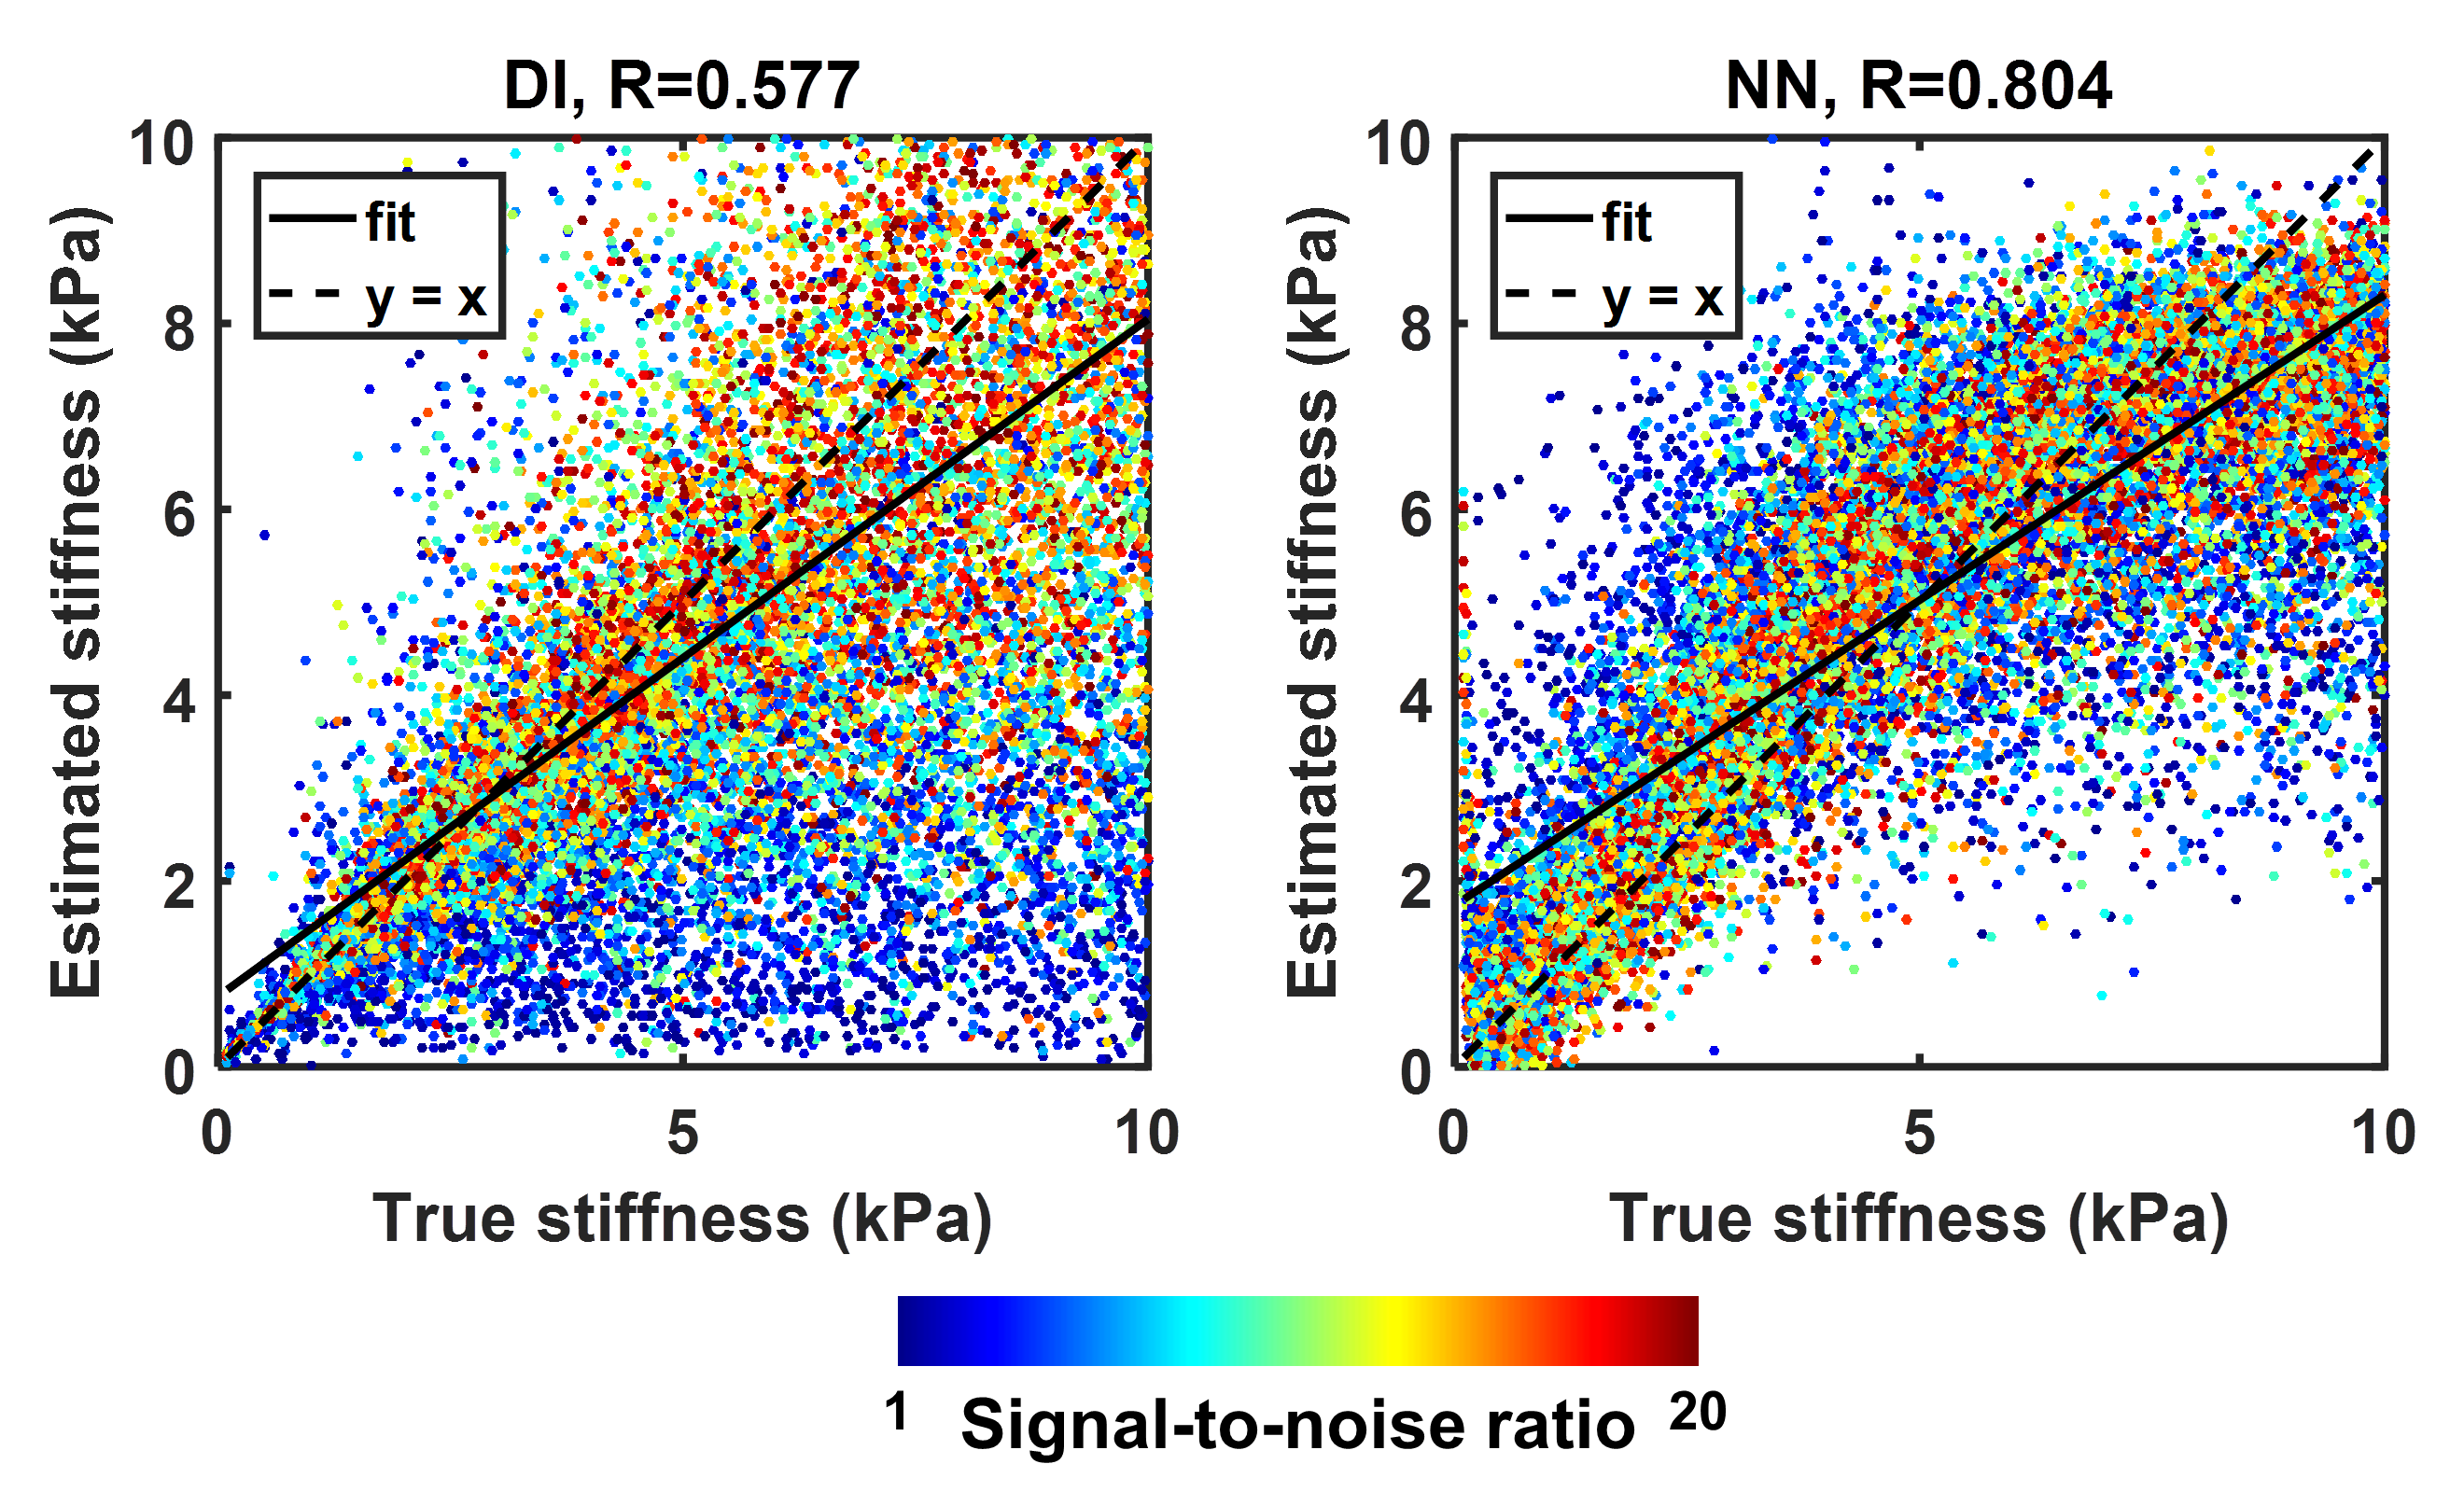
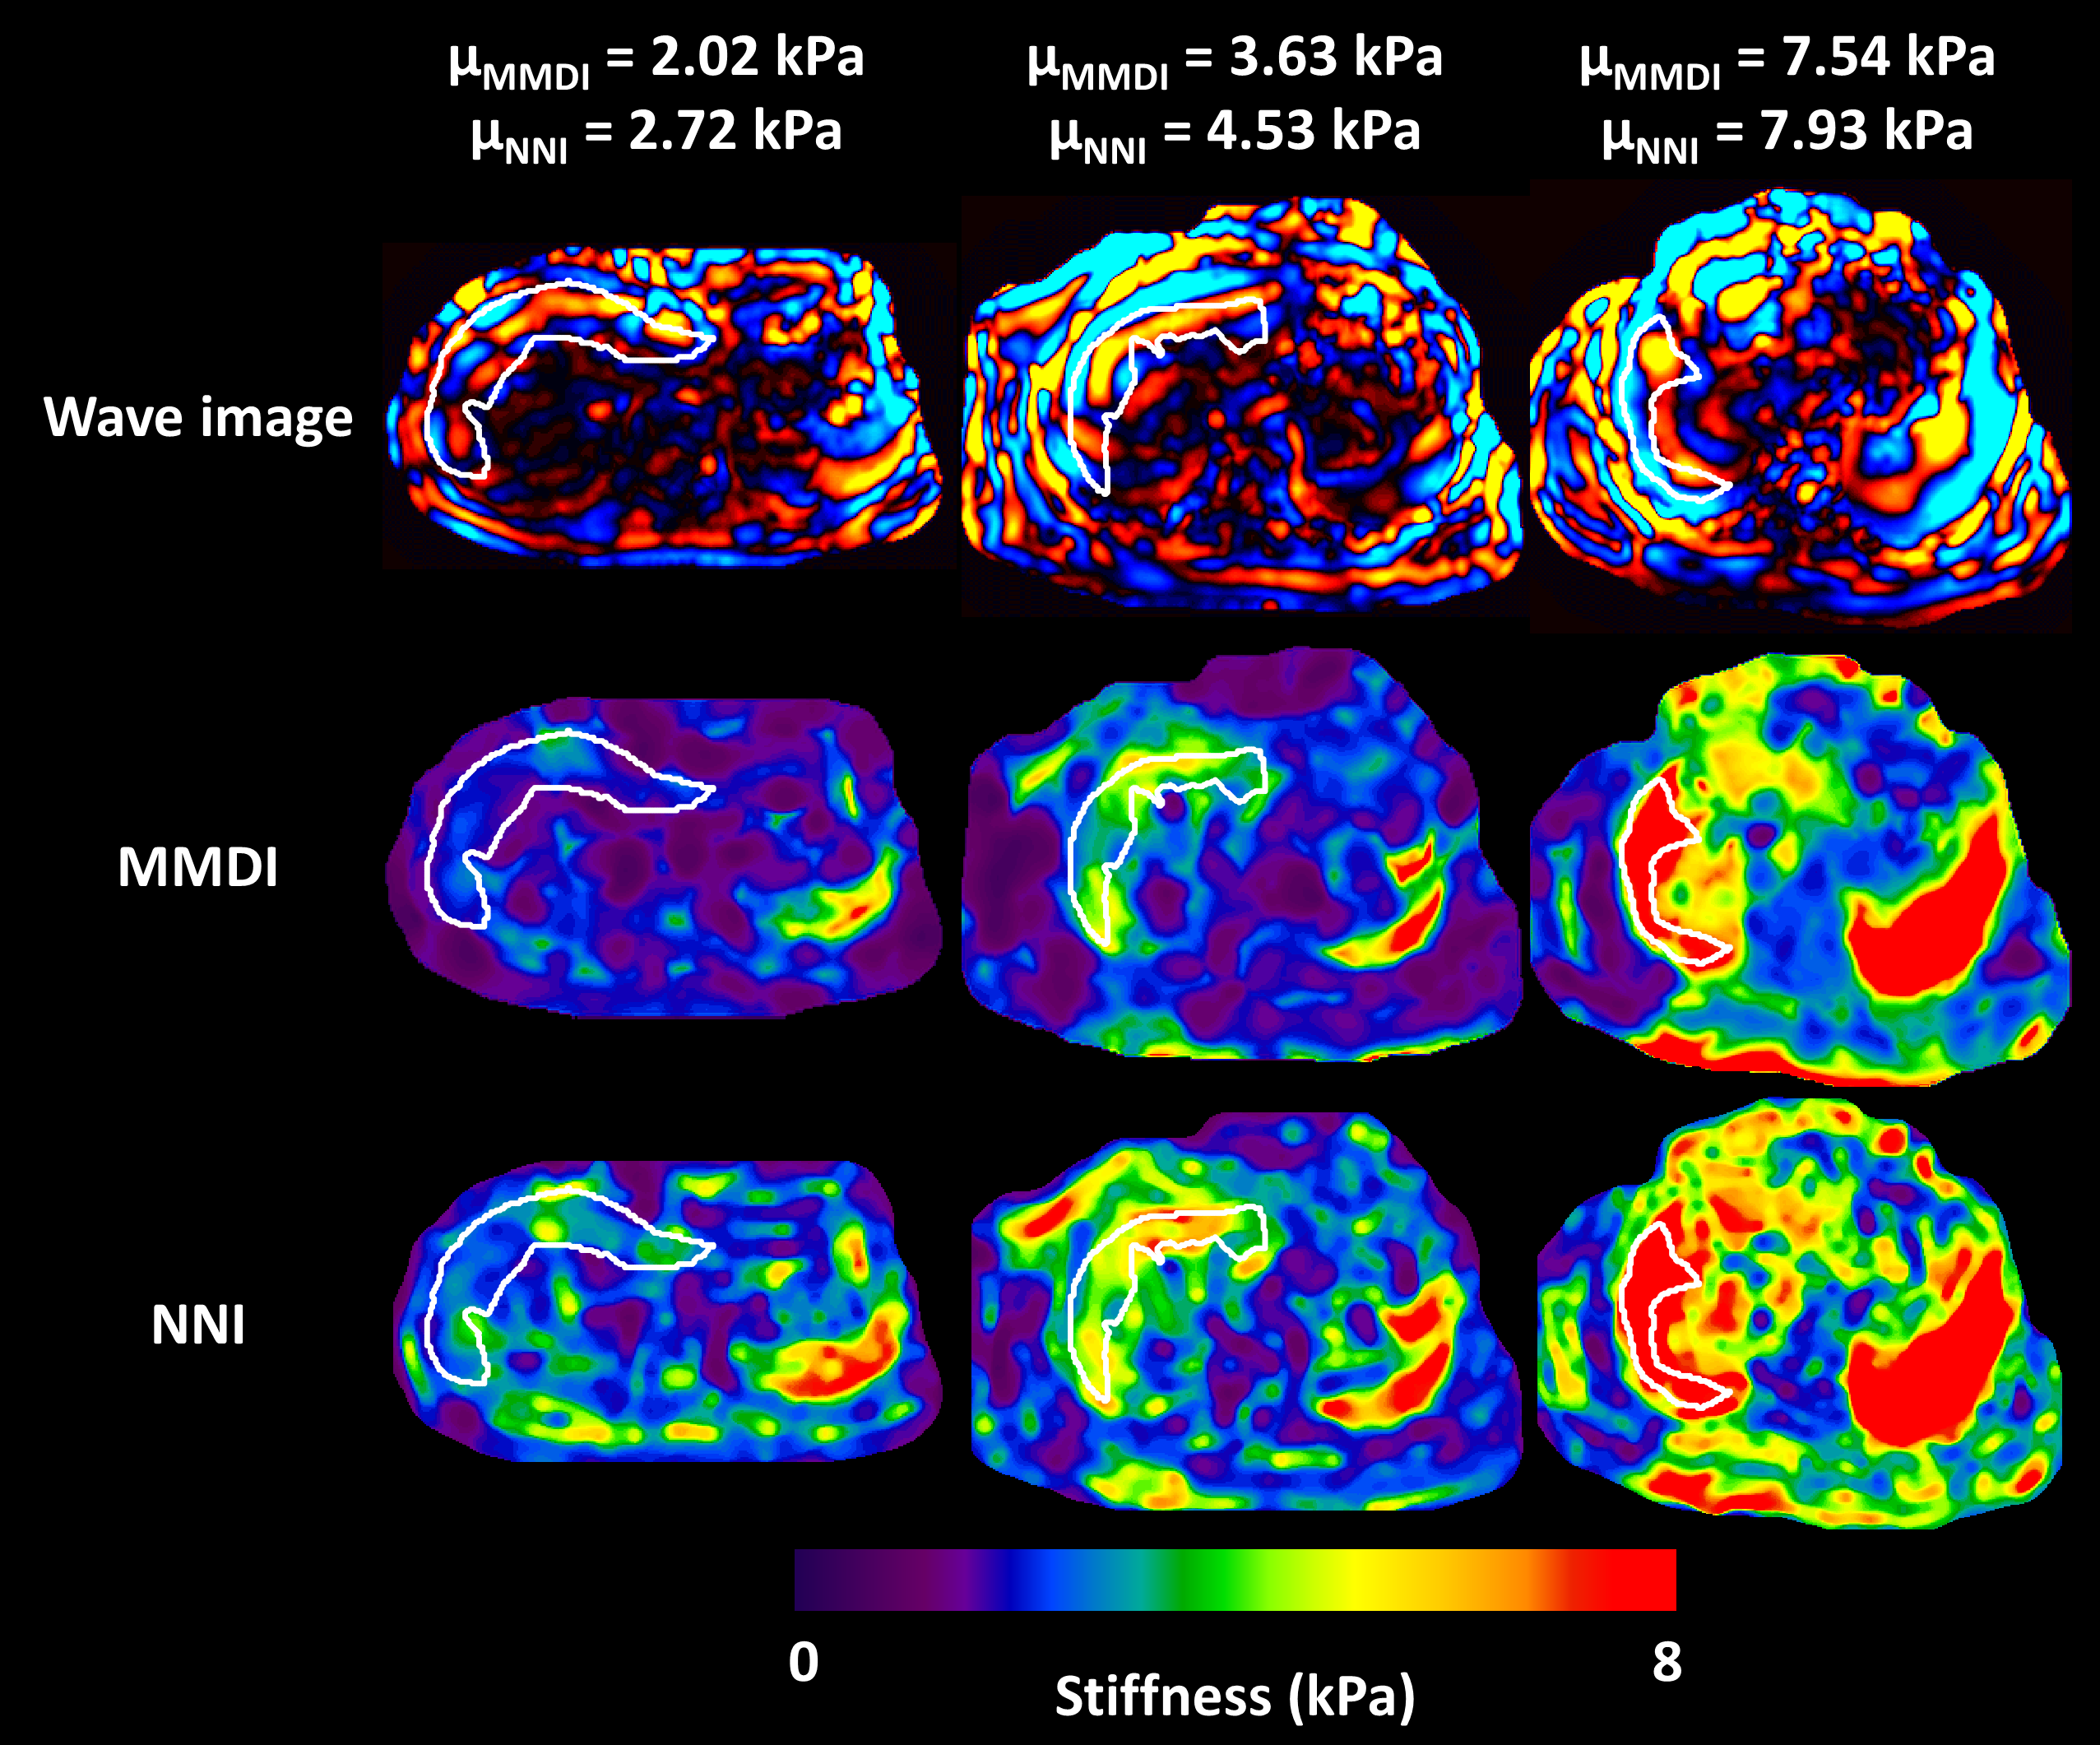
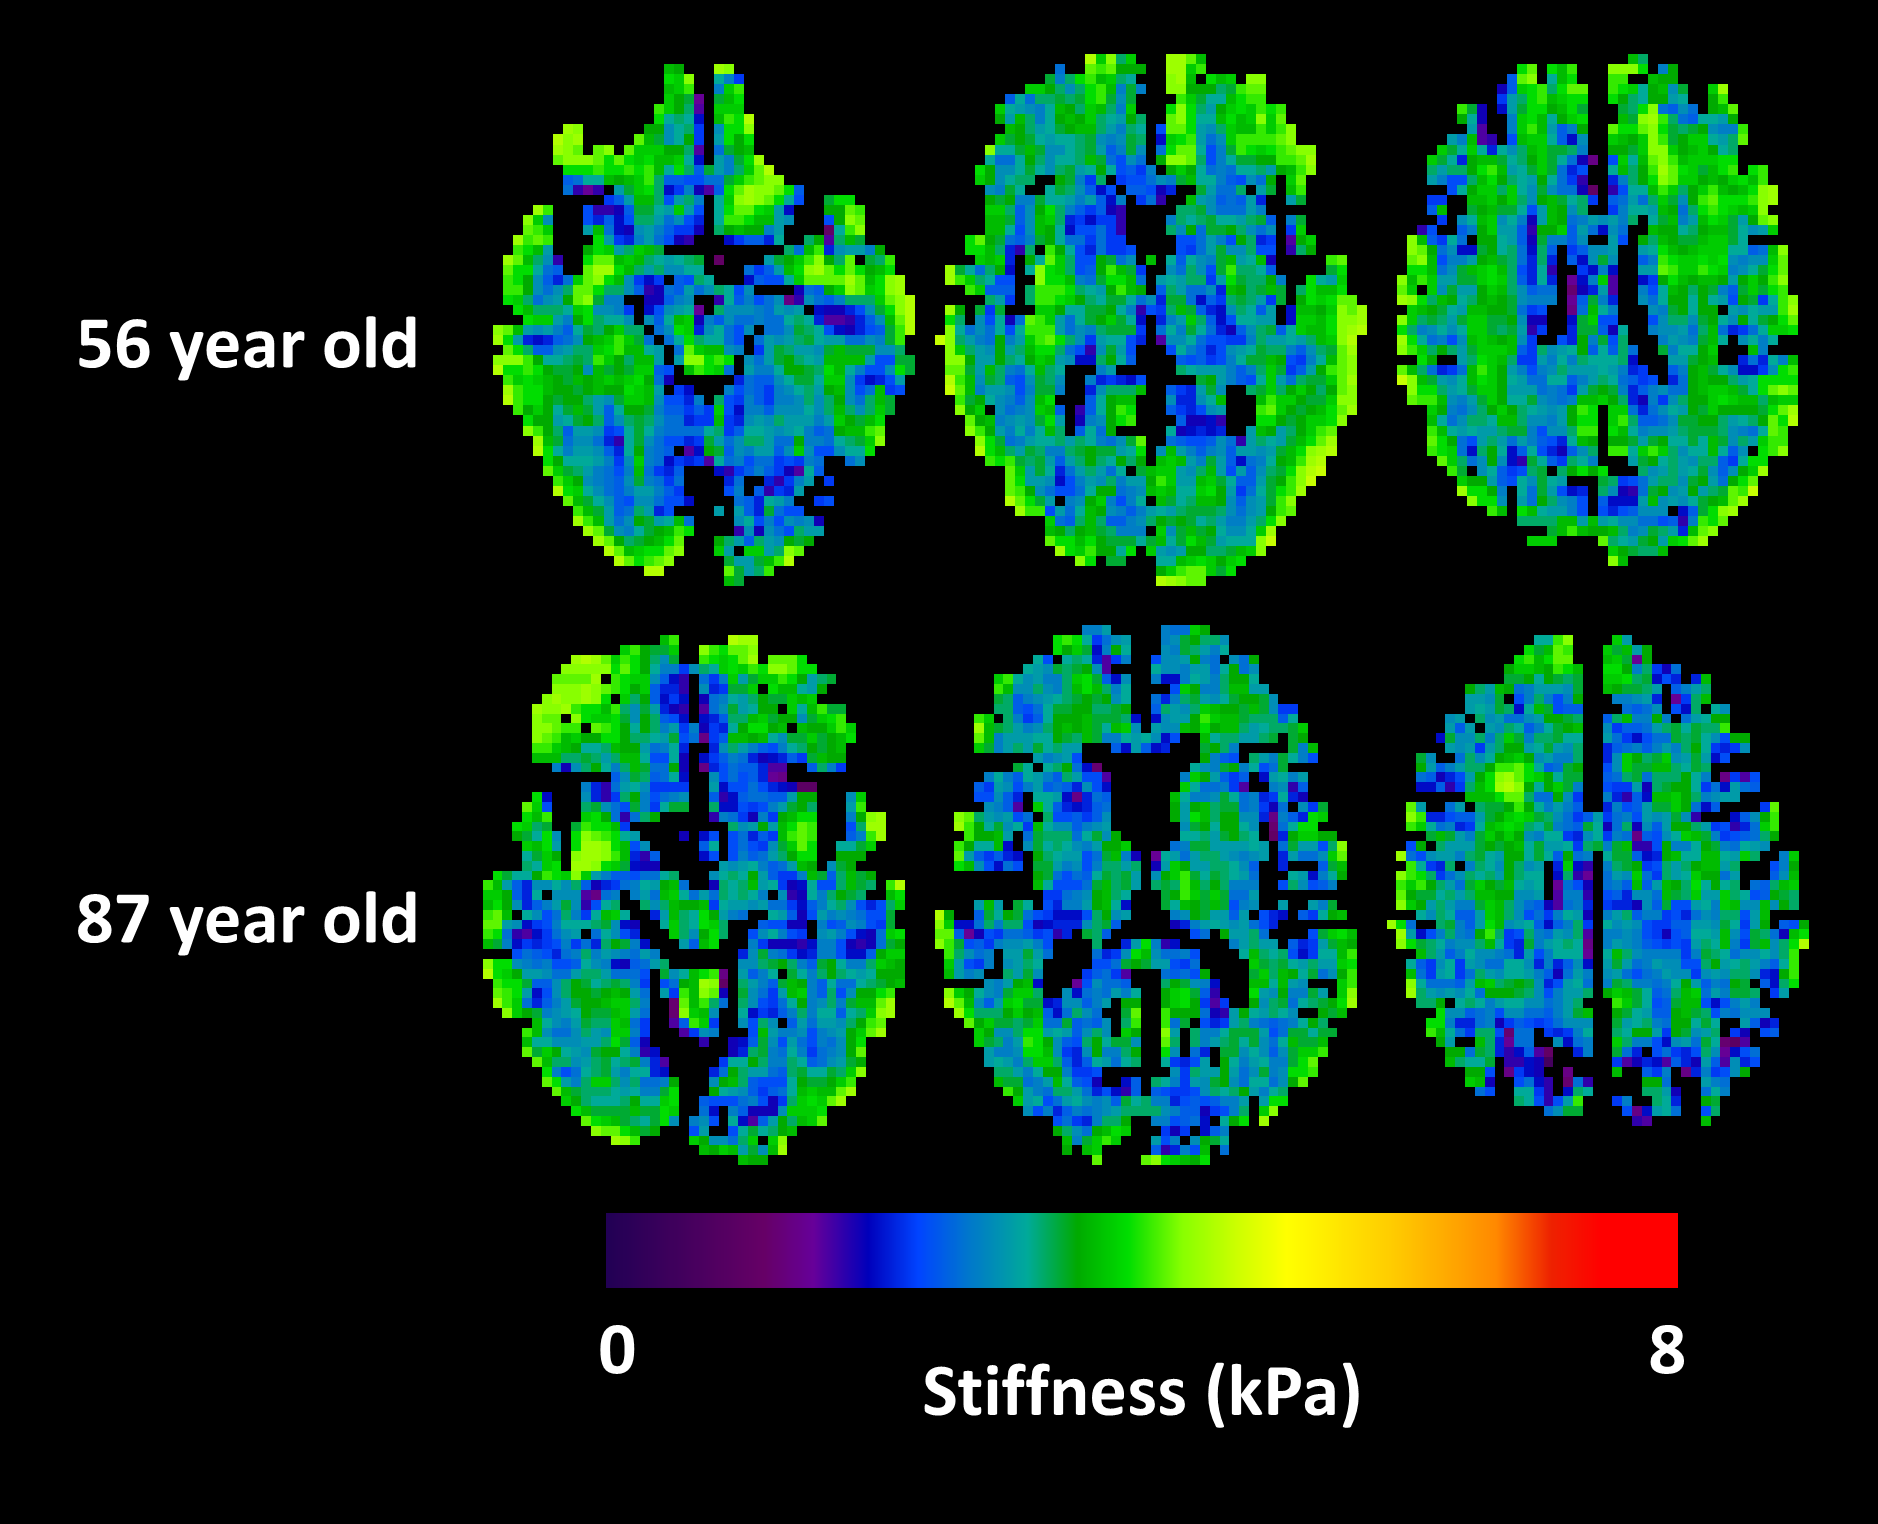
The performance of neural network inversion (NNI) was first examined in simulation. ANNs were trained on simulated patches of displacement data with size of approximately 1 cm in each dimension, using 100,000 examples for training, 20,000 examples for validation, and 20,000 examples for testing. These 3D simulated displacement fields had 2-mm isotropic resolution with a random number of wave point sources (up to 10 placed randomly outside the patch), stiffness chosen randomly between 0.1 and 10 kPa, and SNR chosen randomly between 1 and 20 (added zero-mean Gaussian noise). All ANNs used here had 24 nodes in each of 3 hidden layers with a hyperbolic tangent transfer function. Training was performed by scaled conjugate gradient backpropagation,6 and was stopped when 6 consecutive iterations failed to reduce mean squared error in the validation set. Features for the simulation study included the real and imaginary parts of the temporal first harmonic of the displacement data in 81 voxels surrounding the voxel of interest. This patch size was chosen to match the footprint of algebraic direct inversion (DI),7 which used a 3x3x3 smoothing kernel8 followed by computation of the Laplacian with 3 voxels in each dimension. NNI was also investigated in vivo, including liver and brain data. The liver NNI was trained on 1 million 2D simulated displacement fields with 1-mm isotropic resolution, stiffness between 0.1 and 10 kPa, SNR between 1 and 20, and features including the real and imaginary parts of the first harmonic in a 5x5 neighborhood. In vivo data were taken from a previous study.9 NNI stiffness maps were computed by evaluating the trained NNI at each voxel in the volume. For comparison, stiffness was also computed by MMDI, a variant of direct inversion commonly used for clinical liver MRE exams.10 From each subject, the mean stiffness was computed for both inversion methods in a region of interest (ROI) that was the intersection of an expert-drawn region and an MMDI-based confidence mask. The brain NNI was trained on 1 million 3D simulated displacement fields with 3-mm isotropic resolution, stiffness between 0.1 and 5 kPa, SNR between 1 and 20, and features including the real and imaginary parts of the first harmonic in a 3x3x3 neighborhood. In data from a previous study of aging,11 global stiffness was computed using both NNI and DI stiffness maps. In data from a repeatability study,12 regional stiffness was also computed by both methods, with regions including the lobes of the brain, deep gray and white matter, and cerebellum. Measurement error in each region was summarized as the coefficient of variation.Results
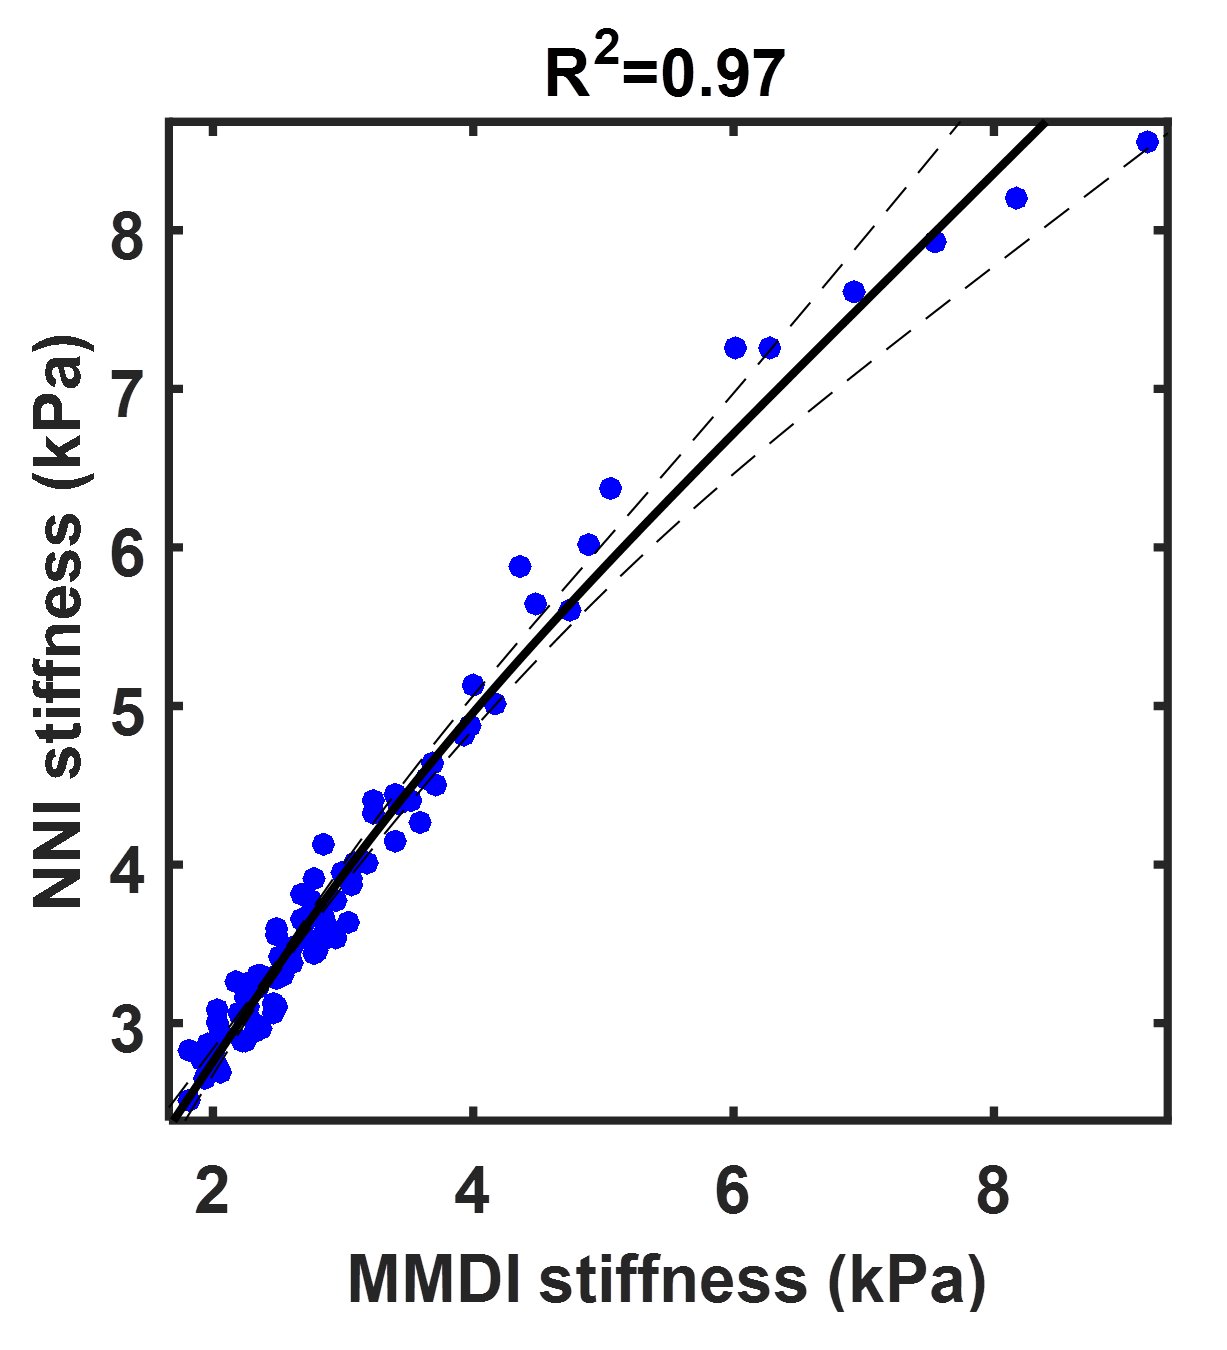
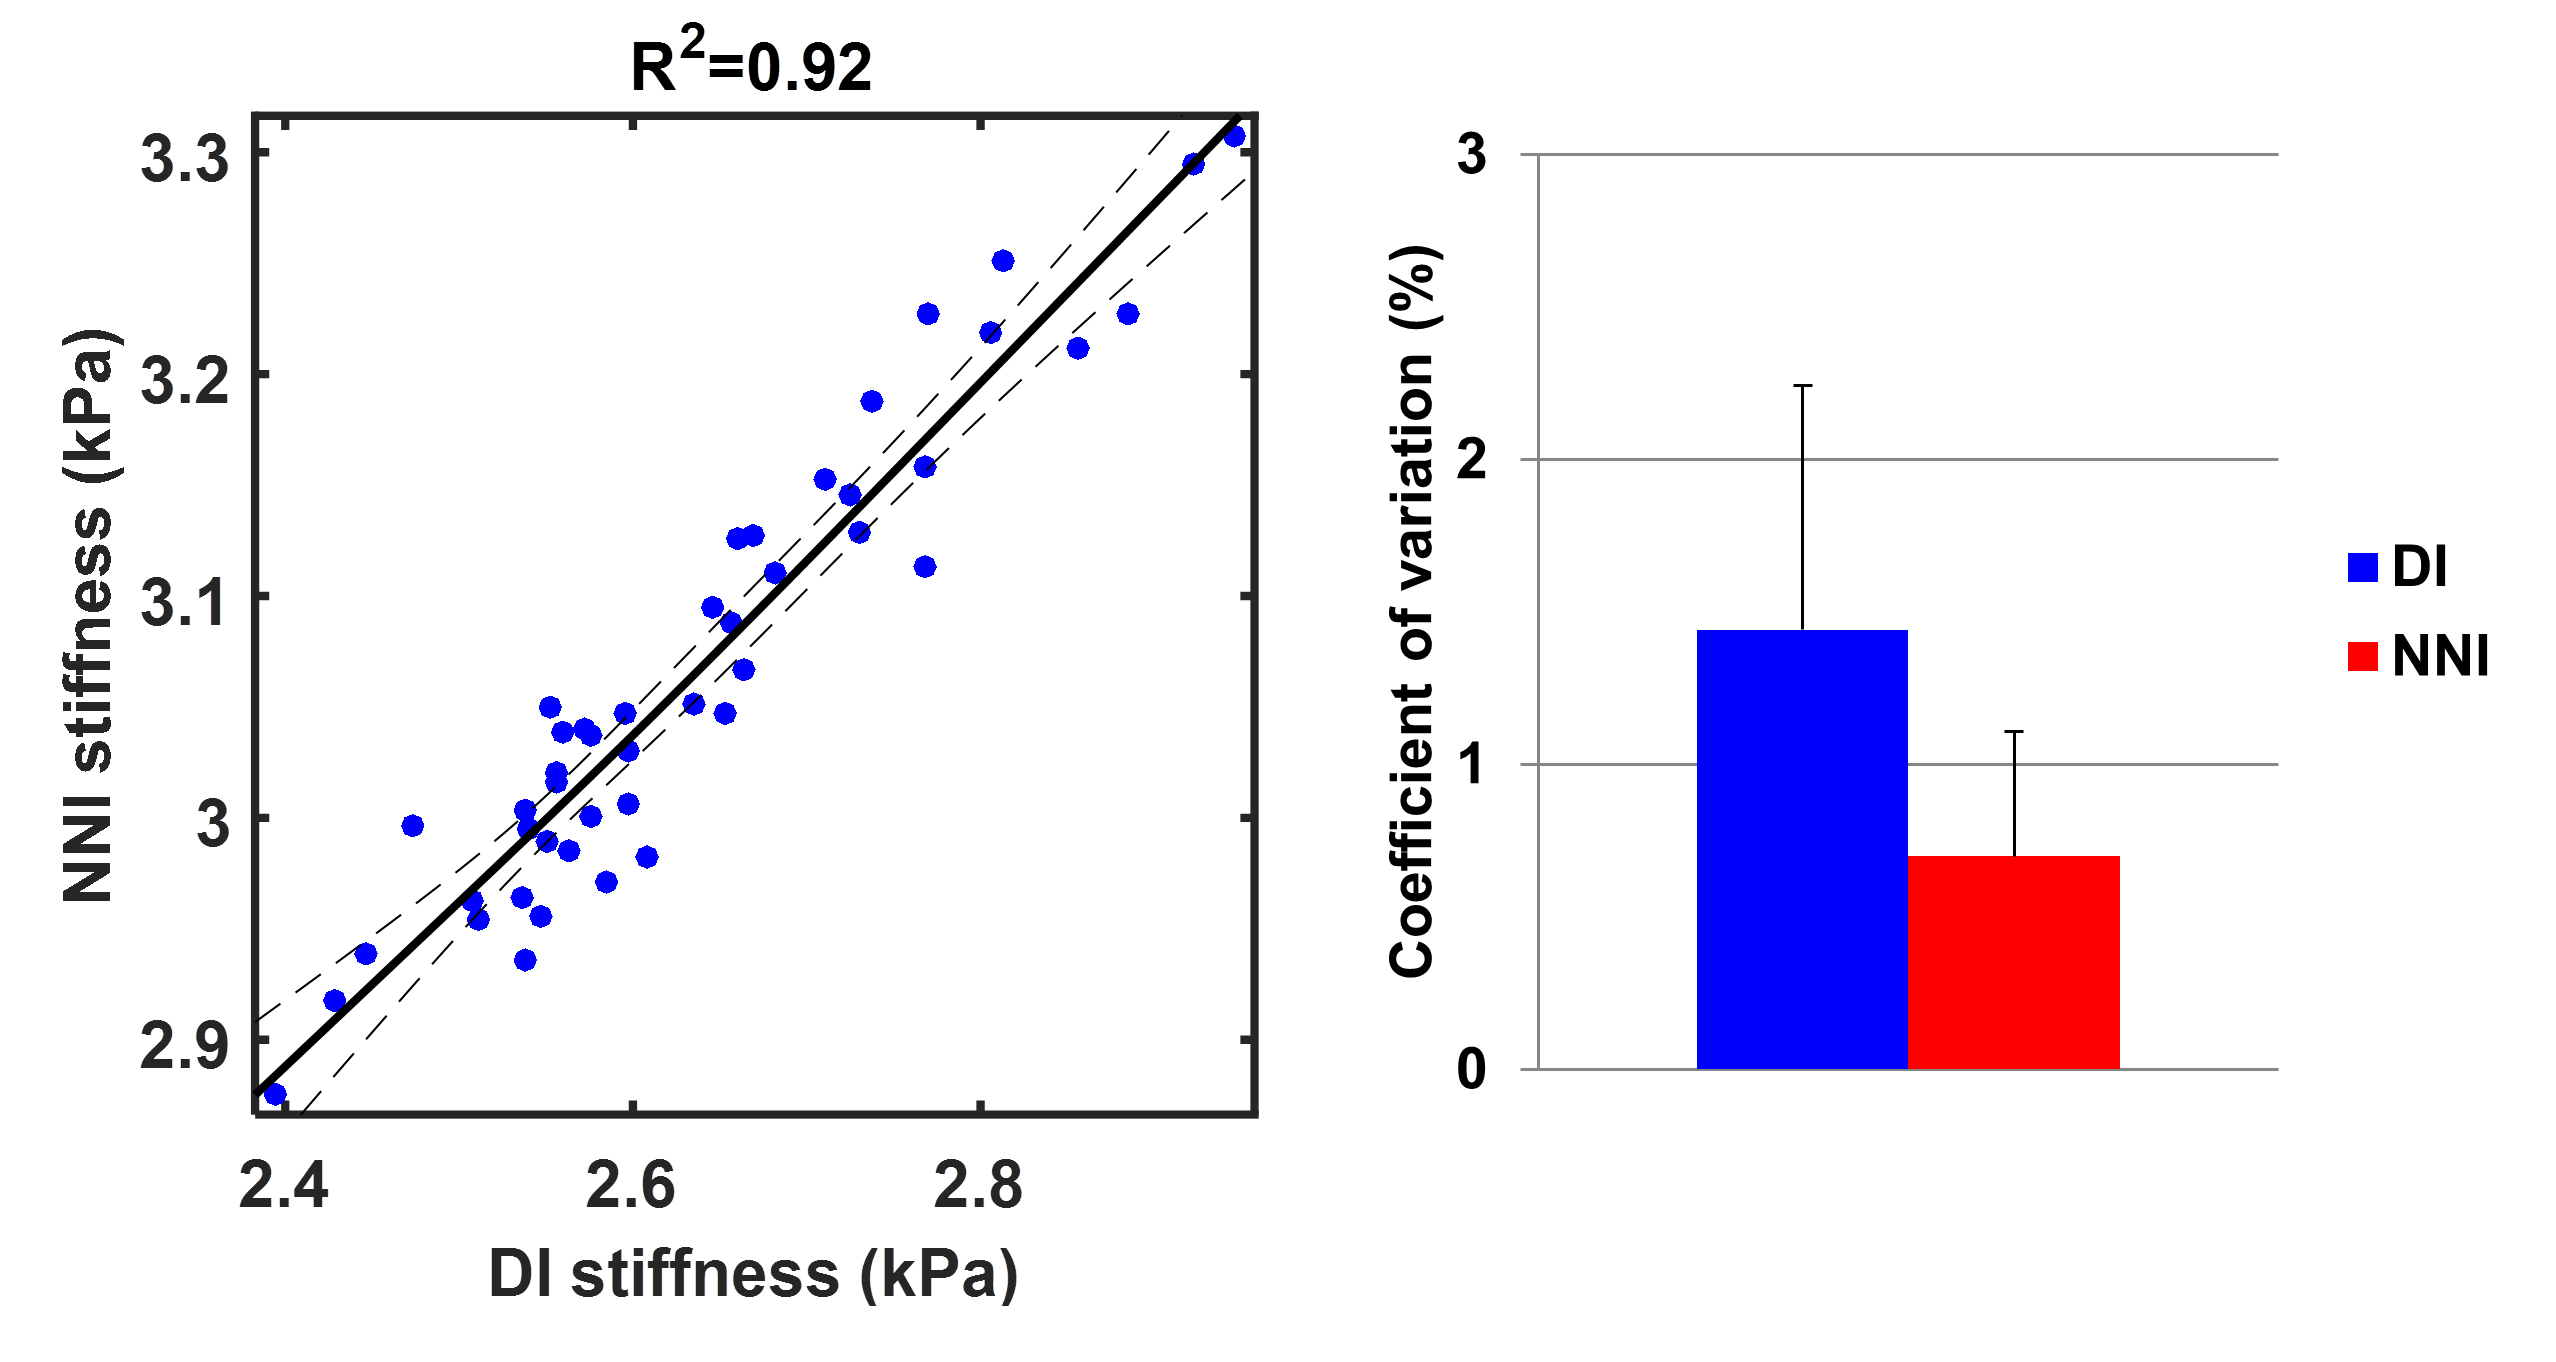
Summary results from the test set of the simulation study are shown in Figure 1, showing that the NNI stiffness estimate is more strongly correlated with the known underlying stiffness than the DI estimate. Example liver stiffness maps are shown in Figure 2, while the summary results are shown in Figure 3. The two stiffness estimates are tightly correlated, though there is a bias between two measures and the NNI estimates plateau in stiff cases. Example brain stiffness maps are shown in Figure 4, with summary results in Figure 5. Again the two stiffness estimates are tightly correlated though the absolute values are offset. Test-retest measurement error was reduced by approximately 50% using NNI.Discussion
NNI stiffness estimates were tightly correlated with established DI methods, across a range of fibrosis stages in the liver and age in the brain. This finding demonstrates the feasibility of such data-driven approaches to detect relevant biology. Furthermore, results in simulation and the brain repeatability study indicate reduced measurement error compared to DI, which can be traded for improved resolution by allowing reduced pre-processing or ROI size. Taken together, the results demonstrate the merit of further investigation into ANNs to estimate stiffness in MRE.Acknowledgements
This work was supported by the National Institutes of Health grant R37-EB001981.References
1 Muthupillai, R. et al. Magnetic resonance elastography by direct visualization of propagating acoustic shear waves. Science 269, 1854-1857 (1995).
2 Asbach, P. et al. Assessment of liver viscoelasticity using multifrequency MR elastography. Magnetic resonance in medicine 60, 373-379, doi:10.1002/mrm.21636 (2008).
3 Huwart, L. et al. Liver fibrosis: Noninvasive assessment with MR elastography versus aspartate aminotransferase-to-platelet ratio index. Radiology 245, 458-466, doi:10.1148/radiol.2452061673 (2007).
4 Rustogi, R. et al. Accuracy of MR elastography and anatomic MR imaging features in the diagnosis of severe hepatic fibrosis and cirrhosis. J Magn Reson Imaging 35, 1356-1364, doi:10.1002/jmri.23585 (2012).
5 Yin, M. et al. Hepatic MR Elastography: Clinical Performance in a Series of 1377 Consecutive Examinations. Radiology 278, 114-124, doi:10.1148/radiol.2015142141 (2016).
6 Moller, M. F. A Scaled Conjugate-Gradient Algorithm for Fast Supervised Learning. Neural Networks 6, 525-533, doi:Doi 10.1016/S0893-6080(05)80056-5 (1993).
7 Oliphant, T. E., Manduca, A., Ehman, R. L. & Greenleaf, J. F. Complex-valued stiffness reconstruction for magnetic resonance elastography by algebraic inversion of the differential equation. Magnetic resonance in medicine 45, 299-310 (2001).
8 Romano, A. J., Bucaro, J. A., Ehnan, R. L. & Shirron, J. J. Evaluation of a material parameter extraction algorithm using MRI-based displacement measurements. IEEE Trans Ultrason Ferroelectr Freq Control 47, 1575-1581, doi:10.1109/58.883546 (2000).
9 Chen, J. et al. Diagnostic Performance of MR Elastography and Vibration-controlled Transient Elastography in the Detection of Hepatic Fibrosis in Patients with Severe to Morbid Obesity. Radiology 283, 418-428, doi:10.1148/radiol.2016160685 (2017).
10 Silva, A. M. et al. Magnetic resonance elastography: evaluation of new inversion algorithm and quantitative analysis method. Abdominal imaging 40, 810-817, doi:10.1007/s00261-015-0372-5 (2015).
11 Arani, A. et al. Measuring the effects of aging and sex on regional brain stiffness with MR elastography in healthy older adults. NeuroImage 111, 59-64, doi:10.1016/j.neuroimage.2015.02.016 (2015).
12 Murphy, M. C. et al. Measuring the characteristic topography of brain stiffness with magnetic resonance elastography. PloS one 8, e81668, doi:10.1371/journal.pone.0081668 (2013).
Figures