0436
Predict the slow oscillation of the single-vessel resting-state fMRI signal of rats and humans with echo state networks1MPI for Biological Cybernetics, Tübingen, Germany
Synopsis
Single-vessel fMRI has enabled the detection of slow fluctuations (<0.1Hz) of the hemodynamic fMRI signal from individual vessels in both rat and human brains. The Echo State Network (ESN) has been used to encode the slowly changing temporal dynamics of individual vessels by training the network to predict the oscillatory signals from individual vessels 10 seconds ahead in time. Distinct network reservoirs are optimized for human and animal vascular signals, showing high correlation for the ESN-predictive signal with the original fresh data. This work establishes ESN-based signal prediction for the slow-oscillatory brain fMRI signal in real-time.
Introduction
Resting-state fMRI signal has been shown to be closely coupled to brain-wide neuronal signal fluctuations, presenting large-scale functional connectivity1,2,3. The resting-state fMRI signal fluctuation demonstrates <0.1 Hz oscillatory patterns at varied brain states4. Here, we hypothesize that the spectral feature of the slow oscillatory pattern can be encoded by an artificial neural network system in a supervised learning process, and that the temporal dynamic pattern of the fMRI signal fluctuation can be predicted by the trained neural network.
Recently, a single-vessel fMRI method has been developed to characterize the resting-state fMRI signal fluctuation from individual vessels5,6. The single-vessel fMRI with simultaneous GCaMP-mediated calcium recordings revealed that (i) single venules are the main contributors of cortical slow fluctuations observed in whole-brain BOLD measurements and (ii) vascular fluctuations closely follow changes in neural activity. Here, we built up an Echo State Network7 (ESN) system to process single-vessel fMRI signal fluctuations and predict the <0.1 Hz slow oscillatory temporal dynamics with 10 seconds lead time.
Methods
Rat data acquisition
All images in rats were acquired with a 14.1T/26em horizontal bore magnet (Magnex) interfaced to an Avanee Ill console (Bruker) using the bSSFP8 method. A transceiver surface coil with a 6-mm diameter was used to acquire images. bSSFP was implemented with the following parameters: TE:3.9 ms;TR,7.8 ms; flip angle (FA),12°;matrix, 128x128;slice thickness,400 IJm; in-plane resolution,100x100 1Jm2,resulting in one slice repetition time of 1 s. The duration of each trial of resting state fMRI was 15 minutes, and data from 6 rats has been acquired.
Human data acquisition
All measurements were performed on a 3T Siemens Prisma with a 20-channel receive head coil. 6 healthy adult subjects were scanned using an EPI sequence with the following parameters: TR, 1000 ms; TE, 29 ms; FA. 60°; GRAPPA factor 3; partial Fourier 6/8; matrix, 121 x 119; in-plane resolution, 840 1-1m x 840 IJm; 9 slices with a thickness of 1.5 mm. The duration of each trial of rs-fMRI was 15 minutes with eyes closed.
Data preprocessing
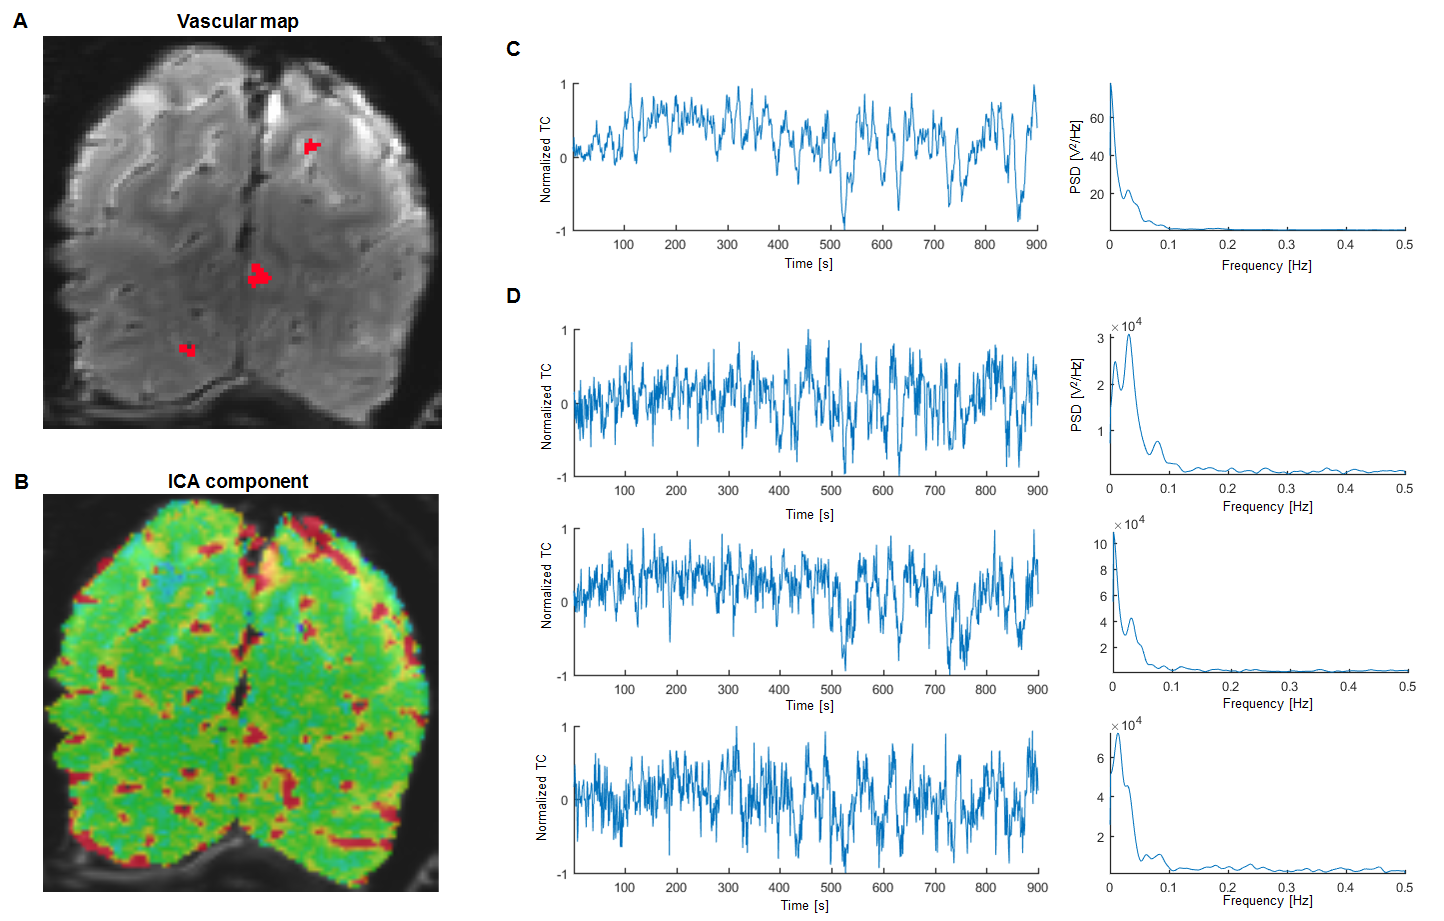
Locations of single vessels penetrating the rat somatosensory cortex were found using a high-resolution anatomical image – the A-V map (Fig. 1,2-A)5. Independent component analysis9 has been employed for every trial to find a component exhibiting a strong slow fluctuation and its corresponding spatial map highlighting the dominating vascular contribution (Fig. 1,2-B,C). These two analysis steps combined allowed to extract time courses only from venules displaying strong slow fluctuations (Fig. 1,2-D). In the case of human data the ICA step alone has been sufficient. After normalizing the data, the signals have been bandpass filtered in either 0.01-0.05 Hz (rat) or 0.01-0.1 Hz (human) frequency ranges to extract the slowly changing feature.
Encoding
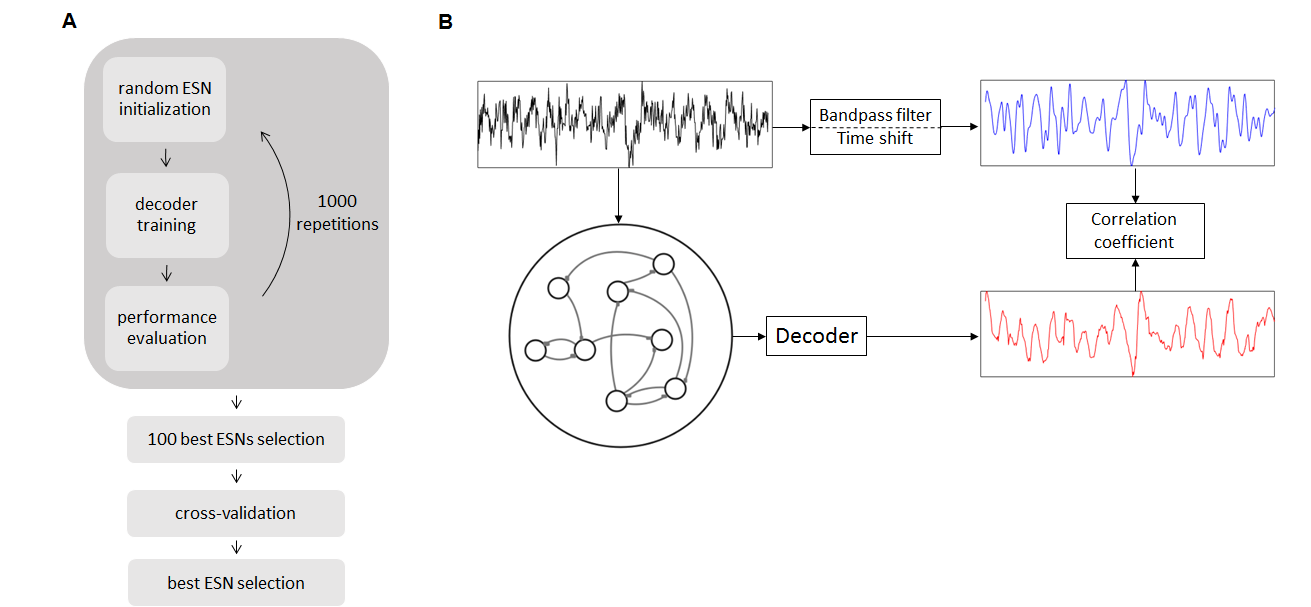
The slow fluctuations have been encoded using ESNs – artificial neural networks trained using a supervised learning scheme. This has been done by forcing the ESNs to predict the extracted features (network output) shifted by 10 seconds with regard to the normalized raw data (network input) (Fig. 3). Every ESN performs the encoding by projecting the temporal structure of input data onto a high-dimensional space, in which features are analyzed by a simple linear decoder to generate the prediction. To find the networks achieving best predictions of vascular dynamics random search optimization10 has been employed.
Controls
Surrogate data11, artificial signals that preserve the autocorrelation structure and mean of their source data, have been generated based on real vascular time courses. These served as controls verifying the degree of encoding performed by the chosen ESNs.
Results
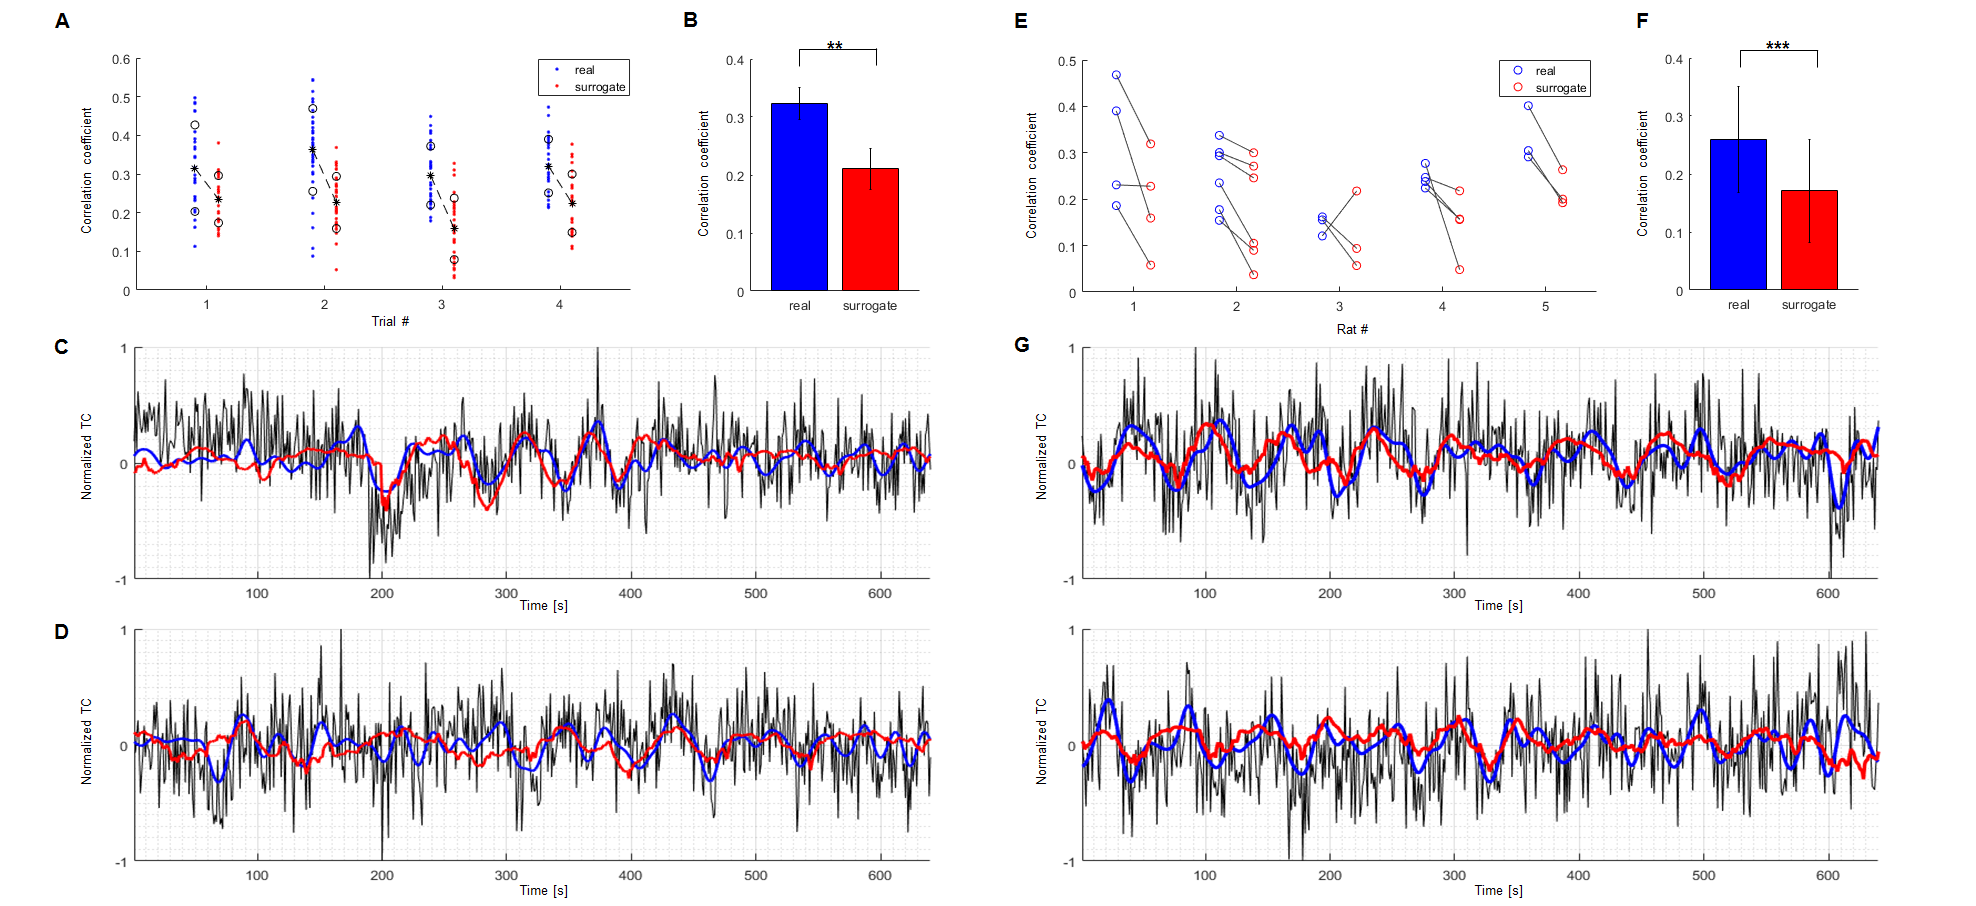
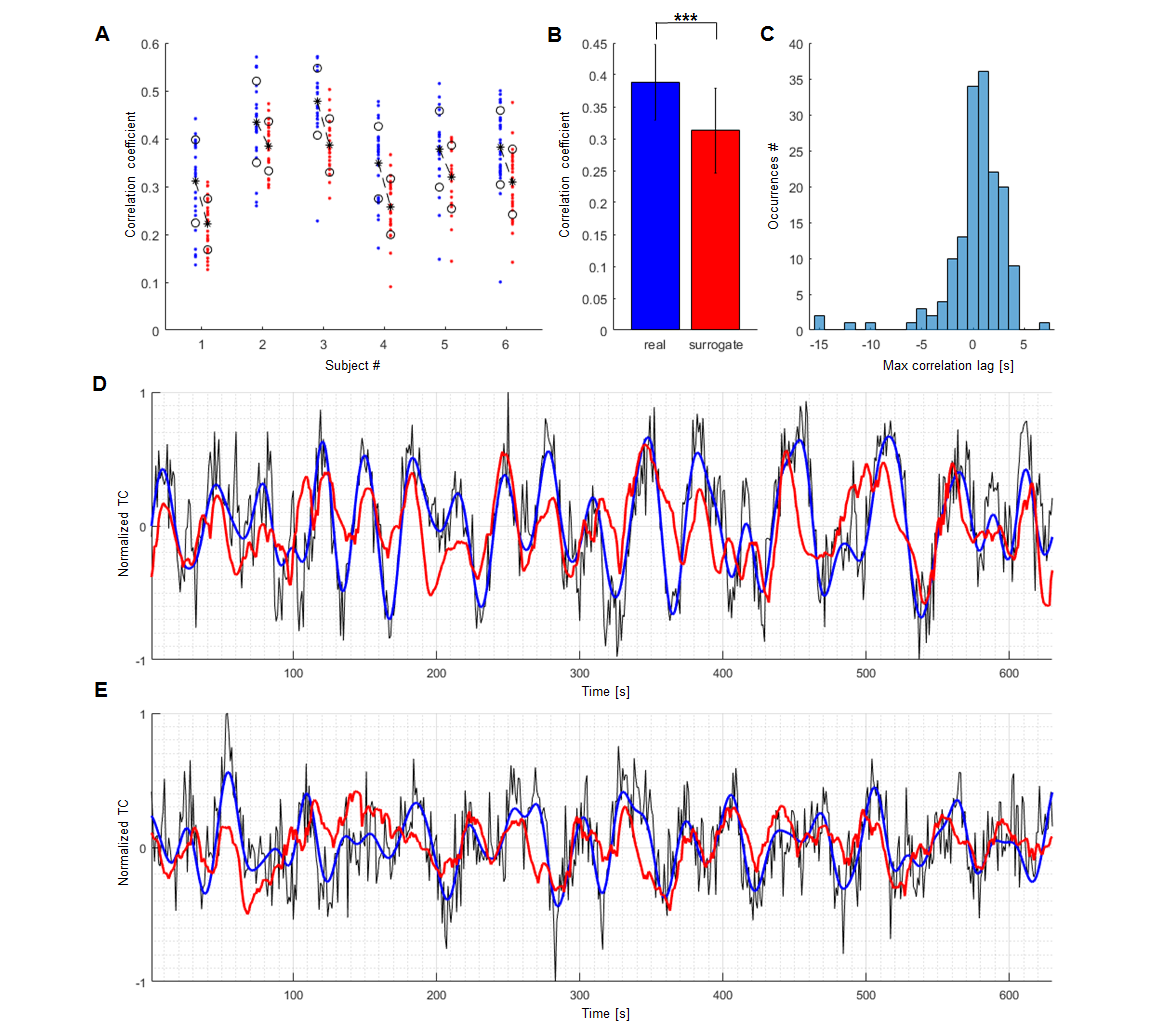
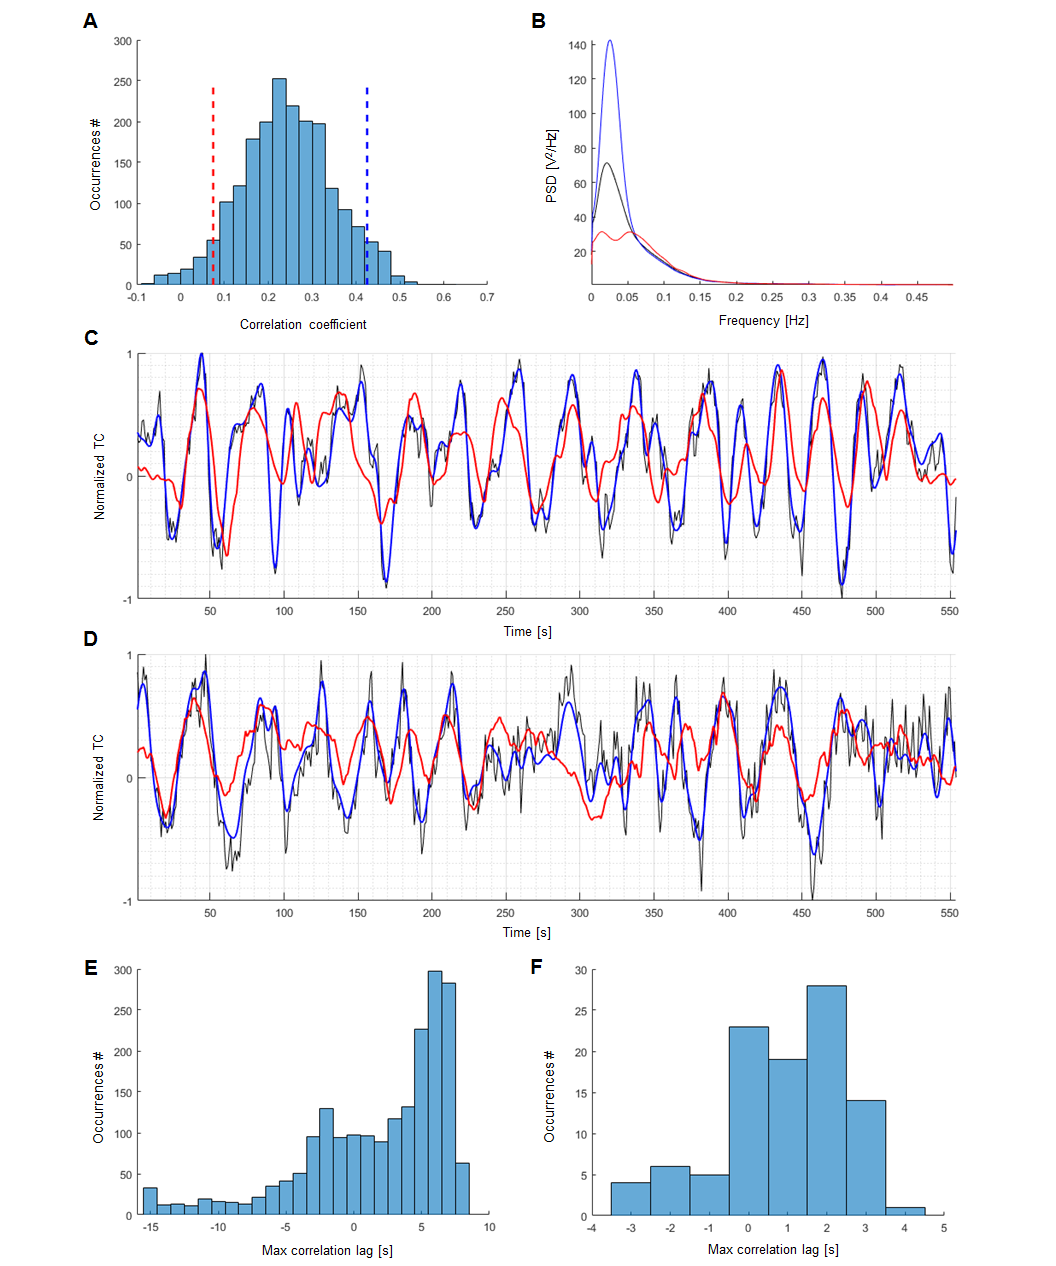
The ESNs were trained for human and rat data respectively and their performances have been evaluated by computing Pearson correlation coefficients between network-predictive outputs and fresh target output data (Fig. 4,5-A). In both human and rat cases the predictions of real data obtained significantly higher scores than those of controls (Fig. 4,5-B). The optimized ESN reservoir from one rat can be used to predict slow fMRI signal fluctuations of other rats (Fig. 4E). Also, an ESN trained on human vessels has been employed in a preliminary effort to classify signals extracted from V1 cortex ROIs obtained from the Human Connectome Project12 data, showing different slow oscillatory features over the 250 human subjects (Fig. 6).
In summary, we have established an ESN system to predict the slow oscillatory temporal dynamic pattern of single-vessel fMRI signal fluctuation. This ESN system could even be applied to classify the different slow oscillatory temporal dynamics in the HCP data.
Acknowledgements
This research was supported by the Internal funding from Max Planck Society and the Graduate Training Center of neuroscience, International Max Planck Research School.References
1. Scholvinck, M.L., Maier, A., Ye, F.Q., Duyn, J.H. & Leopold, D.A. Neural basis of global resting state fMRI activity. Proceedings of the National Academy of Sciences of the United States of America 107, 10238-10243, doi:10.1073/pnas.0913110107 (2010).
2. Ma, Y. et al. Resting-state hemodynamics are spatiotemporally coupled to synchronized and symmetric neural activity in excitatory neurons. Proceedings of the National Academy of Sciences of the United States of America 113, E8463-E8471, doi:10.1073/pnas.1525369113 (2016).
3. Biswal, B., Zerrin Yetkin, F., Haughton, V. M. & Hyde, J. S. Functional connectivity in the motor cortex of resting human brain using echo-planar mri. Magnetic resonance in medicine 34, 537–541 (1995).
4. Obrig, H. et al. Spontaneous low frequency oscillations of cerebral hemodynamics and metabolism in human adults. NeuroImage 12, 623-639, doi:10.1006/nimg.2000.0657 (2000).
5. Yu, X. et al. Sensory and optogenetically driven single-vessel fMRI. Nature methods 13, 337-340, doi:10.1038/nmeth.3765 (2016).
6. He, Y. et al. under review.
7. Jaeger, H. The “echo state” approach to analysing and training recurrent neural networks-with an erratum note. Bonn, Germany: German National Research Center for Information Technology GMD Technical Report 148, 34 (2001).
8. Scheffler, K. & Lehnhardt, S. Principles and applications of balanced SSFP techniques. European Radiology 13, 2409–2418 (2003).
9. Calhoun, V. D., Liu, J. & Adalı, T. A review of group ICA for fMRI data and ICA for joint inference of imaging, genetic, and ERP data. NeuroImage 45, S163–S172 (2009).
10. Bergstra, J. & Bengio, Y. Random search for hyper-parameter optimization. The Journal of Machine Learning Research 13, 281–305 (2012).
11. Schreiber, T. & Schmitz, A. Surrogate time series. Physica D: Nonlinear Phenomena 142, 346–382 (2000).
12. Van Essen, D. C. et al. The Human Connectome Project: A data acquisition perspective. NeuroImage 62, 2222–2231 (2012).
Figures