0434
Machine learning based estimation of axonal permeability: validation on cuprizone treated in-vivo mouse model of axonal demyelination1Computer Science Department and Centre for Medical Imaging Computing, University College London, London, United Kingdom, 2CENIR, ICM, Paris, France, 3Inserm U 1127, CNRS UMR 7225, Sorbonne Universités, UPMC Univ Paris 06 UMR S 1127, Institut du Cerveau et de la Moelle épinière, ICM, Paris, France, 4INRIA, Université Côte d'Azur, Sophia-Antipolis, France, 5Parietal, CEA, INRIA, Saclay, France, 6AP-HP, Hôpital Saint-Antoine, Paris, France, 7Hôpital de la Pitié Salpêtrière, Sorbonne Universités, UPMC Paris 06 UMR S 1127, Inserm UMR S 1127, CNRS UMR 7225, Institut du Cerveau et de la Moelle épinière, Paris, France, 8AP-HP, Hôpital de la Pitié Salpêtrière, Paris, France
Synopsis
Estimating axonal permeability reliably is extremely important, however not yet achieved because mathematical models that express its relationship to the MR signal accurately are intractable. Recently introduced machine learning based computational model showed to outperforms previous approximate mathematical models. Here we apply and validate this novel method experimentally on a highly controlled in-vivo mouse model of axonal demyelination, and demonstrate for the first time in practice the power of machine learning as a mechanism to construct complex biophysical models for quantitative MRI.
Introduction
Quantitative MRI relies on biophysical models to relate MR signals to tissue properties, but mathematical models rapidly become intractable beyond very simple descriptions of tissue, and parameters such as permeability remain elusive. A recent study1 demonstrated that using machine learning we can construct a computational model that outperforms approximate mathematical models in estimating permeability via the residence time τi of water inside axons. τi is a potentially important biomarker for white matter pathologies, as myelin damage is hypothesized to affect axonal permeability, and thus τi.
Here we for the first time apply and validate this novel idea on a highly controlled in-vivo mouse model of axonal demyelination. We use Monte Carlo simulations and random forest (RF) regression1 to build a mapping between diffusion-weighted MR signals and ground-truth microstructure parameters. We then estimate differences in τi between in-vivo healthy and cuprizone-treated (CPZ) mice brain, a well-known model of white matter (WM) demyelination.
Methods
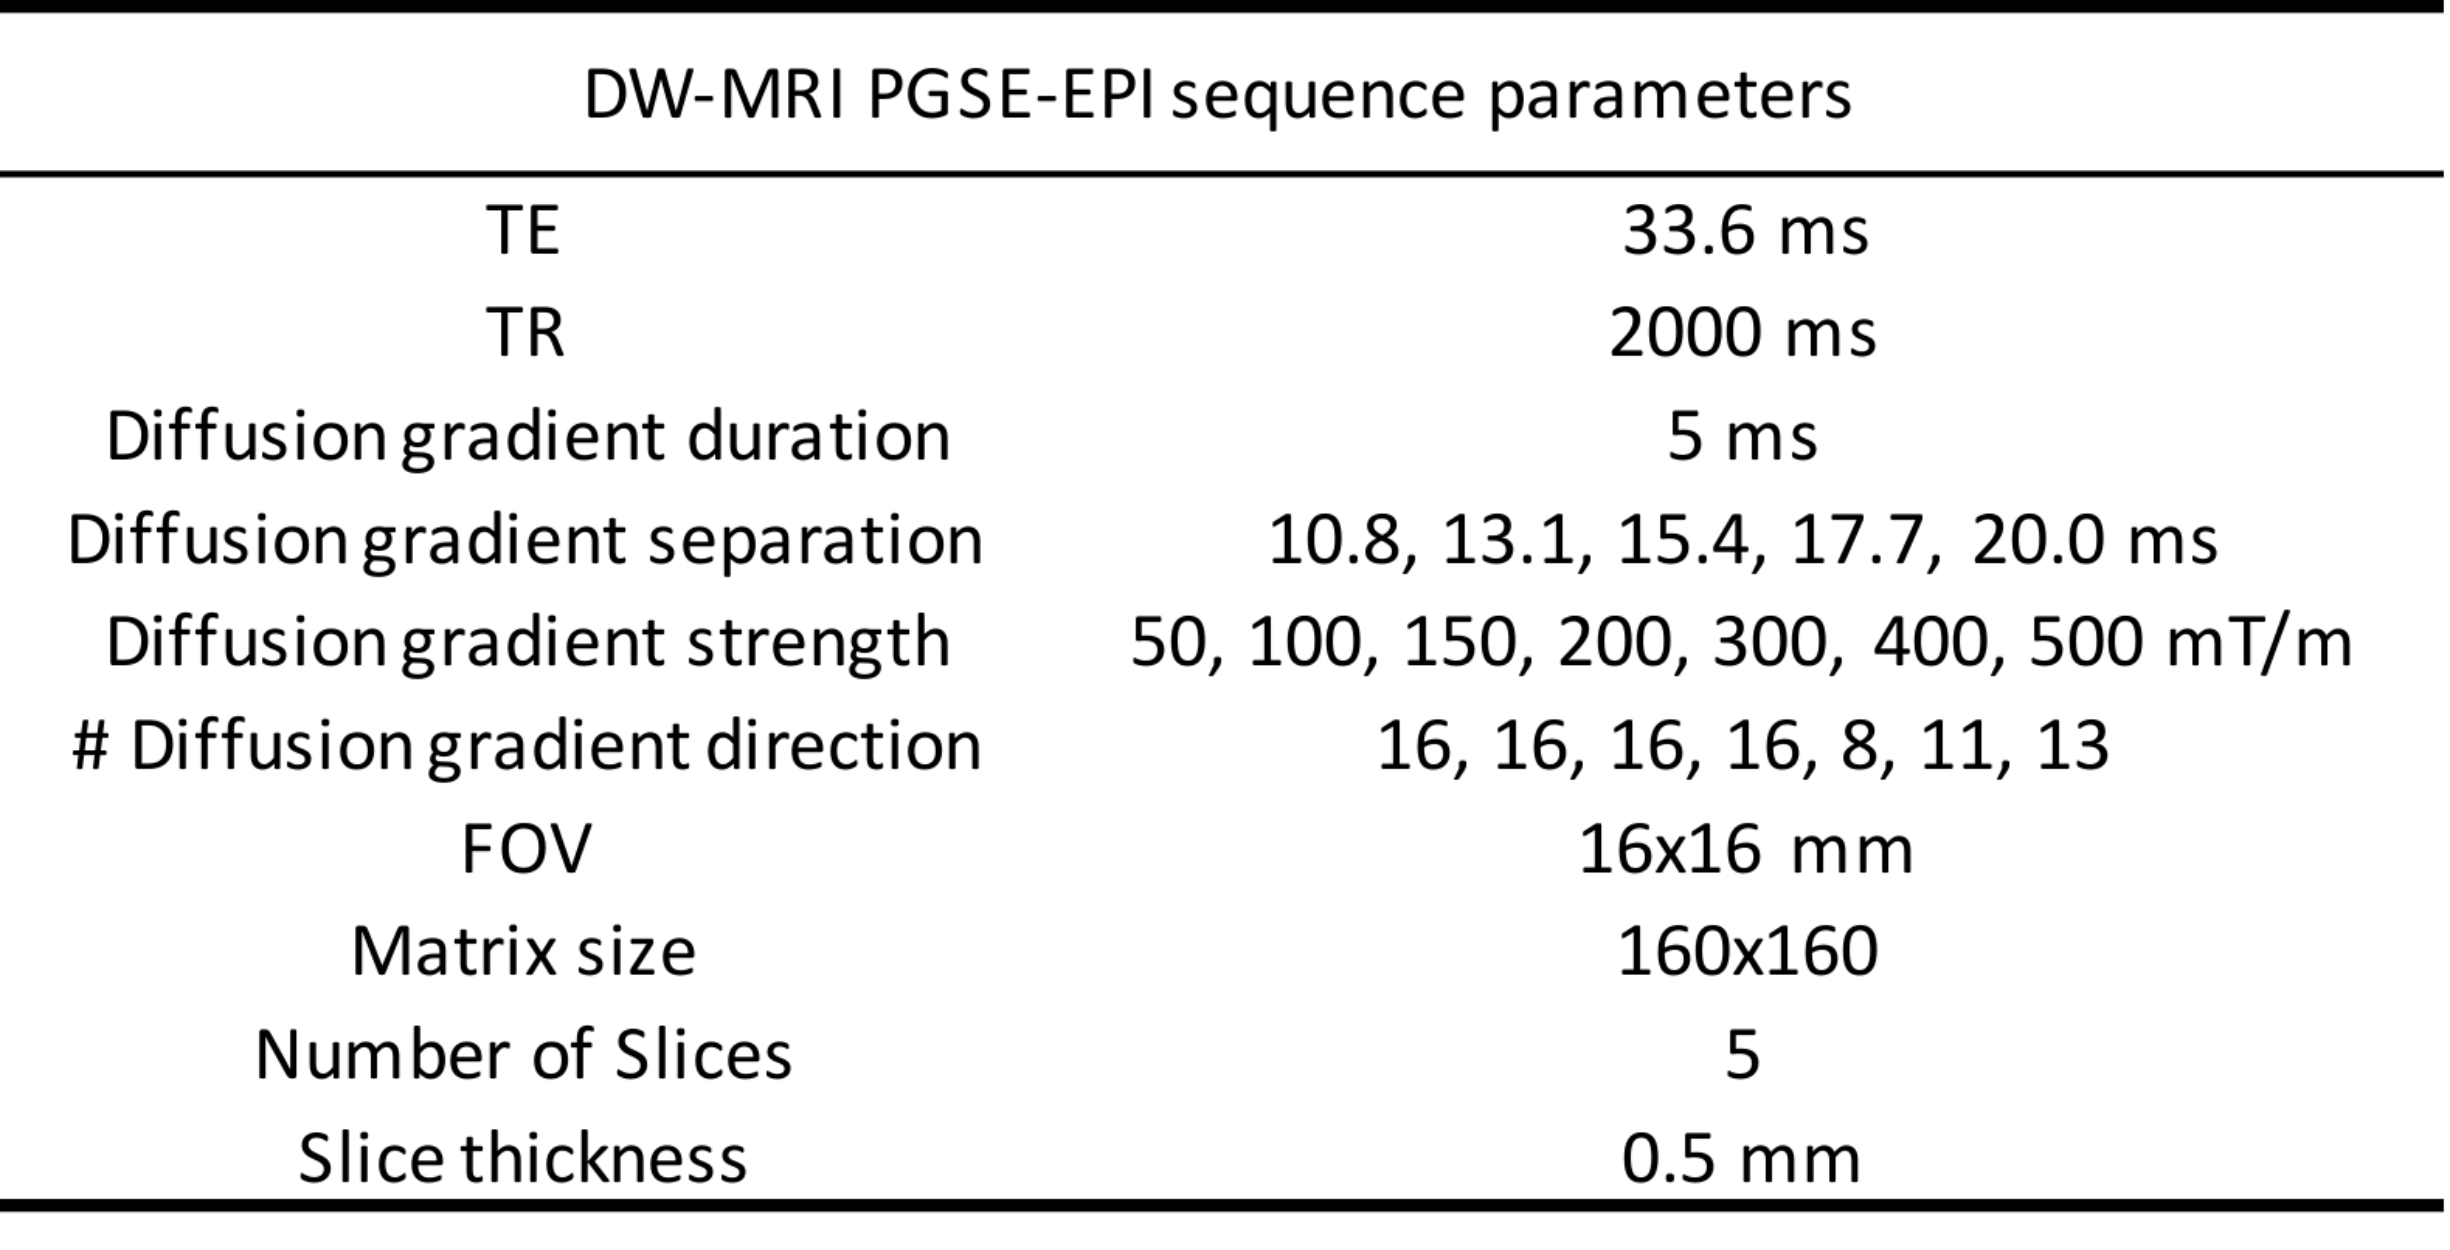
In-vivo data. We used a diffusion-weighted Pulsed-Gradients-Spin-Echo (DW-PGSE) protocol (Tab.1). We scanned sixteen C57BL6J mice on BrukerBioSpec 11.7T: eight CPZ mice at 6 weeks post intoxication (0.2% cuprizone) and eight healthy age-matched wild-type (WT) mice of the same background (data available on https://zenodo.org/record/996889#.WgH5E9vMx24). Images are corrected for eddy-currents using FSL-eddy. DTI and NODDI2 maps are computed for comparison.
Simulation data. We used MC simulations in CAMINO3. To mimic the in-vivo mouse brain, WM was modelled as a collection of non-abutting parallel cylinders with gamma-distributed radii with parameters randomly selected for 11000 substrates in the ranges: mean and standard deviation of axonal radius μR∈[0.1,1.0]μm and σR∈[min(0.1,μR/5),μR/2]μm, intra-axonal volume fraction fi∈[0.40,0.75], τi∈[0.02,1.00]s, intrinsic diffusivity d∈[0.8,2.2]μm2/ms. Signal-to-noise ratio 30.
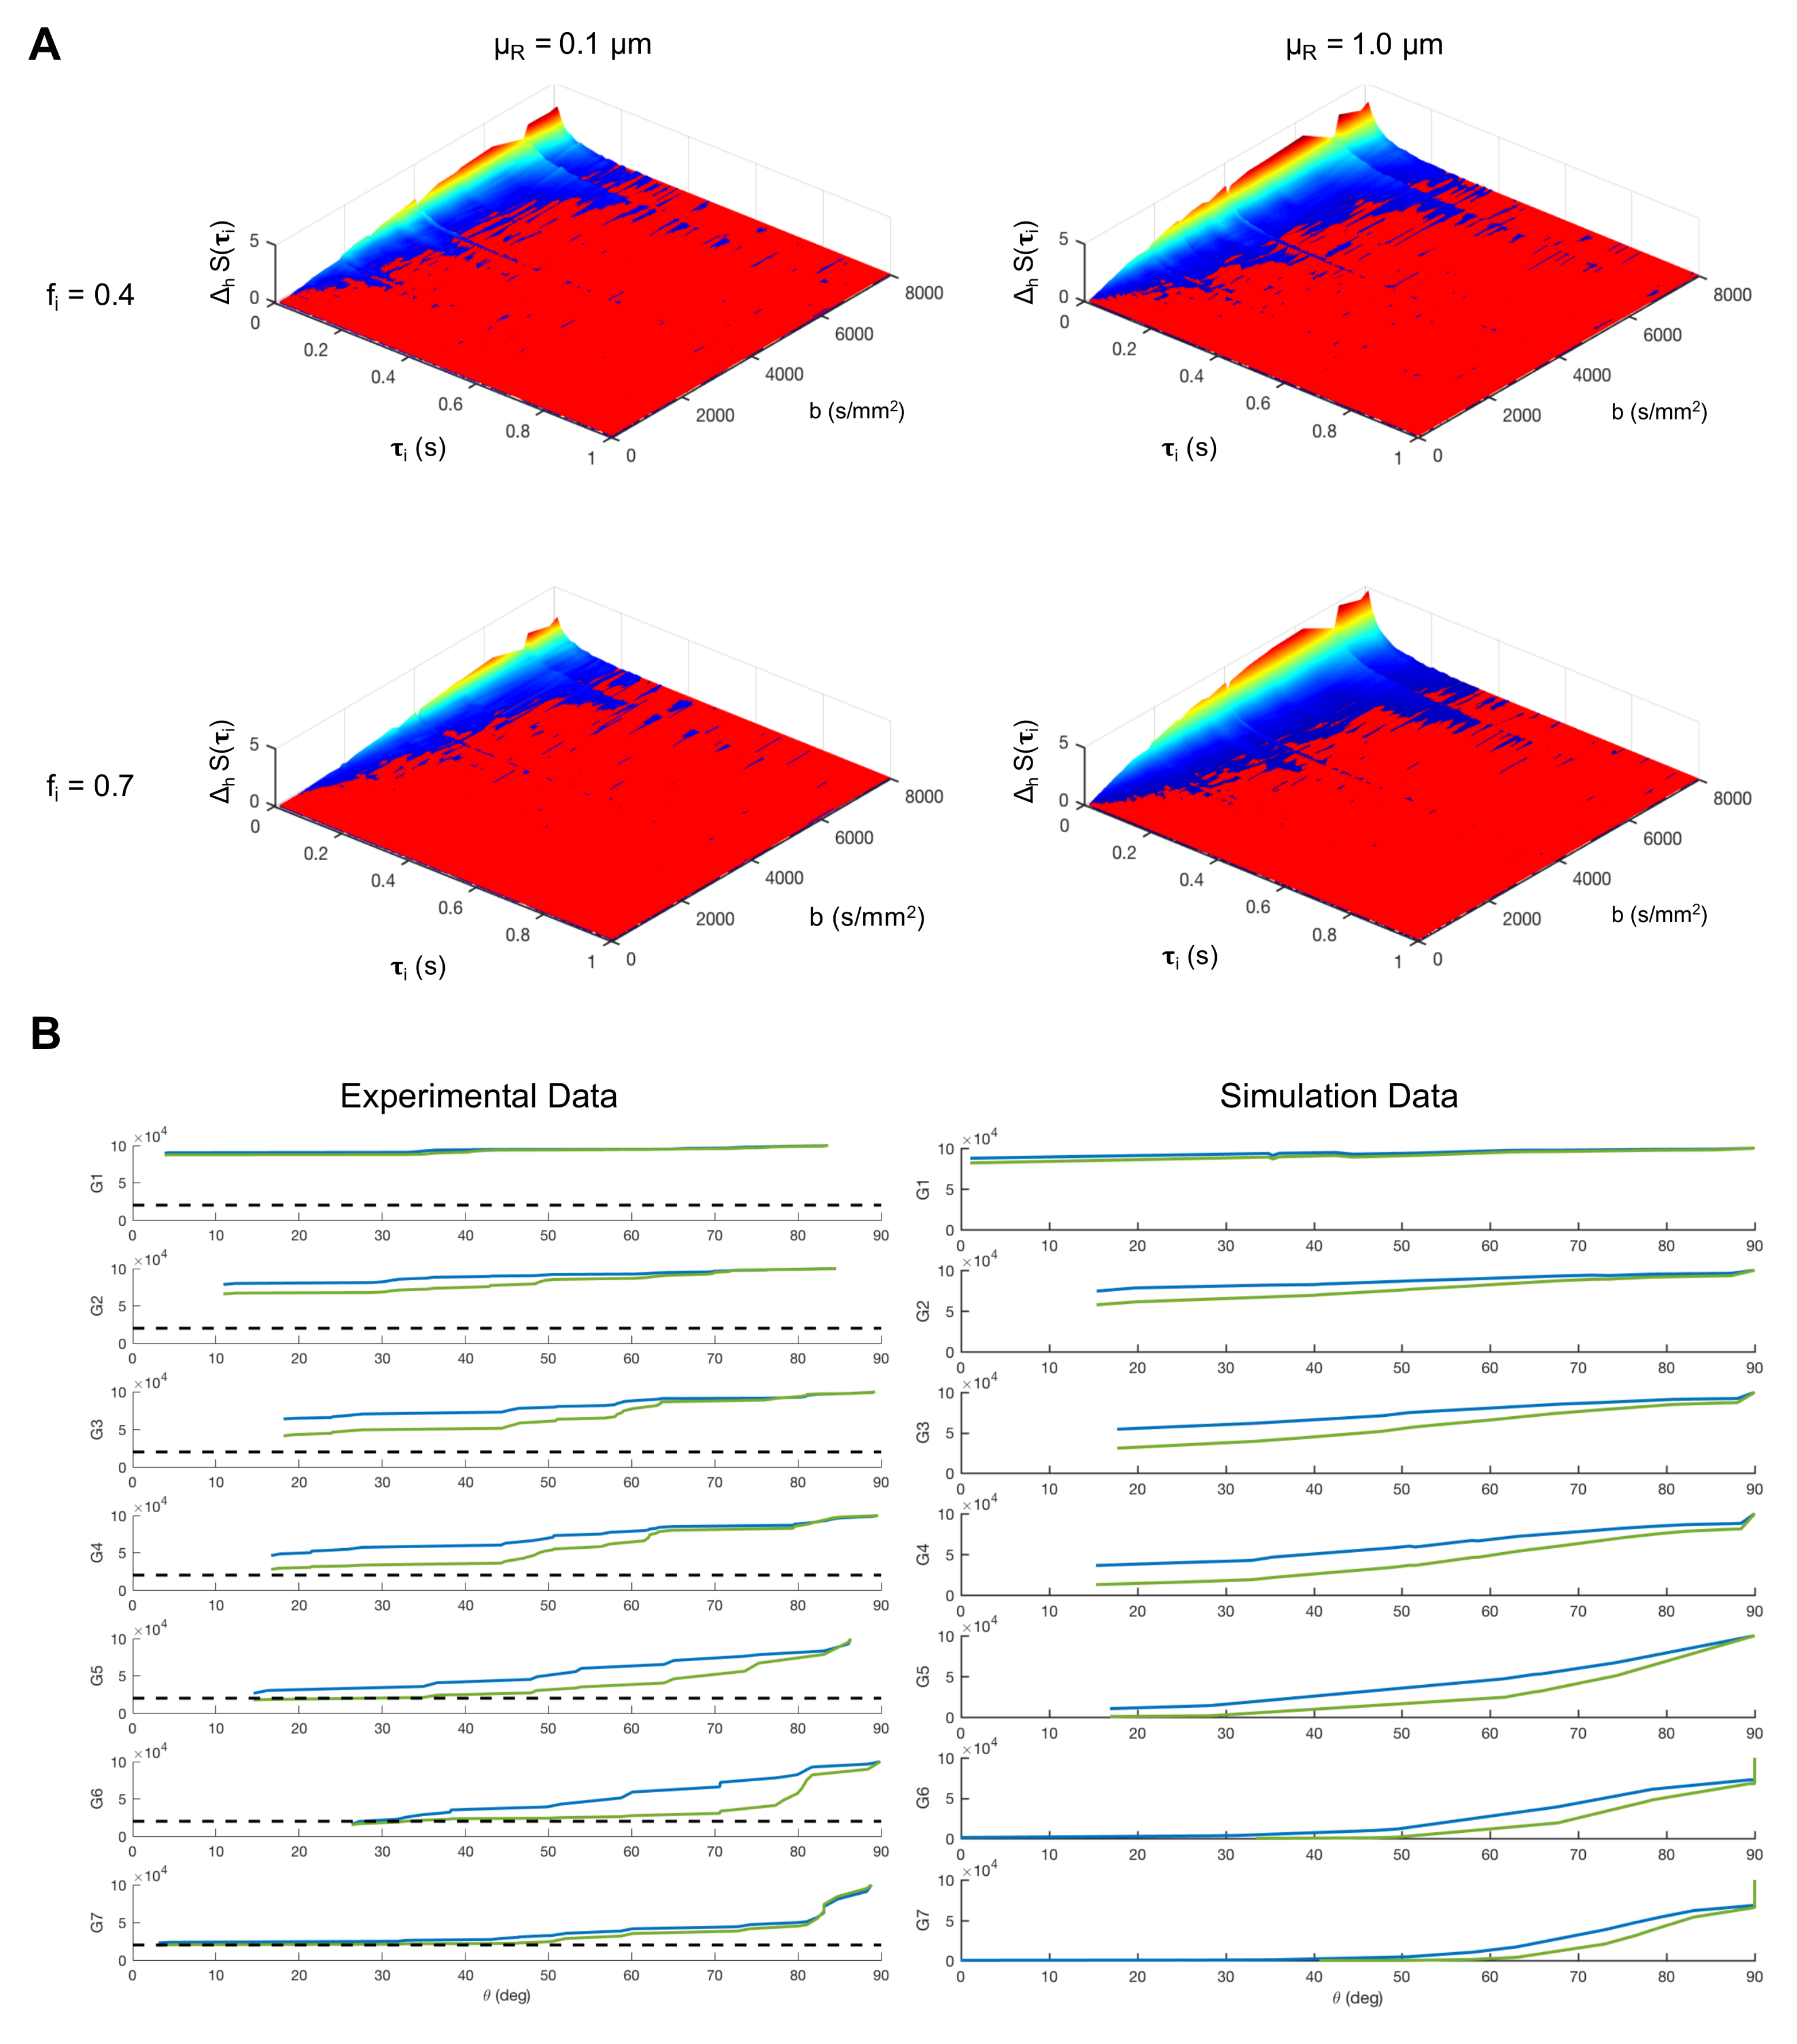
Data quality test. We assessed the sensitivity of our imaging protocol to τi using synthetic data as in4, and the quality of the synthetic data by direct comparison with the in-vivo data.
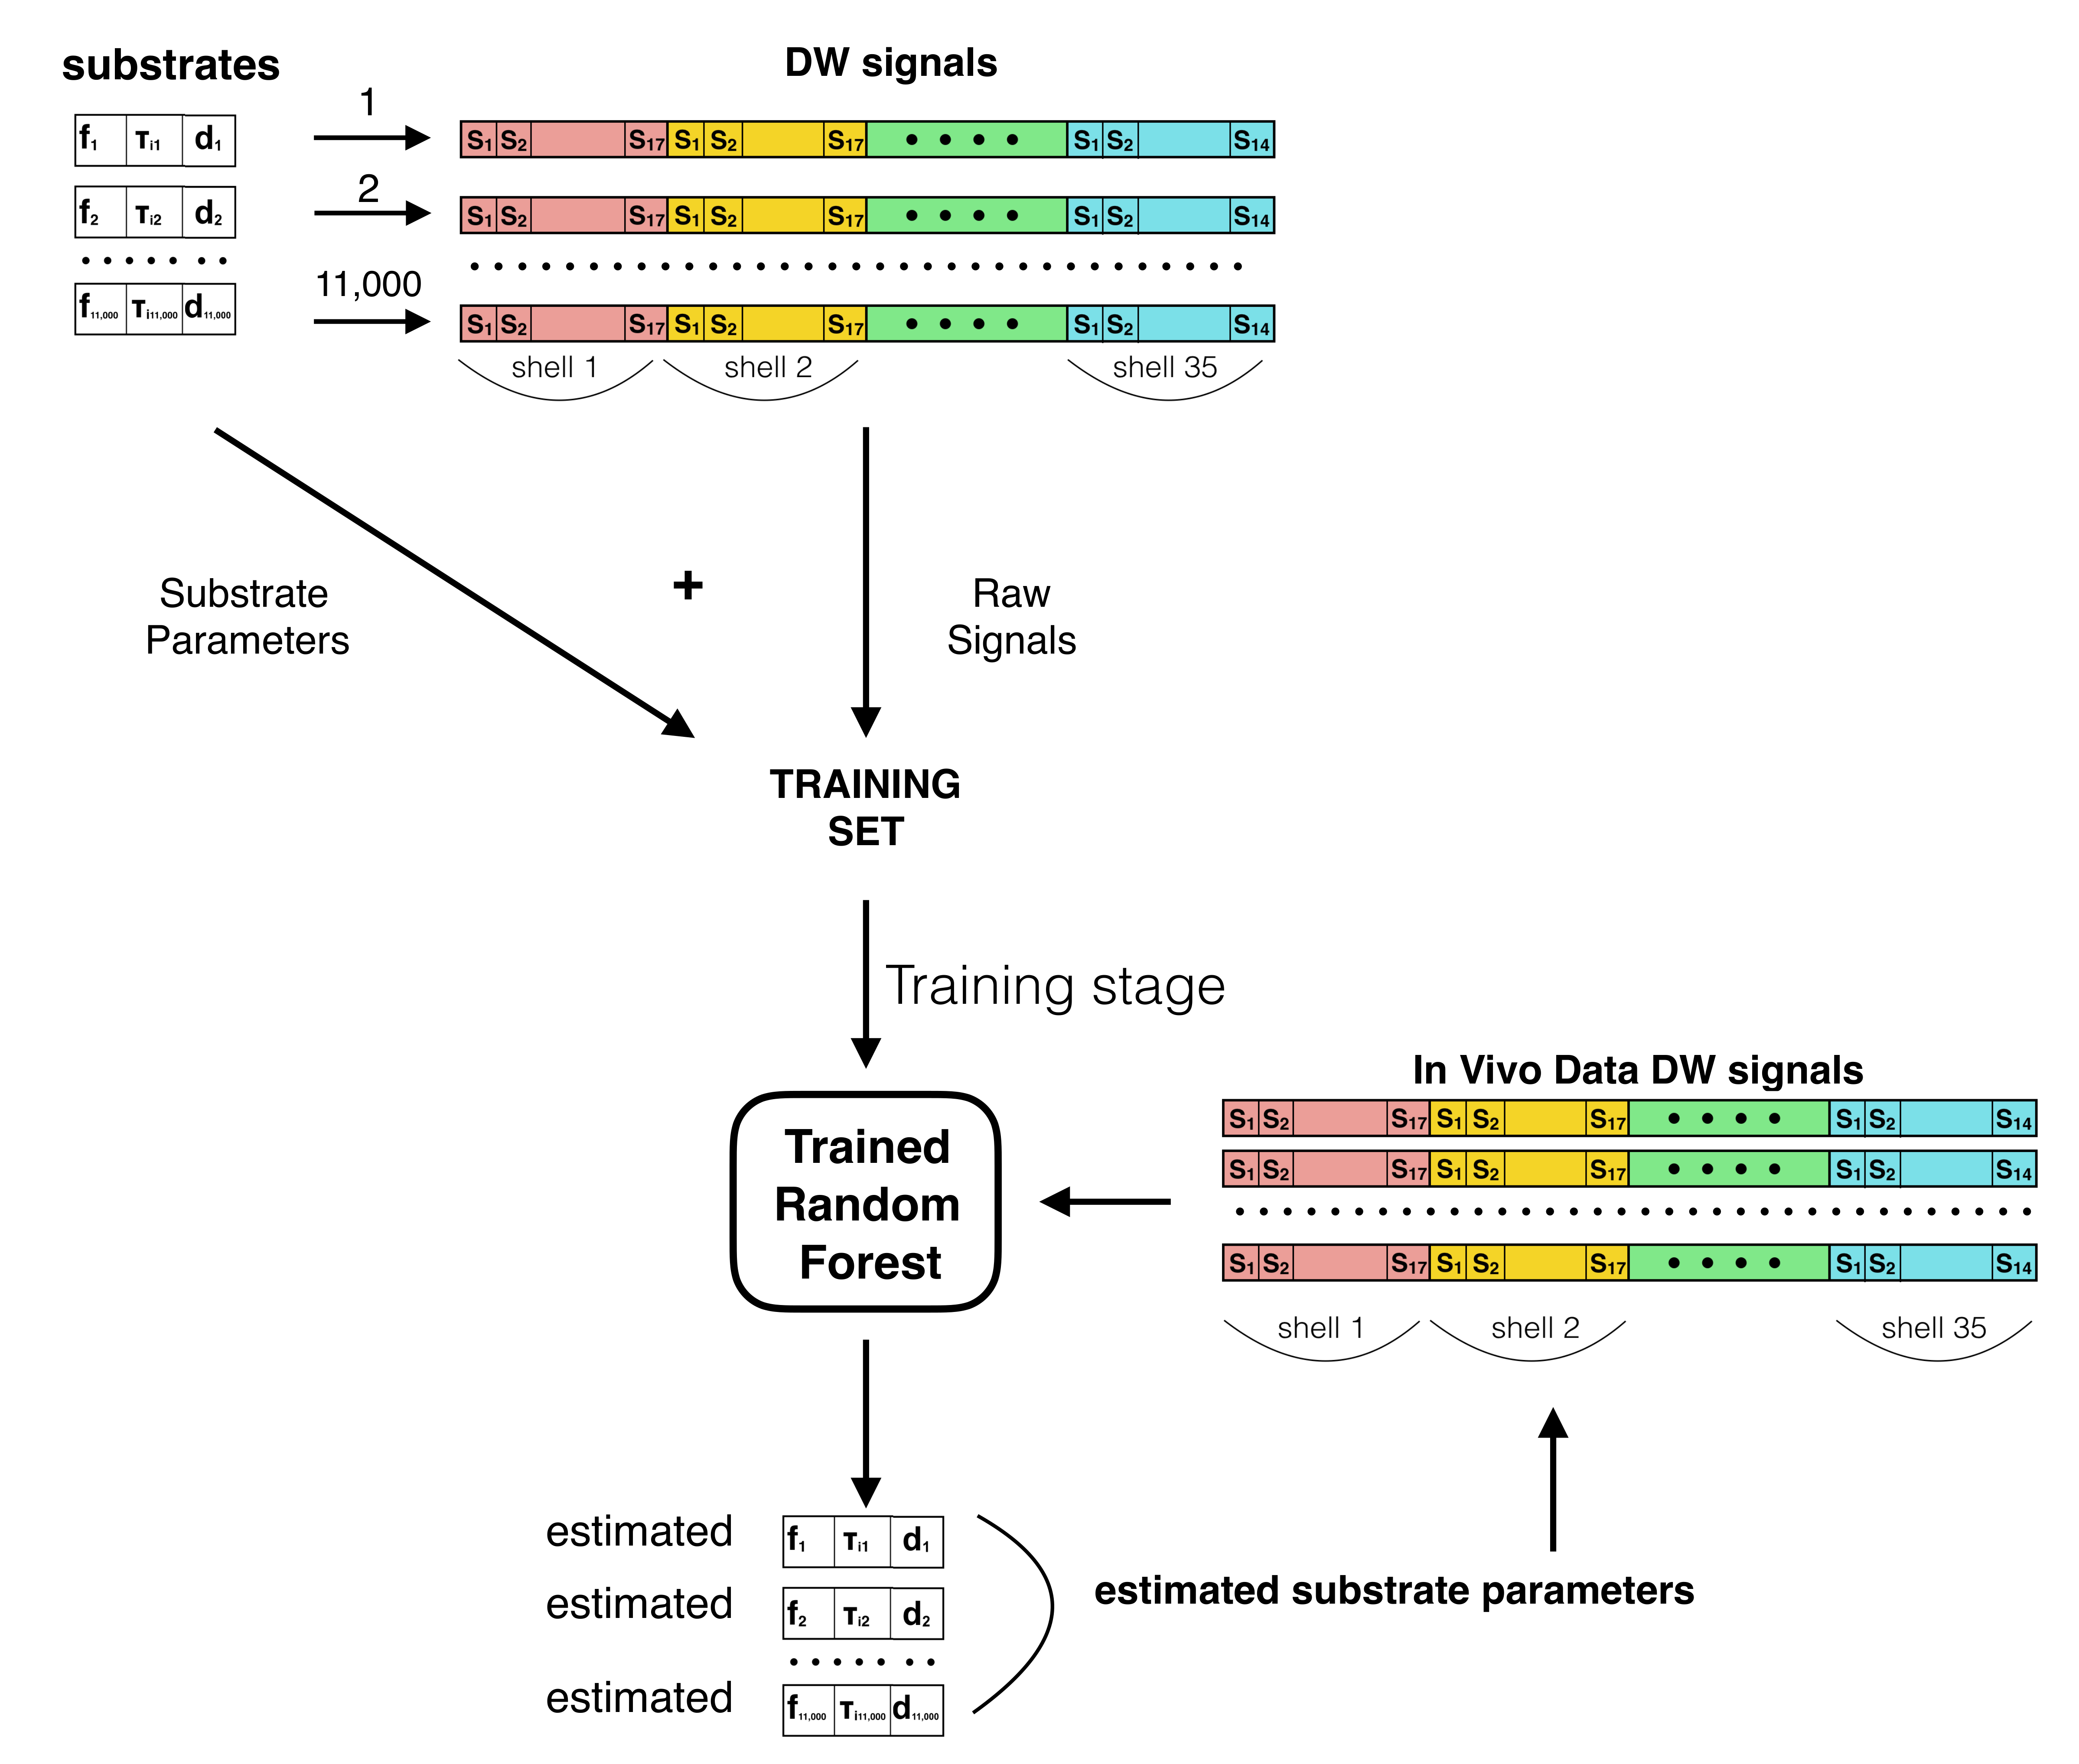
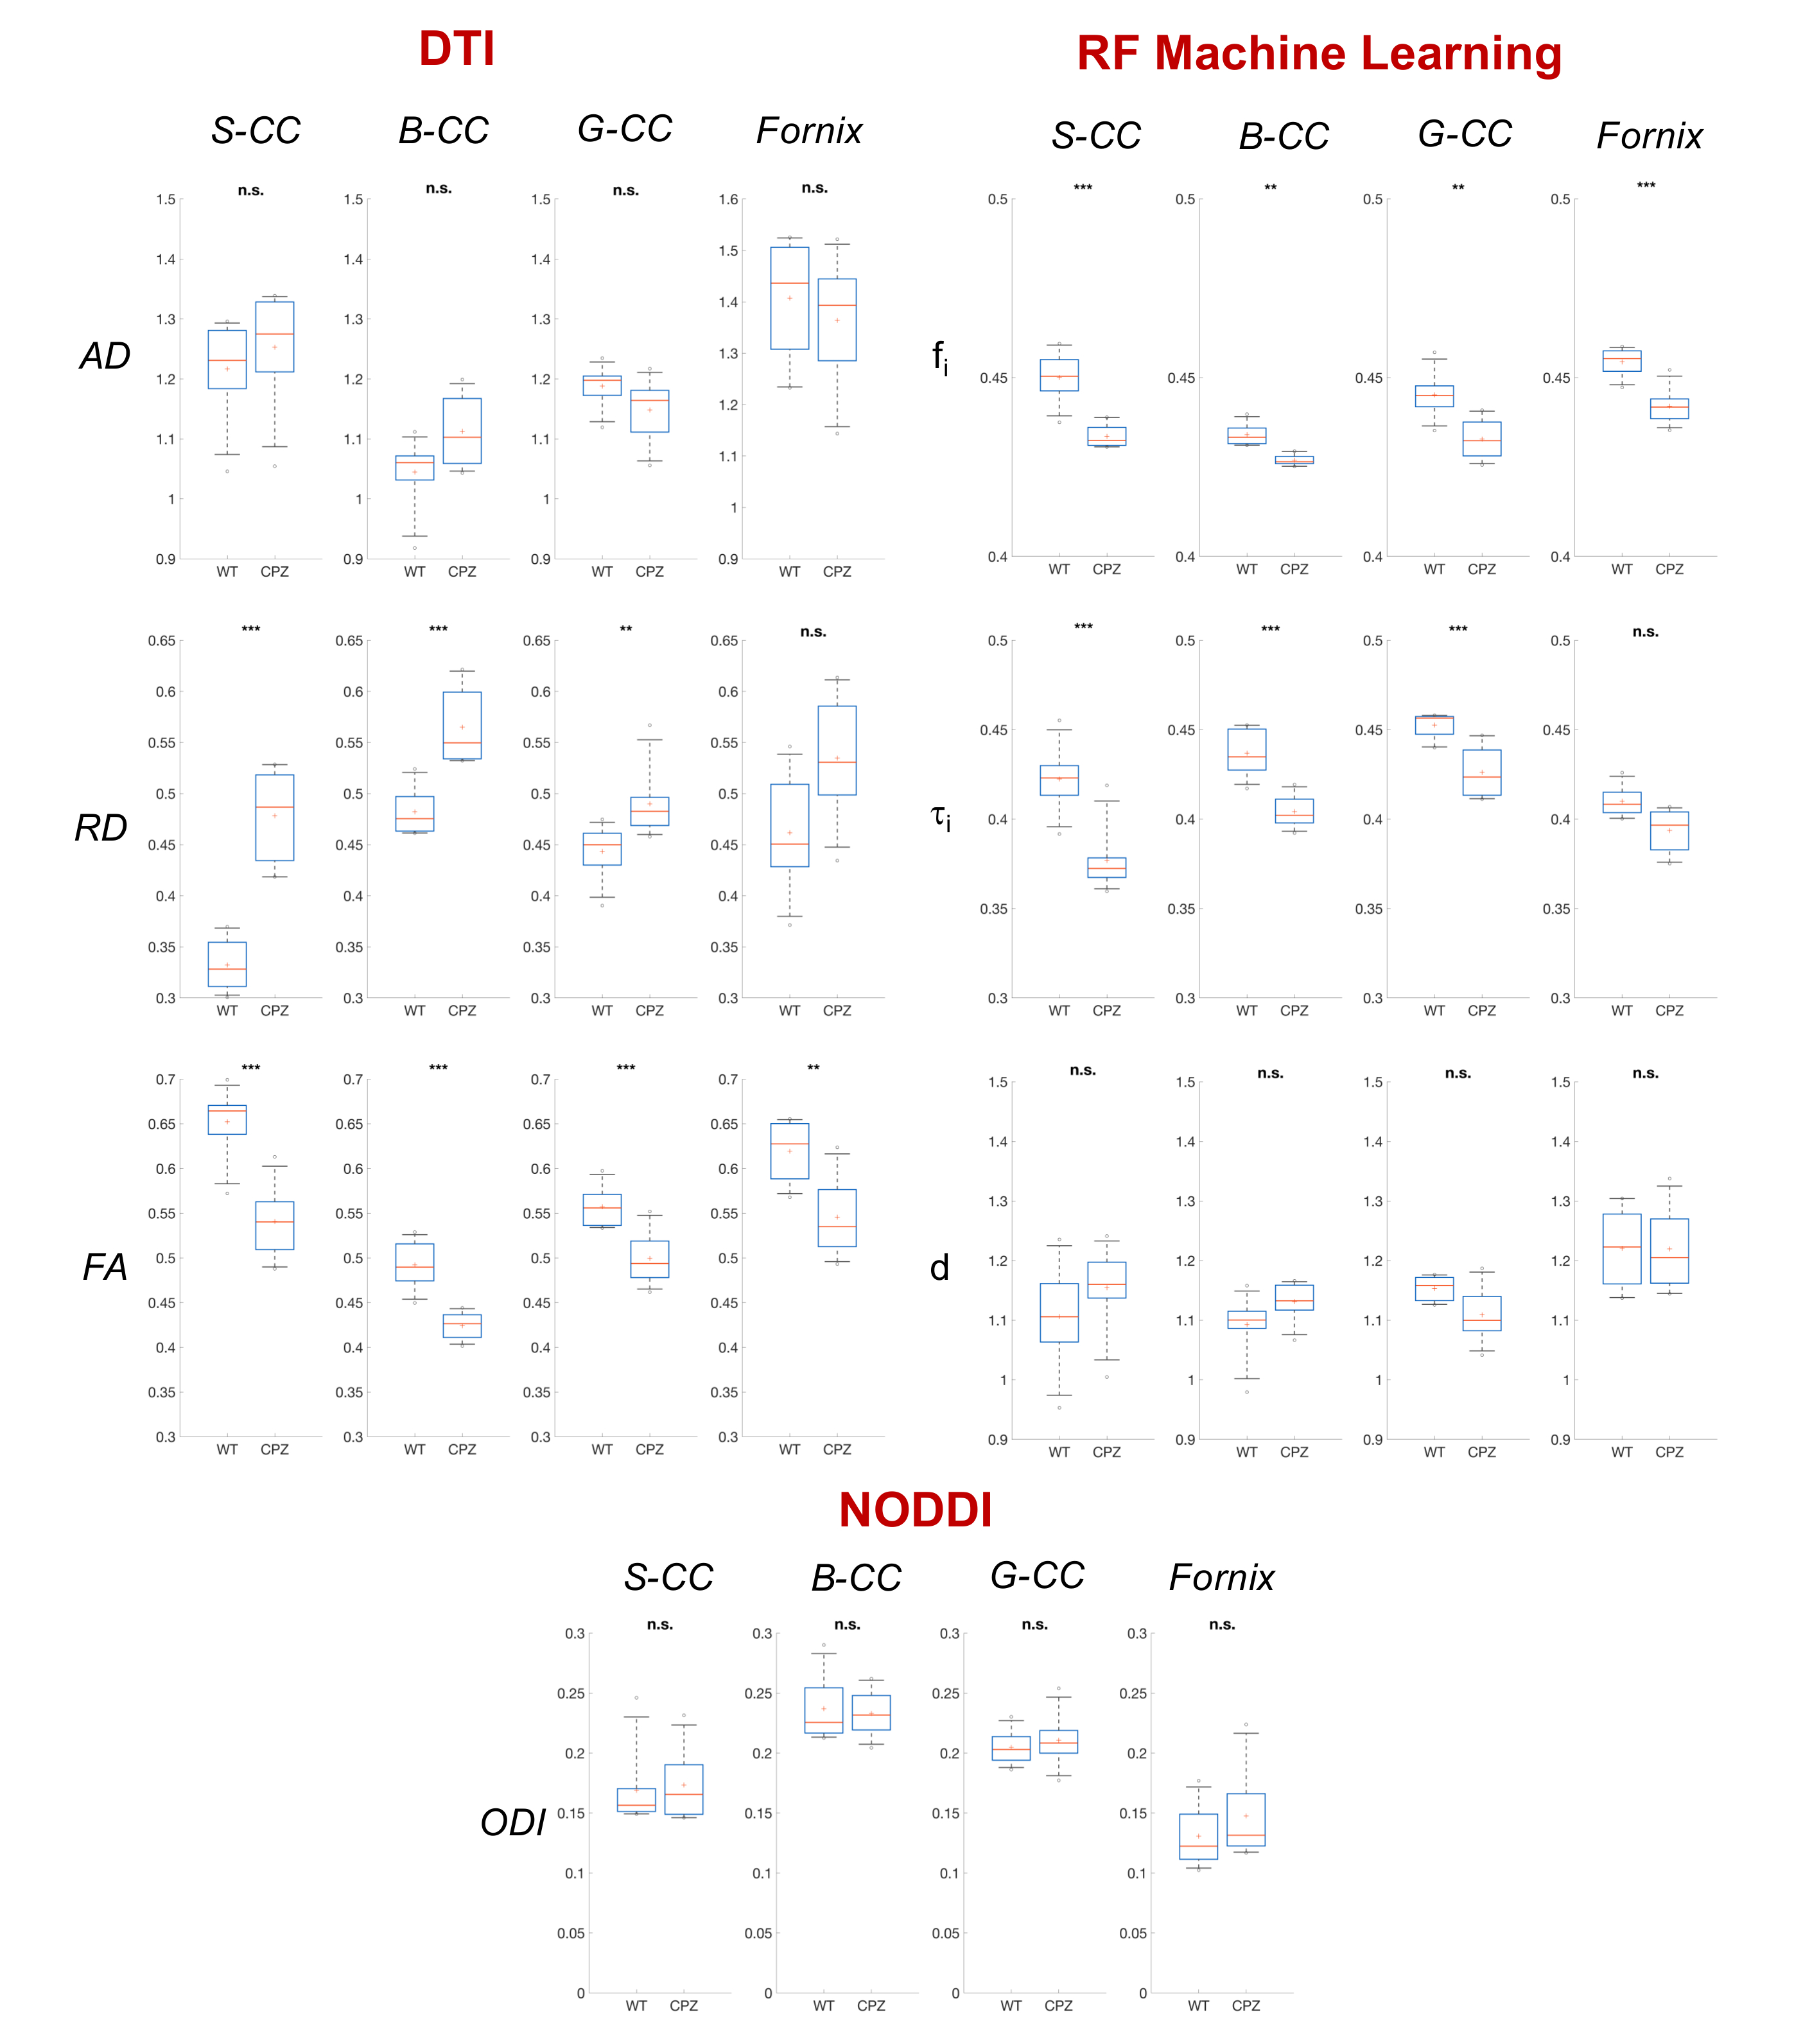
Machine Learning. We adapted the well-known RF regressor in the scikit-learn toolkit5 to learn the mapping between the microstructure parameters defining our simulation substrates and the normalized DW-MRI signal (Fig.1). The RF had decision trees/maximum depth=100/20. We trained the RF on simulated data using 11000 feature vectors (synthetic diffusion-weighted signals) through a greedy splitting process that constructs a linear mapping from the features to the corresponding ground truth parameters. The trained RF estimates fi, τi and d, which we tested on simulated data using 1500 previously unseen feature vectors and then applied on in-vivo data. We manually segmented the corpus callosum (CC) and Fornix and compared WT and CPZ mice estimates using 2-tailed t-test with equal variance.
Results
Data quality test. Fig.2A shows that our imaging protocol has good sensitivity to τi, with sufficient change in DW-MRI signal to provide reliable τi estimates for τi≤500 ms. Fig.2B shows an excellent match between the simulated and in-vivo diffusion-weighted signals, demonstrating that our training data set is a good representation of the in-vivo data.
Simulation data estimates. Testing shows strong correlations between RF estimates and the ground truth parameters (R2=0.86/0.94/0.88 for fi/τi/d respectively). A comprehensive sensitivity/accuracy analysis of the proposed method is the subject of another abstract that we submitted to this symposium.
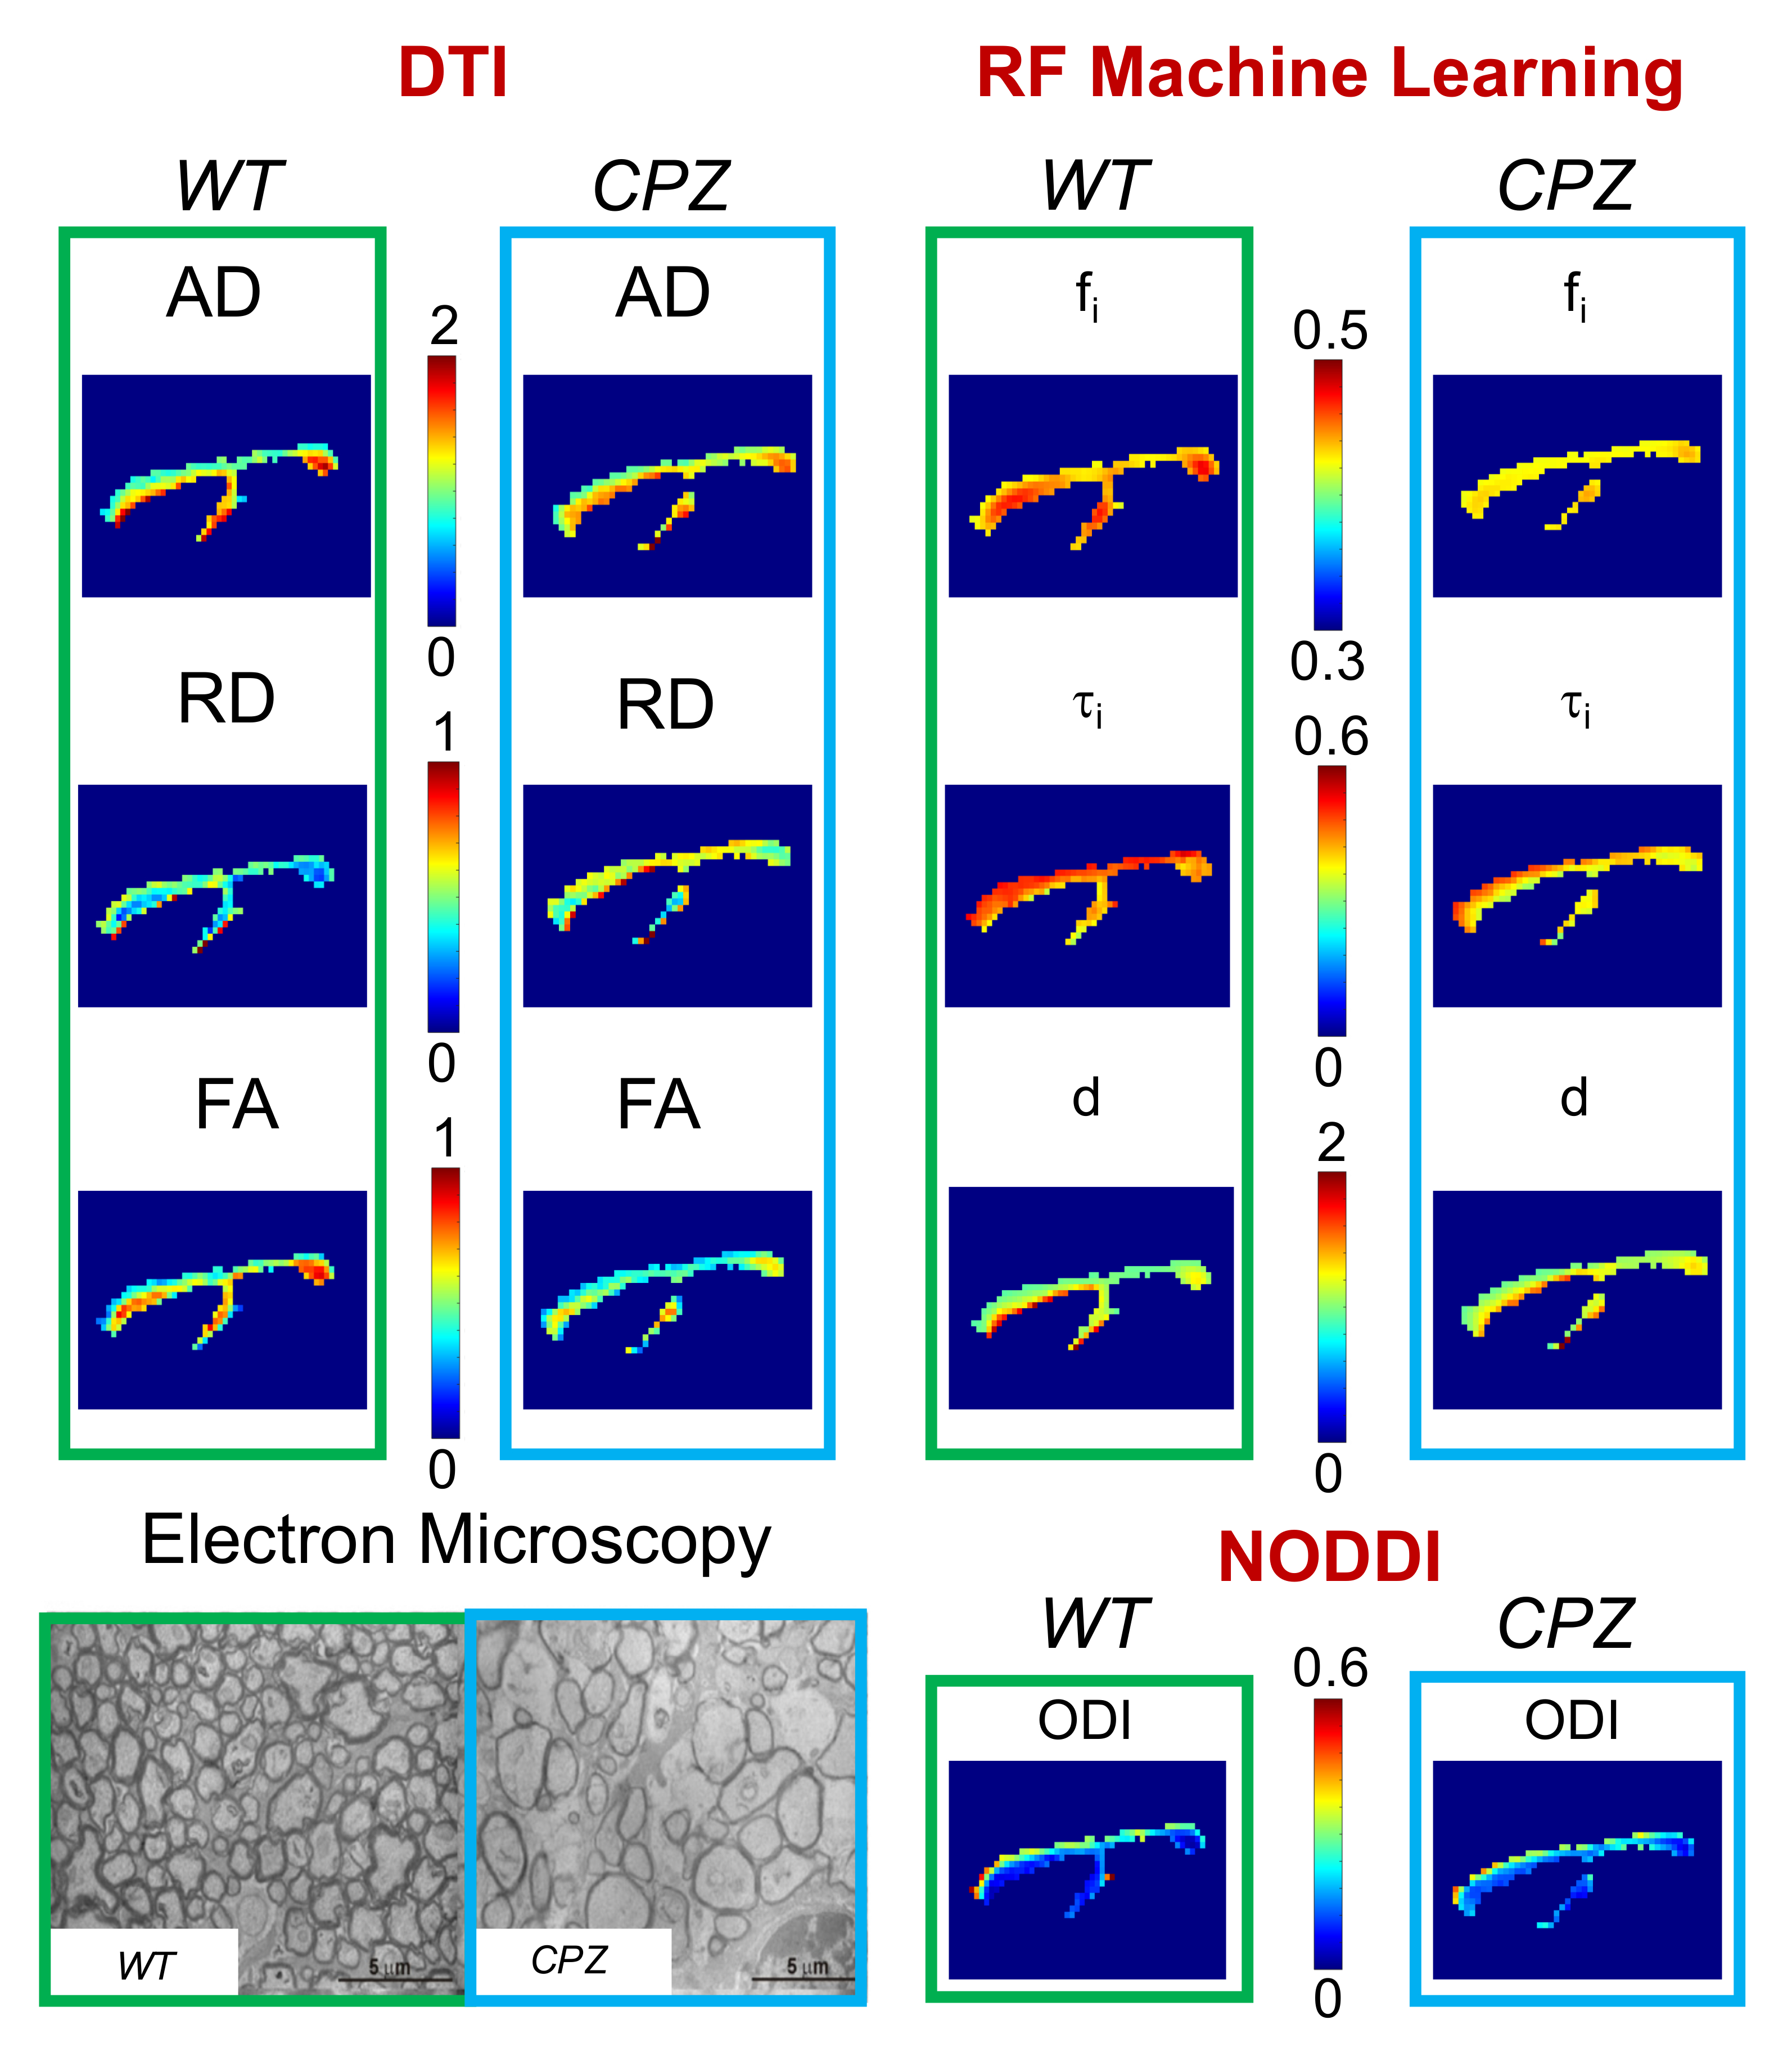
Machine Learning. Fig.3 shows parametric maps from the in-vivo data (WT versus CPZ) of conventional DTI, NODDI orientation-dispersion index (ODI) and using RF approach. RF estimates in CPZ mice show a statistical significant reduction in fi, and τi compared to WT (Fig.4). DTI shows reduction in FA and increase in RD, in agreement with6. ODI is not statistical different between the two groups (Fig.4). An electron microscopy image of CC is also reported to show the underpinning microstructural changes in the tissue: demyelination and partial axonal loss.
Discussion and Conclusion
Our analysis of DW-MRI from a well-known mouse model of WM demyelination (Fig.3,4) shows that machine learning approach allows an accurate and robust estimation of the expected changes in tissue-microstructure. While DTI gave only indirect information, our model found: 1) a decrease in fi as direct measure of partial axonal loss; 2) a decrease in τi as direct measure of axonal membrane permeability increase due to demyelination. Furthermore, our estimates show no bias due to fiber orientation dispersion, as shown by the negligible changes in ODI. Finally, our results match the expected tissue-microstructure changes (electron microscopy in Fig.3).
Standard methods for estimating permeability so far have been using the Karger model7, however in1 has been shown that machine learning approach works much better. Here we provide a clear validation of the machine learning approach introduced in1 affirming a wider potential of the approach as a mechanism to construct complex biophysical models for quantitative MRI.
Acknowledgements
This work was supported by EPSRC (EP/G007748, EP/I027084/01, EP/L022680/1, EP/M020533/1, N018702), EPSRC-funded UCL Centre for Doctoral Training in Medical Imaging (EP/L016478/1), Spinal Research, UK MS Society and NIHR Biomedical Research Centre at University College London Hospitals. The research leading to these results received funding from the programs 'Institut des neurosciences translationnelle' ANR-10-IAIHU-06 and 'Infrastructure d’avenir en Biologie Santé' ANR-11-INBS-0006.References
1 Nedjati-Gilani, G.L., Schneider, T., Hall, M.G., Cawley, N., Hill, I., Ciccarelli, O., Drobnjak, I., Wheeler-Kingshott, C.A.M.G., Alexander, D.C. : Machine learning based compartment models with permeability for white matter microstructure imaging, NeuroImage, http://dx.doi.org/10.1016/j.neuroimage.2017.02.013 (2017).
2 Zhang G, et al. NODDI: practical in vivo neurite orientation dispersion and density imaging of the human brain. Neuroimage 2012; 61 (4): 1000-1016.
3 Cook, P. A., Bai, Y., Nedjati-Gilani, S., Seunarine, K.K., Hall, M.G., Parker, G.J., Alexander, D.C. : Camino: Open-Source Diffusion-MRI Reconstruction and Processing, 14th Scientific Meeting of the International Society for Magnetic Resonance in Medicine, Seattle, WA, USA, p. 2759, May 2006.
4 Drobnjak, I., Zhang, H., Ianuş, A., Kaden, E., & Alexander, D. C.: PGSE, OGSE, and sensitivity to axon diameter in diffusion MRI: Insight from a simulation study. Magnetic resonance in medicine, 75 (2), 688-700 (2015)
5 Pedregosa, F., Varoquaux, G., Gramfort, A., Michel, V., Thirion, B., Grisel, O., Blondel, M., Prettenhofer, P., Weiss, R., Dubourg, V., Vanderplas, J., Passos, A., Cournapeau, D., Brucher, M., Perrot, M., Duchesnay, E.: Scikit-learn: Machine Learning in Python. JMLR 12, 2825-30 (2011).
6 Zhang, J., Jones, M. V., McMahon, M. T., Mori, S., Calabresi, P. A. : In vivo and ex vivo diffusion tensor imaging of cuprizone‐induced demyelination in the mouse corpus callosum. Magnetic resonance in medicine, 67(3), 750-759 (2012).
7 Karger, J., Pfeifer, H., Wilfried, H.: Principles and application of self-diffusion measurements by nuclear magnetic resonance. Adv Mag Res 12(1), 1-89 (1988)
Figures