0432
Automatic detection of cerebral microbleeds using Susceptibility-Weighted Imaging and a 3D deep residual network1The UC Berkeley-UCSF Graduate Program in Bioengineering, University of California, San Francisco, San Francisco, CA, United States, 2Department of Radiology and Biomedical Imaging, University of California, San Francisco, San Francisco, CA, United States
Synopsis
- In this abstract, a deep
residual neural network based approach that improves the automatic detection
and labeling of cerebral microbleeds by significantly reducing the number of false
positives compared to previously published algorithms is proposed. This
combined method removed 89% of false positives in the test patients with brain
tumors who had radiation-induce CMBs while losing only 3% of the true
microbleeds and has the potential to fully automate CMB detection.
Introduction
Cerebral microbleeds (CMBs) are small chronic brain hemorrhages1 are prevalent in various diseases such as cerebral amyloid angiopathy (CAA), stroke, neurodegenerative disorders, traumatic brain injury (TBI) and after radiation therapy for brain cancer.2,3 Although there is a growing interest in understanding their evolution, traditional detection and labeling techniques suffer from either intense manual labor or low detection accuracy and/or specificity with automated methods4,5. Among them, a computer-aided detection method previously developed in our group (referred to as the base method) can detect 86% CMBs using SWI volumetric images6. Despite its relatively high sensitivity, many structural mimics or false positives (FPs) are also regarded as CMBs by the program, lowering the practical value of this method. The goal of this study was to design a deep residual network7 to further distinguish true CMBs and FPs with high CMB detection sensitivity and specificity.Methods
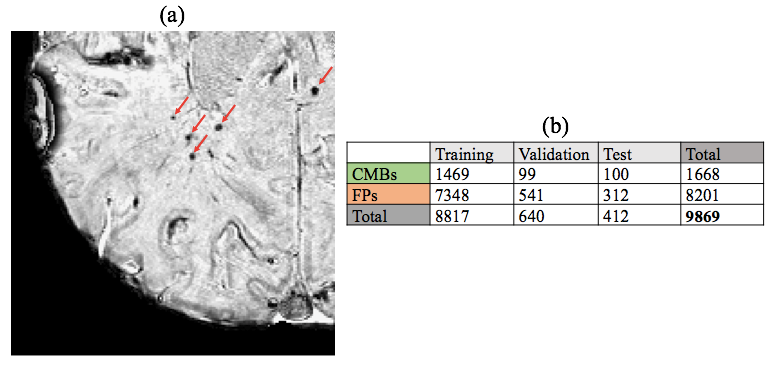
Subjects and Image Acquisition: Subjects consist of 49 patients with gliomas who received prior radiation therapy and later developed radiation-induced CMBs(Fig. 1(a)). All patients were scanned on a GE 7T scanner with an 8,16 or 32-channel coil using a standard SWI sequence (3D SPGR, TE/TR=16/50ms, FA=20°, resolution=0.47x0.47x2mm, matrix=512x512x40). 12 of these patients had data at multiple time points. The SWI images were reconstructed and processed using in house software6.
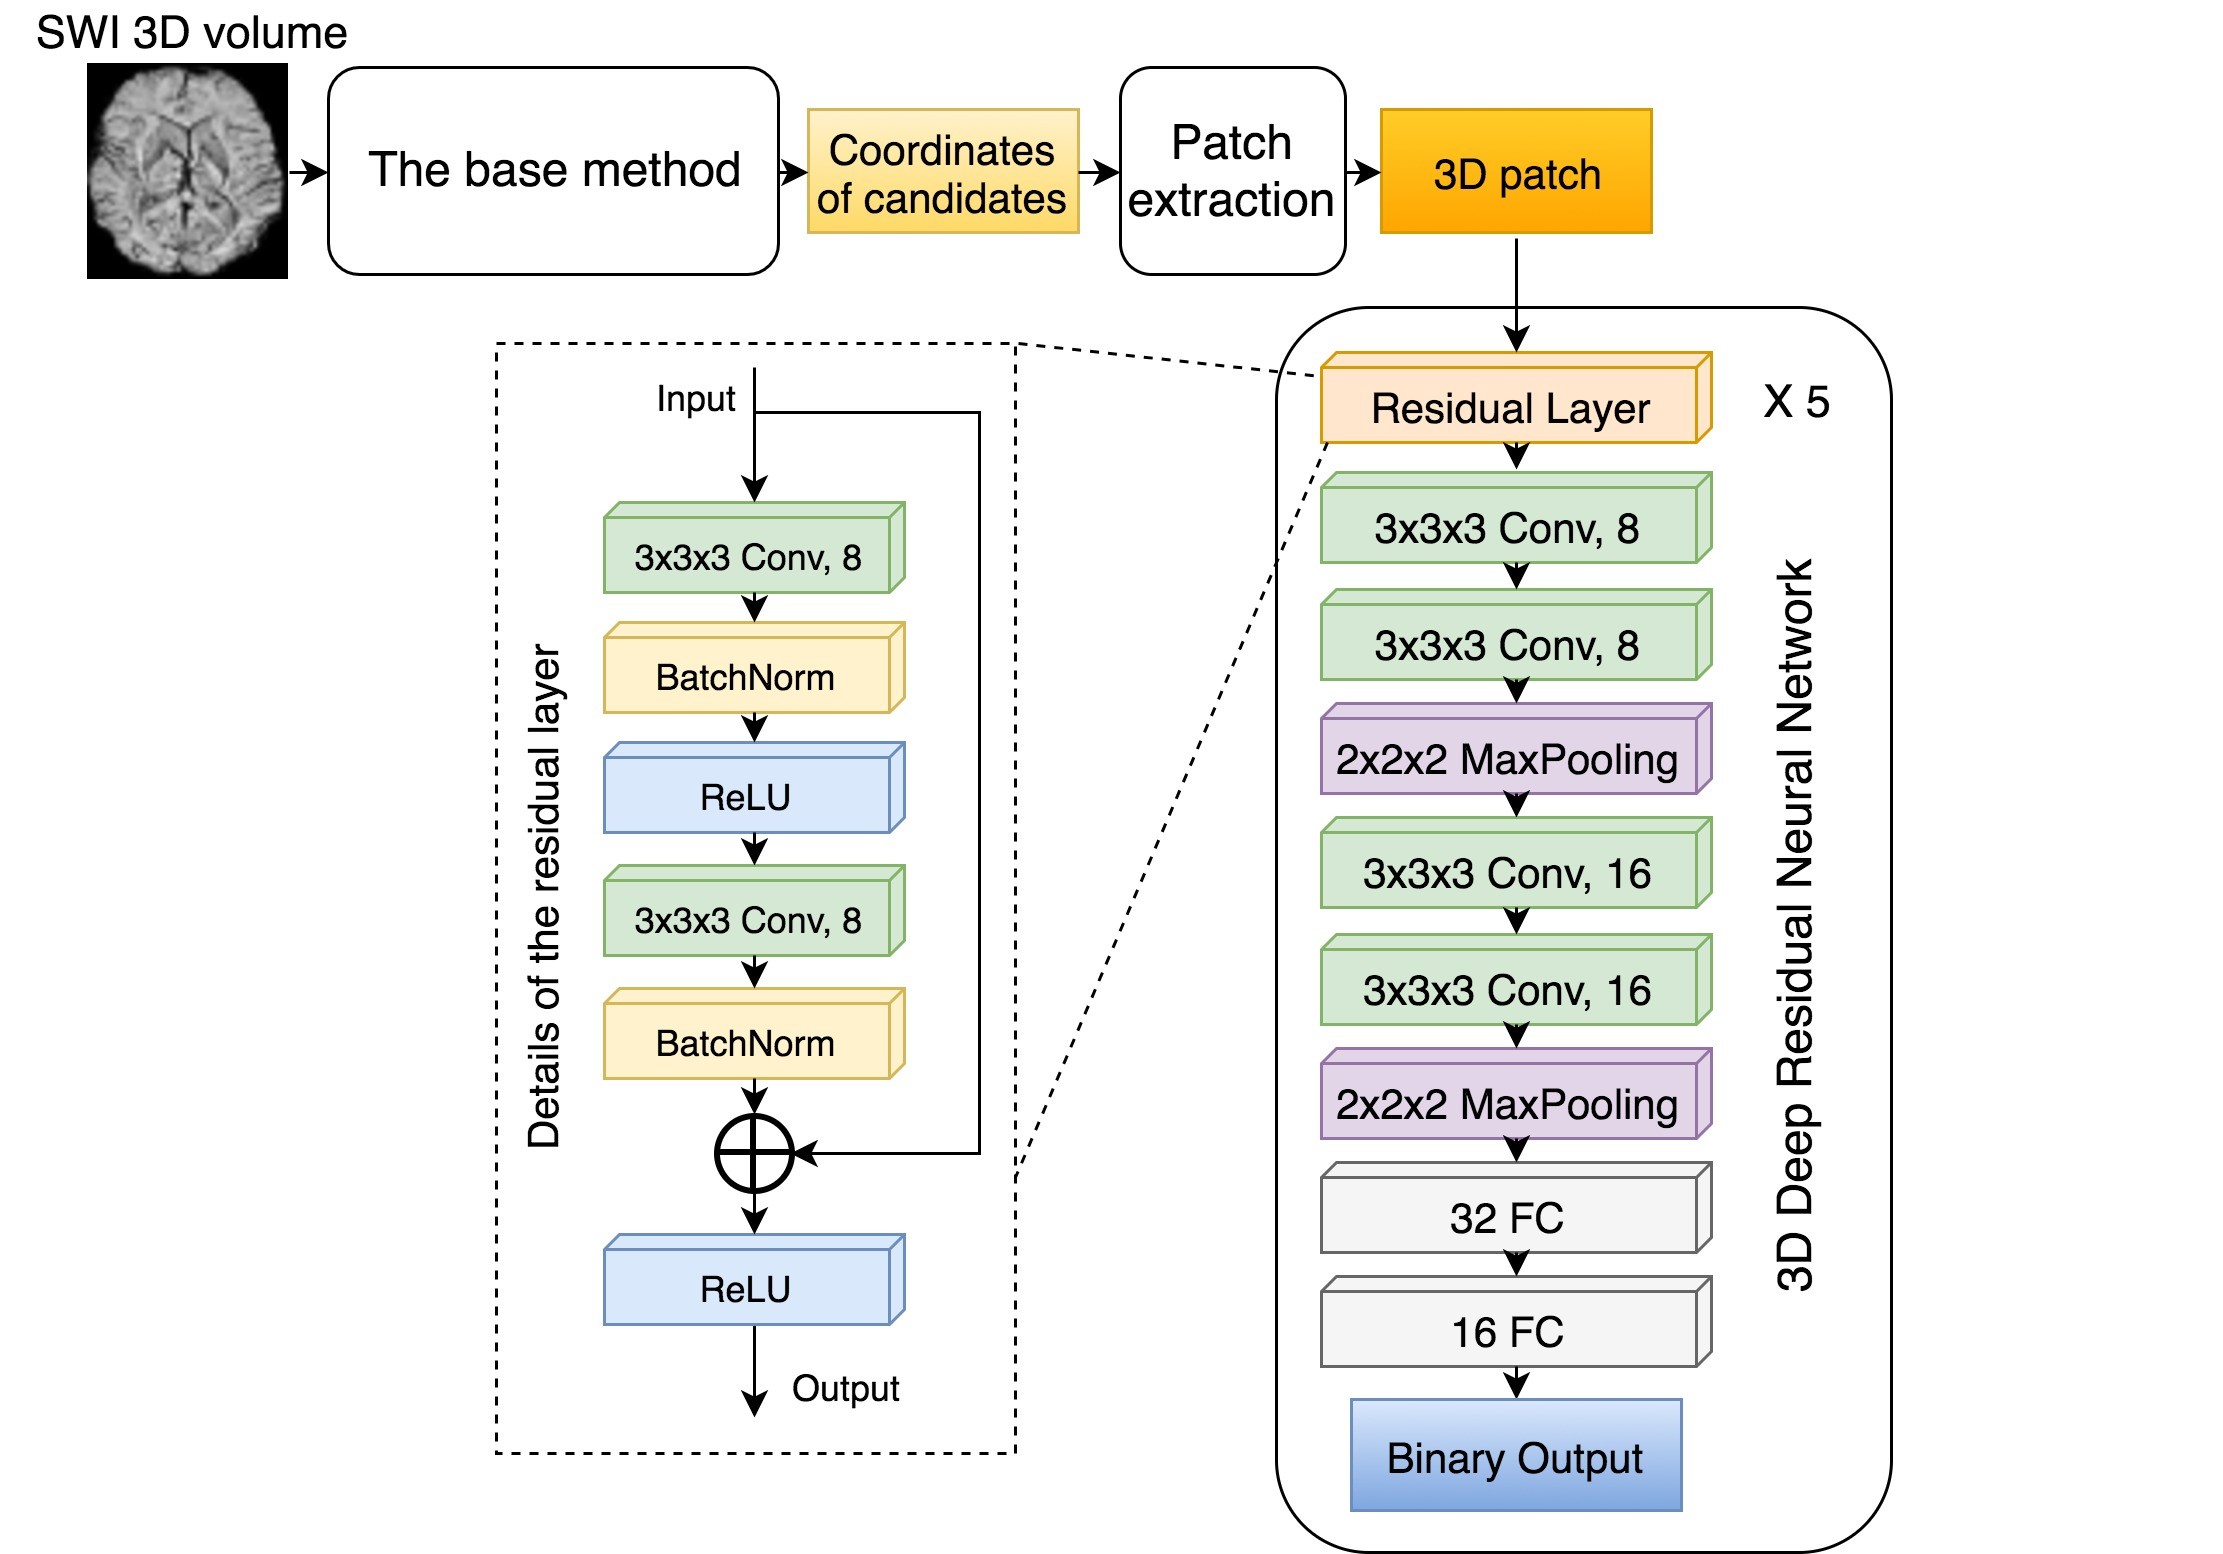
Model and Computational Framework: A 3D patch-based deep convolutional neural network with 5 residual layers, 2 conv-conv-maxpool layers, and 2 fully-connected layers for binary classification was constructed as described in Fig. 2. The total number of parameters was ~47,000. All model building, training, and experiments were implemented using Keras 2.0 (with Tensorflow 1.1 as backend). The model was trained and tested using a Linux workstation with Intel Core i7-6700K CPU, 32GB memory and a Nvidia GTX 1060 GPU.
Data: To acquire a labeled dataset to train the neural networks, an expert human rater inspected the output (coordinates of candidate CMBs/FPs) of the base method and classified them as true CMBs or FPs. These labeled coordinates were used to extract a dataset consisting of a 16x16x8 3D patch for each candidate CMB that was centered at the coordinates of the candidate CMB locations. (Fig. 1b)
Training and Testing: The data from 49 patients were split into 43 training, 4 validation and 2 test patients. Data augmentation techniques were adopted to reduce overfitting: shifting the patch by 1px at the axial plane and rotating the patch by a random angle around the z-axis. The model was trained for 200 epochs.
Misclassification Evaluation: To investigate the effect of human classification error and the performance of the model, a radiologist re-rated all candidates from the test datasets for their likelihood of being a true CMB (score 1-10).
Results & Discussion
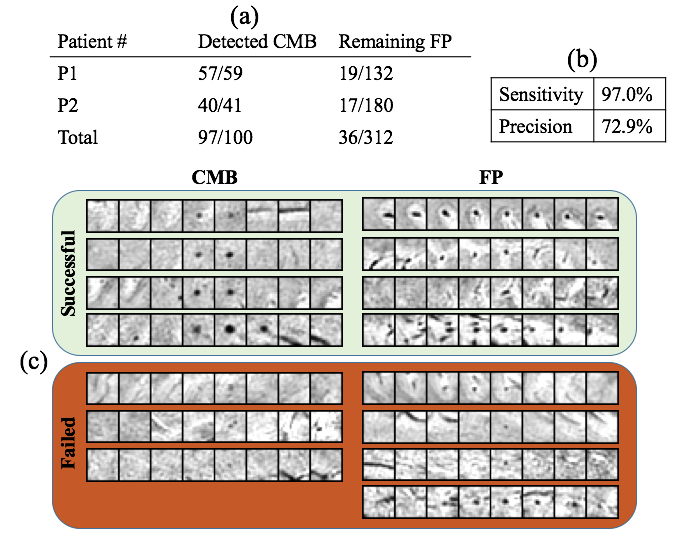
Fig. 3 shows the classification performance of the network on the test patients. The deep residual network we proposed successfully removed about 89% of false positives in the test patients while keeping most of the true microbleeds. The average sensitivity and precision of the network on the test patients was 97.0% and 72.9%. The number of false positives was reduced from 156 FP/patient to 18 FP/patient.
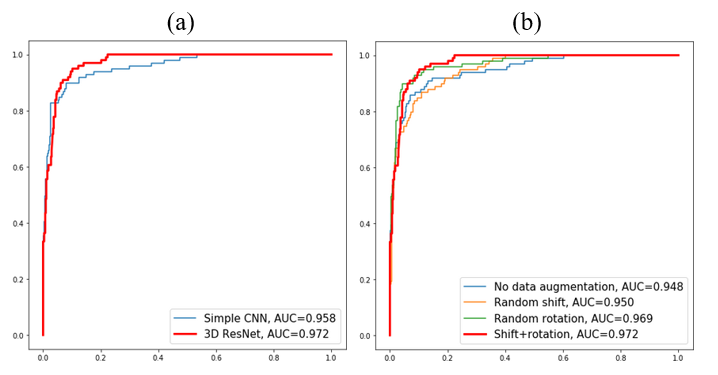
Residual Layers: Training and validation was also done on a convolutional neural network similar to the deep residual net in Fig. 2 with the residual layers removed. Fig. 4(a) demonstrates that the deep residual network performs better than the simple network. The additional residual layers enabled exploration and extraction of deeper features while preserving the ease of training.
Data Augmentation: Different strategies for data augmentation are assessed in Fig. 4(b), where a random rotation is more effective in improving performance than shifting the center and combining both techniques gives the highest AUC scores and best performance.
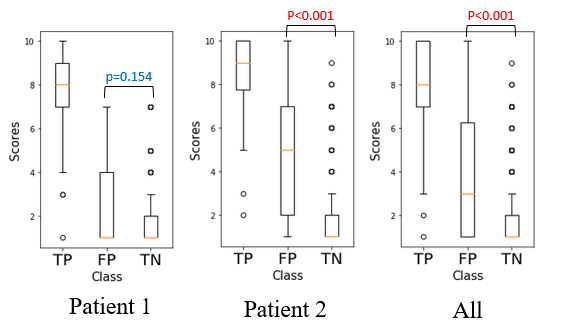
Misclassification Assessment: Fig. 5 shows the radiologist ranking of each CMB in the test data. A significantly higher score of remaining FPs was observed, suggesting that the remaining FPs misclassified by the network are actually more likely to be real CMBs than the ones that were successfully removed.
Conclusion
The proposed deep residual network greatly reduced the number of false positives from the base method and has the potential to fully automate CMB detection and labeling. Future directions include incorporating SWI data of different acquisition parameters and field strengths as well as studying the effect of incorporating quantitative susceptibility mapping (QSM) in training the network. Although we chose patients with radiation-induced CMBs as our cohort, the network itself can be easily extended to other disease-related CMBs by retraining the model or transfer learning.Acknowledgements
No acknowledgement found.References
1. Martinez-Ramirez, Sergi, Steven M. Greenberg, and Anand Viswanathan. "Cerebral microbleeds: overview and implications in cognitive impairment." Alzheimer's research & therapy 6.3 (2014): 33.
2. Lupo, Janine M., et al. "The effects of anti-angiogenic therapy on the formation of radiation-induced microbleeds in normal brain tissue of patients with glioma." Neuro-oncology 18.1 (2015): 87-95.
3. Makale, Milan T., et al. "Mechanisms of radiotherapy-associated cognitive disability in patients with brain tumours." Nature Reviews Neurology 13.1 (2017): 52-64.
4. Barnes, Samuel RS, et al. "Semiautomated detection of cerebral microbleeds in magnetic resonance images." Magnetic resonance imaging 29.6 (2011): 844-852.
5. Dou, Qi, et al. "Automatic detection of cerebral microbleeds from MR images via 3D convolutional neural networks." IEEE transactions on medical imaging 35.5 (2016): 1182-1195.
6. Bian, Wei, et al. "Computer-aided detection of radiation-induced cerebral microbleeds on susceptibility-weighted MR images." NeuroImage: clinical 2 (2013): 282-290.
7. He, Kaiming, et al. "Deep residual learning for image recognition." Proceedings of the IEEE conference on computer vision and pattern recognition. 2016.
Figures