0431
Automatic Assessment of MR Image Quality with Deep Learning1Center for Biomedical Imaging Research, Department of Biomedical Engineering, School of Medicine, Tsinghua University, Beijing, China, 2Vascular Imaging Laboratory, Department of Radiology, University of Washington, Seattle, WA, United States
Synopsis
In this study, we aimed to develop a convolutional neural network (CNN) to assess the quality of multi-contrast carotid plaque MR images automatically. The network was trained on large amount of plaque images combined with image quality scores labeled by experienced radiologists. Transfer learning was utilized to take the advantage of state-of-the-art CNN pre-trained on ImageNet dataset. The accuracy of image quality estimation achieved 86.0% with preprocessing and fine-tuning of the network.
Introduction
Plaque imaging is a powerful tool to detect vulnerable plaque, but it is also vulnerable to signal noise ratio (SNR) or artifacts caused by patient motion such as blood flow and swallowing. However, the image quality assessment is commonly performed before plaque image analysis, which is usually too late to have the patient with poor image quality rescanned. In this work, we explored the advanced CNN combining with transfer learning to assess the quality of multi-contrast plaque images automatically.Methods
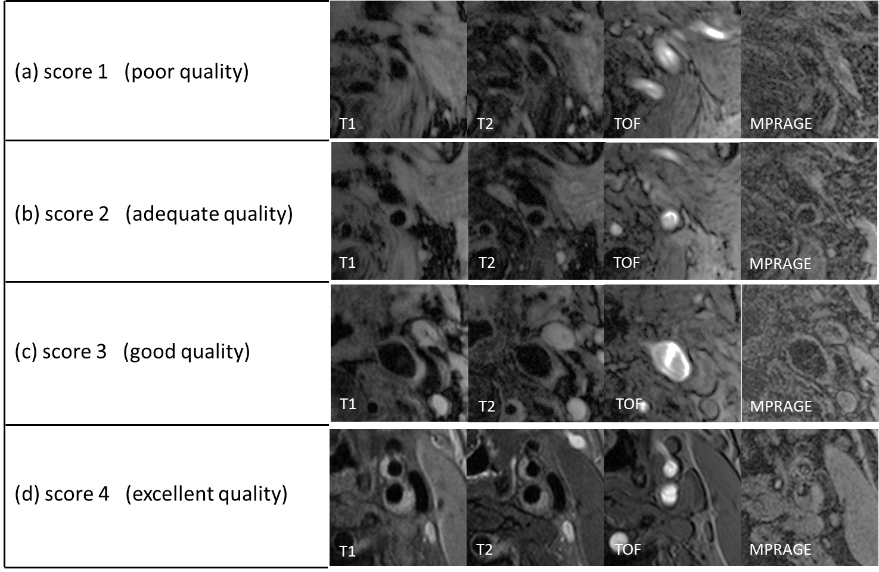
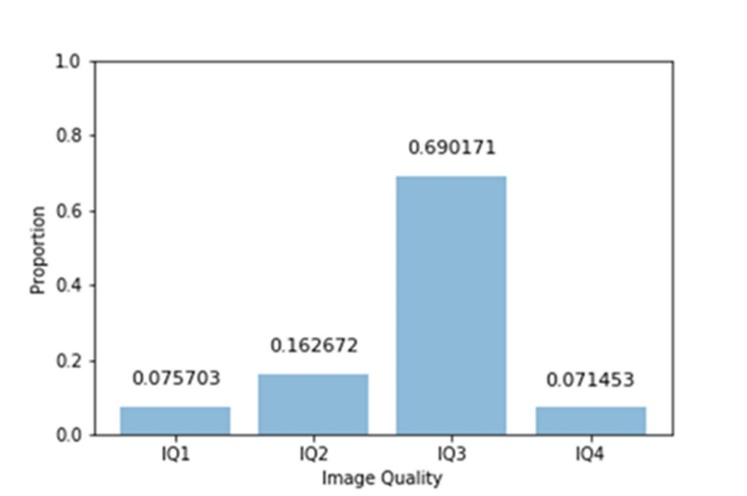
Our dataset consists of 1,292 carotids (10-16 locations per carotid, and totally 20,237 locations) from 646 patients. Each location has four contrasts1 (T1, T2, TOF and MPRAGE) with 512*512 in image size. All data were labeled by experienced radiologists with four-point scores (1-poor to 4-excellent) using CASCADE2 (Figure 1). 60% of the data were randomly selected as training data, 20% as validation data and 20% as test data. (Figure 2)
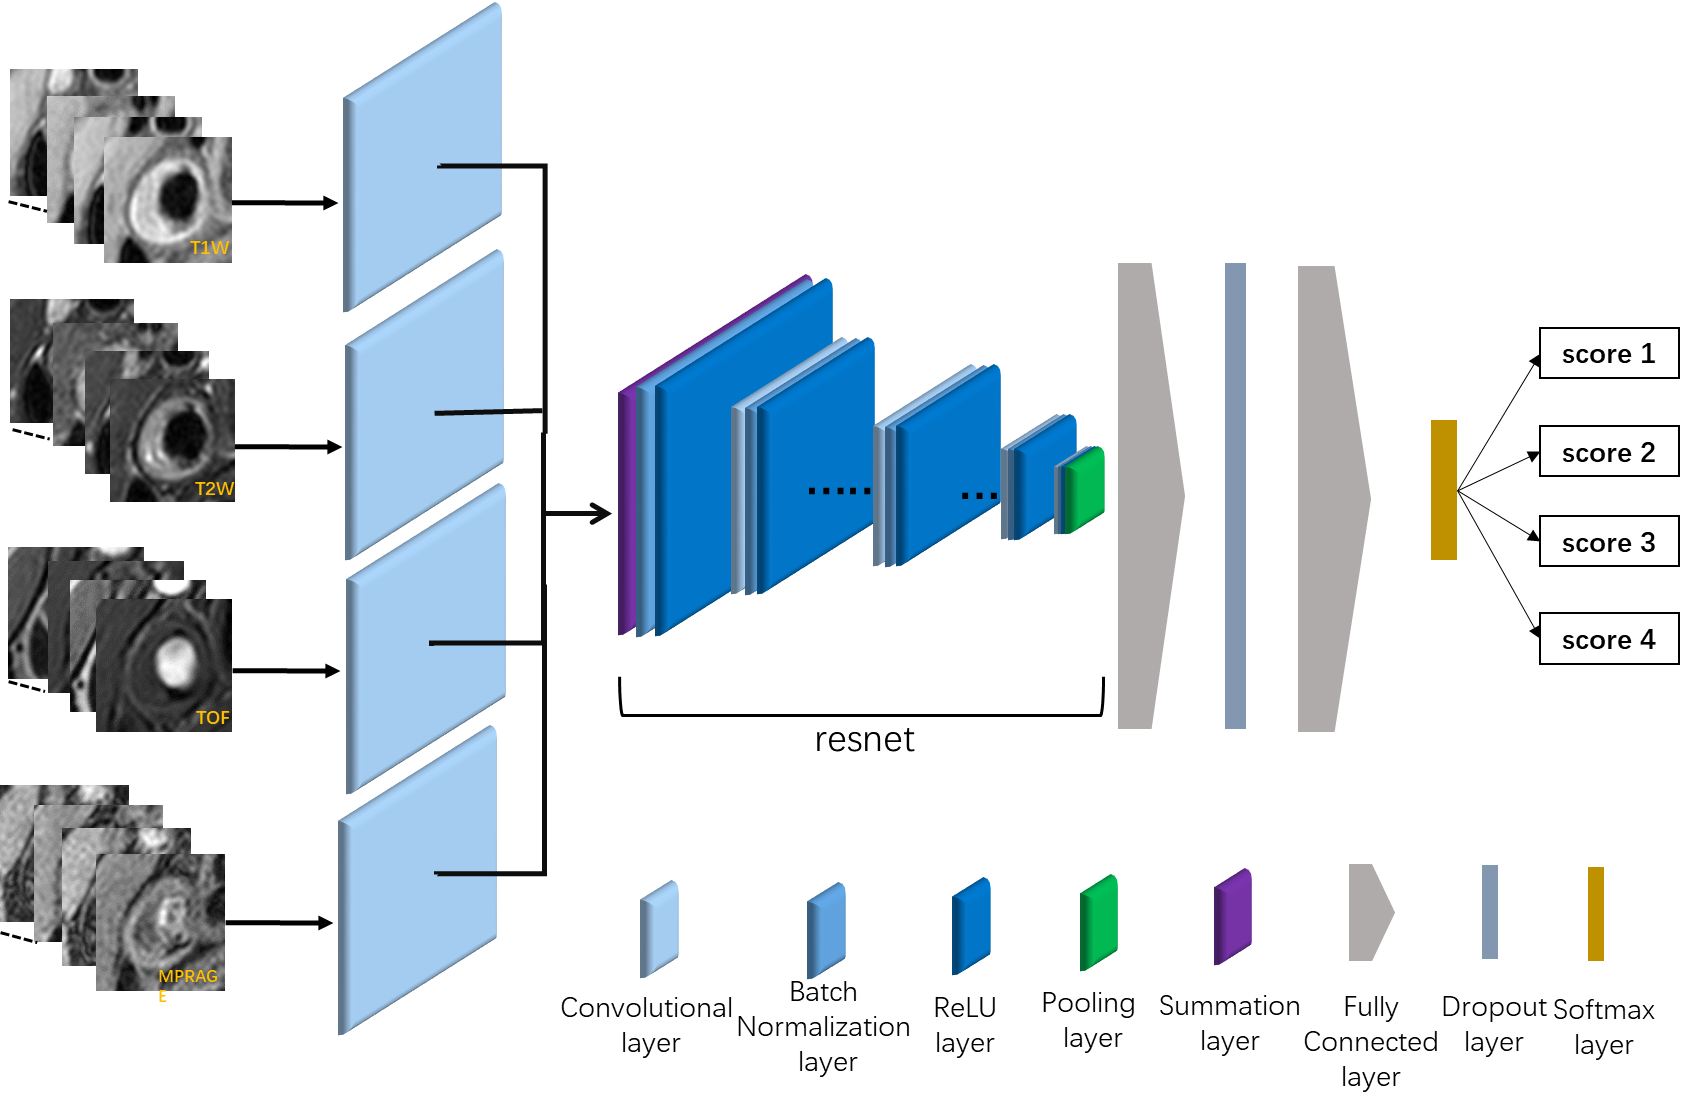
We formulated the problem of MR image quality assessment as a classification problem. The input of the network is four MRI contrast images, and the output is image quality score between 1-4 (Figure 3). The proposed CNN model is based on residual network3, which achieved the best results in ILSVRC20154 challenges. We fine-tuned the residual network with 50 layers pre-trained on ImageNet5 dataset to prevent over-fitting. The model could not be applied to multi-contrast MRI directly, since the original network took 3-channel RGB images as input and output a probability distribution of 1,000 classes. We made four copy of the first convolution layer in the original residual network and connected each MRI contrast with one copy, and then we merged the results of these four convolution layers by summation, and connected to the rest of the net. We reduced the number of output to four classes at output and introduced Dropout6 layer to avoid over-fitting. In addition, we flipped the image horizontally at 0.5 probability level and cropped the image randomly as data augmentation in the training procession, which further avoided over-fitting. Our modified model was trained and validated on the training and validation data set and tested on the test data set.
Results
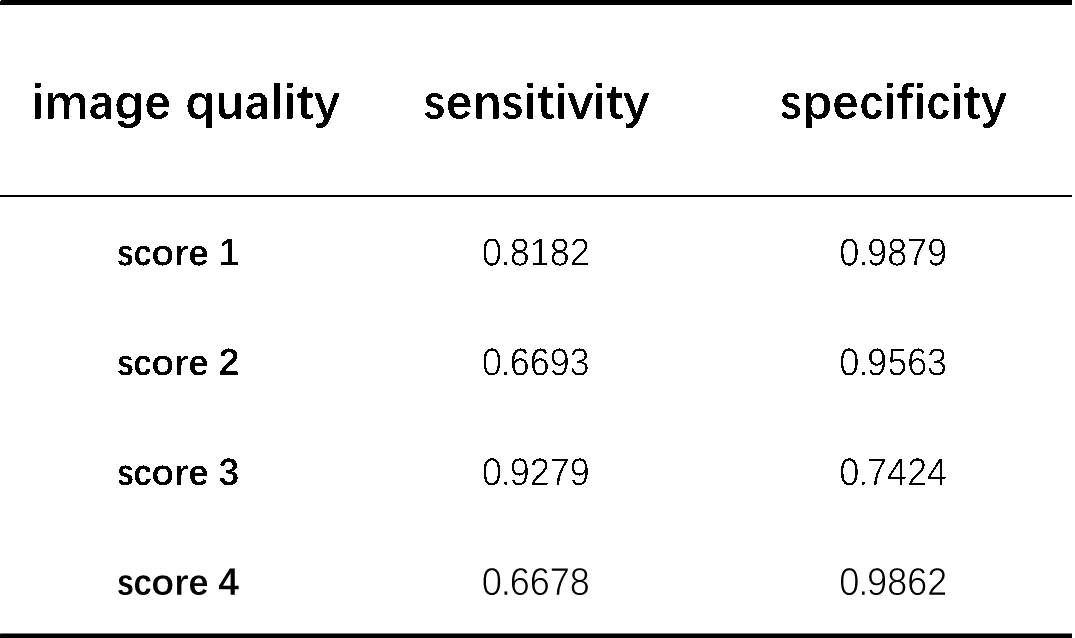
Figure 4 shows the classification results of CNN compared with radiologists on the test dataset, and the proposed modal achieved accuracy of 86.0%. Figure 5 shows the sensitivity and specificity for each quality score, which are all larger than 0.66. In particular, the sensitivity and specificity of poor image quality (score 1) are larger than 0.81.Discussion
In this work, we proposed an automatic algorithm for carotid plaque image quality assessment based on convolutional neural network (CNN). Because the images with poor quality (score 1) will be excluded in further analysis, it is crucial to classify poor quality images. The high sensitivity and specificity of poor image quality were achieved in proposed CNN. While the sensitivity and specificity of image in score 2 and 3 is low because it is also hard for reviewer to distinguish adequate and good image qualities.Conclusion
In this work, an automatic CNN-based assessment of MR image quality of carotid plaque has been implemented. Training and evaluation on a large-scale clinical data set shows good assessment performance. In future implementations, we will investigate the distinction between different MR sequences, artifact types and anatomic regions.Acknowledgements
No acknowledgement found.References
1. Yuan, C., et al., In Vivo Accuracy of Multispectral Magnetic Resonance Imaging for Identifying Lipid-Rich Necrotic Cores and Intraplaque Hemorrhage in Advanced Human Carotid Plaques. Circulation, 2001. 104(17): p. 2051-2056.
2. D Xu, WS Kerwin, T Saam, M Ferguson, and C Yuan. Cascade: Computer aided system for cardiovascular disease evaluation. In Proc ISMRM, page 1922, 2004.
3. He K, Zhang X, Ren S, et al. Deep Residual Learning for Image Recognition[J]. Computer Science, 2015.
4. Russakovsky O, Deng J, Su H, et al. ImageNet Large Scale Visual Recognition Challenge[J]. International Journal of Computer Vision, 2015, 115(3):211-252.
5. Krizhevsky A, Sutskever I, Hinton G E. ImageNet Classification with Deep Convolutional Neural Networks[J]. Advances in Neural Information Processing Systems, 2012, 25(2):2012.
6. Srivastava, N., Hinton, G. E., Krizhevsky, A., Sutskever, I. & Salakhutdinov, R. Dropout?: A Simple Way to Prevent Neural Networks from Overfitting. J. Mach. Learn. Res. 15, 1929–1958 (2014).
Figures