0426
Disrupted Cortical and Subcortical Effective Connectivity in Early Parkinson’s Disease (PD): Insights from Parkinson’s Progressive Markers Initiative (PPMI) dataset1Cleveland Clinic Lou Ruvo Center for Brain Health, Las Vegas, NV, United States, 2University of Colorado Boulder, Boulder, CO, United States
Synopsis
This study utilized resting-state fMRI data to evaluate effective (directional) connectivity in newly diagnosed unmedicated patients with early PD to derive a comprehensive picture of the nature of cortico–striatal–thalamic loop connectivity in PD. We found decreased effective connectivity between the key areas in the cortico–striatal–thalamic loops in unmedicated early stage PD patients . These results were mostly lateralized to the hemisphere opposite the predominant side of parkinsonian symtoms. The findings of this study are mainly important, given the fact that, looking at changes in effective connectivity and its relation to different disease related factors may help us better understand the heterogeneity of PD and more accurately target therapeutic interventions (i.e. deep brain stimulation).
Introduction
Parkinson’s disease is a progressive neurodegenerative disorder characterized by both motor and non-motor dysfunction. Classical accounts of the pathophysiology of PD have emphasized disrupted functional connectivity of cortico–striatal–thalamic loops due to the loss of dopaminergic cells in the substantia nigra pars compacta (SNc) [1-4]. While disrupted connectivity in the cortico–striatal–thalamic loops may be an explanatory model for PD, effective (directed) connectivity, the causal influence of a brain area on another, has not yet been elucidated. This study utilizes resting fMRI to evaluate effective connectivity in newly diagnosed medication naïve patients with PD. Ultimately, a better understanding of effective connectivity will help derive a comprehensive picture of the nature of cortico–striatal–thalamic loop connectivity in PD.Methods
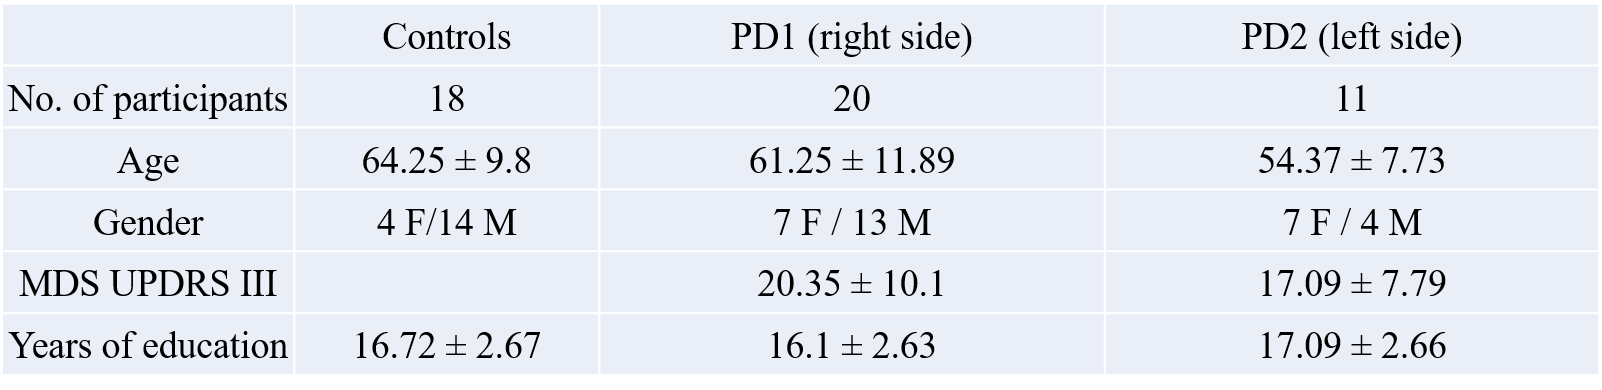
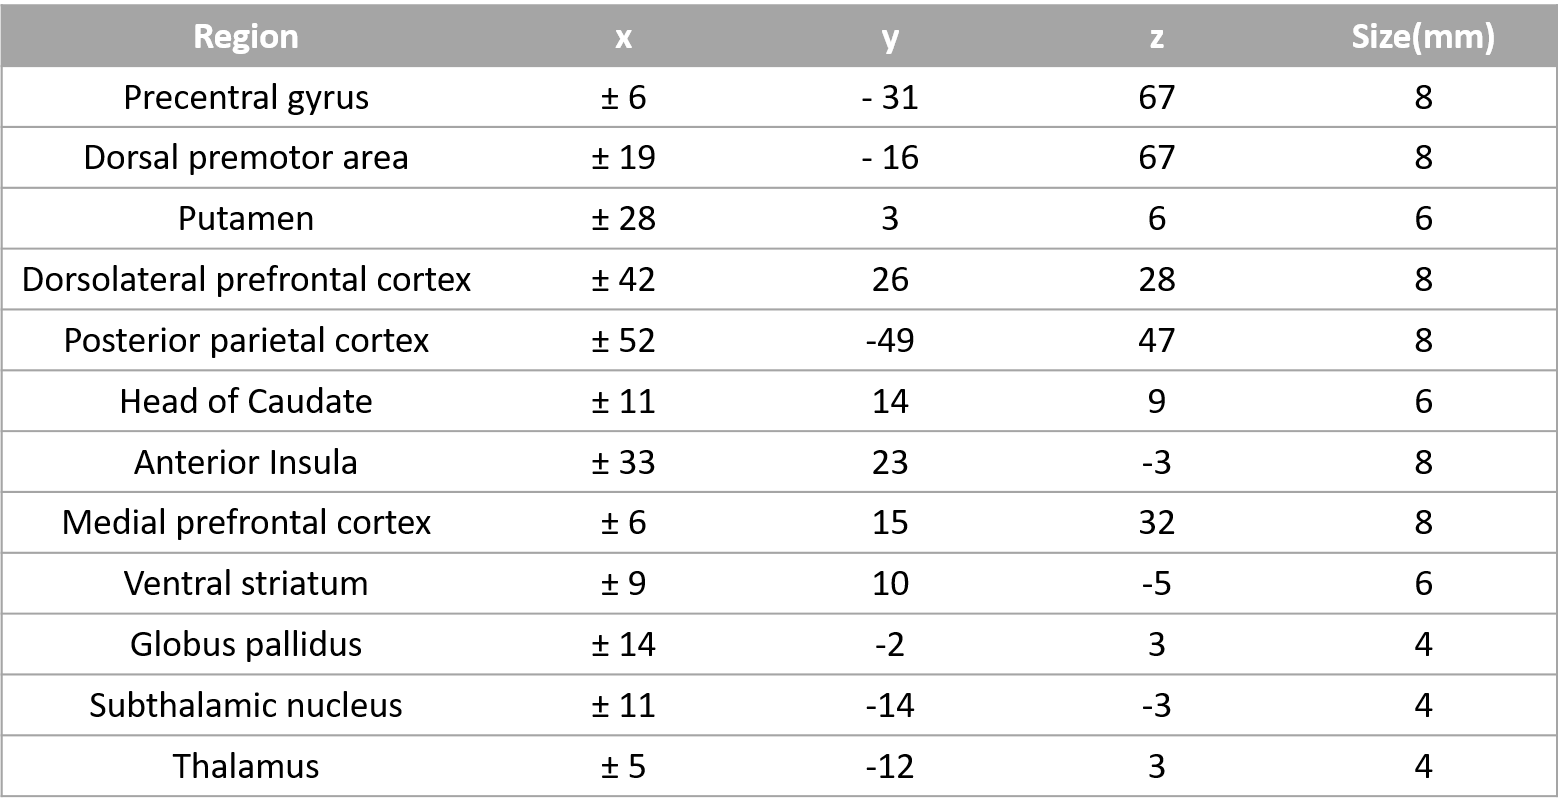
The data used in the preparation of this article were obtained from the Parkinson’s Progression Markers Initiative (PPMI) database (www.ppmi-info.org/data). Functional-MRI data for 18 healthy controls and 31 medication naïve early PD-subjects were obtained from the PPMI database (see Table 1 for demographics). Patients were further grouped depending on the predominantly affected side (PD1, right side [n=20]; PD2, left side [n=11]). Imaging parameters are described in detail at http://www.ppmi-info.org/. After standard preprocessing, mean time series were obtained from 12 bilateral regions of interest (ROIs). Spherical regions of interest were drawn in the following regions: the precentral sulcus, dorsal premotor area and the dorsal caudal putamen, dorsolateral prefrontal cortex, posterior parietal cortex, head of caudate, anterior insula, dorsal anterior cingulate cortex, medial prefrontal cortex, ventral striatum, globus pallidus internus, the subthalamic nucleus and the anterior thalamus (see Table 2 for coordinates) [5]. Mean time series were extracted from 26 different ROIs for all participants. The extracted time series were normalized and the hemodynamic response de-convolved [6] to get the underlying neuronal response, which were input into the multivariate autoregressive model (MVAR) [7,8] and connectivity matrices were obtained for all the PD and control participants. Then, two sample t-tests with age, gender and years of education as regressors was performed on the connectivities between the controls and PD1 and the controls and PD2 group to examine the paths which were significantly different between the groups (p<0.01).Results
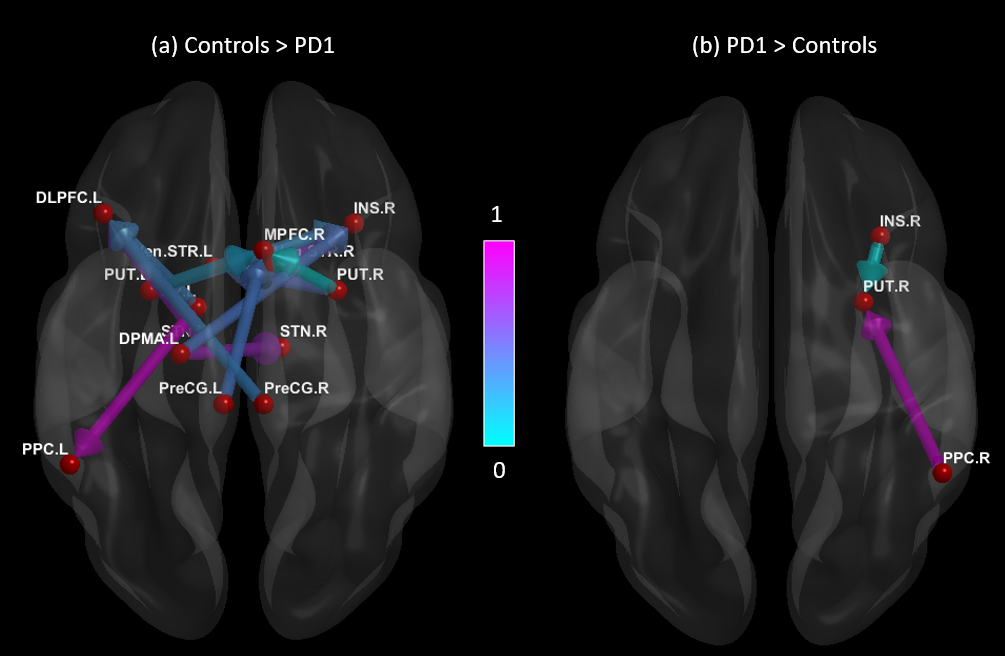
Figures 1 and 2 show significant path differences between the controls and the PD1; and the PD2 groups, respectively. Results were visualized with the BrainNet Viewer (http://www.nitrc.org/projects/bnv/) [9]. We found that healthy controls (HC) showed stronger connections originating from several regions (including the putamen, dorsolateral premotor area, and globus pallidus) which projected to the dorsolateral and medial prefrontal cortex, subthalamic nucleus and other regions (Fig.1a). The PD1 group showed stronger connections originating from the insula and posterior parietal cortex which projected to the putamen (Fig.1b). Connections originating from ventral striatum, posterior parietal cortex and putamen projecting to the medial prefrontal cortex and subthalamic nucleus were greater in HC compared to the PD2 group (Fig.2a). Connectivity from medial prefrontal cortex to globus pallidus was increased in PD2 group (Fig. 2b).Discussion
The findings of this study can be summarized as follows: 1) There was significantly weaker causal relation between key areas in the cortico–striatal–thalamic loops (e.g., R.PUT to R.STN; R. DLPFC toR.STN) in participants with early PD relative to typical controls. 2) The results were mostly lateralized to the hemisphere opposite the predominant side of parkinsonian symtoms. 3) Predominance of symptoms in different sides in PD is associated with different loop disruptions in the brain, which may be important in establishing the underlying networks for different symptoms of PD, such as cognition, which may be lateralized in the brain. Also, these results are consistent with previous work showing a significant decrease in connectivity in the PD group [4].Conclusion
Effective connectivity in medication naïve early stage PD patients mostly revealed decreased connectivity between the key areas in the cortico–striatal–thalamic loops. Our results expand upon prior investigations in that 1) we see an overall functional connectivity reduction, 2) connectivity is impaired within and between the cortical and subcortical regions, and 3) these differences are evident in newly diagnosed medication naïve PD patients from a multi-site cohort. The findings of this study are mainly important, given the fact that, looking at changes in effective connectivity and its relation to different disease related factors may help us better understand the heterogeneity of PD and more accurately target therapeutic interventions (i.e. deep brain stimulation).Acknowledgements
This study was partially supported by the NIH COBRE grant 1P20GM109025-01A1. The Michael J. Fox Foundation supports the PPMI study for Parkinson’s Research. Other funding partners include a consortium of industry players, non-profit organizations and private individuals.References
[1] Braak H, Del Tredici K, Rub U, de Vos RA, Jansen Steur EN, Braak E. Staging of brain pathology related to sporadic Parkinson’s disease. Neurobiol Aging. 2003;24(2):197–211.
[2] Hodaie M, Neimat JS, Lozano AM. The dopaminergic nigrostriatal system and Parkinson’s disease: molecular events in development, disease, and cell death, and new therapeutic strategies. Neurosurgery. 2007;60(1):17–28. discussion 28–30.
[3] Jankovic J. Parkinson’s disease: clinical features and diagnosis. J Neurol Neurosurg Psychiatry 2008; 79: 368–76
[4] Hacker CD, Perlmutter JS, Criswell SR, Ances BM and Snyder AZ. Resting state functional connectivity of the striatum in Parkinson’s disease. Brain. 2012 Dec;135(Pt 12):3699-711.
[5] Shine JM, Matar E, Ward PB, Bolitho SJ, Gilat M, Pearson M, Naismith SL, Lewis SJ. Exploring the cortical and subcortical functional magnetic resonance imaging changes associated with freezing in Parkinson's disease. Brain. 2013 Apr;136(Pt 4):1204-15.
[6] Wu GR, Liao W, Stramaglia S, Ding JR, Chen H, Marinazzo D. A blind deconvolution approach to recover effective connectivity brain networks from resting state fMRI data. Med Image Anal. 2013 Apr;17(3):365-74.
[7] Grant MM, Wood K, Sreenivasan K, Wheelock M, White D, Thomas J, Knight DC, Deshpande G. Influence of early life stress on intra- and extra-amygdaloid causal connectivity. Neuropsychopharmacology. 2015 Jun;40(7):1782-93.
[8] Sreenivasan K, Zhuang X, Banks SJ, Mishra V, Yang Z, Deshpande G, Cordes D. Olfactory Network Differences in Master Sommeliers: Connectivity Analysis Using Granger Causality and Graph Theoretical Approach. Brain Connect. 2017 Mar;7(2):123-136.
[9] Xia M, Wang J, He Y (2013) BrainNet Viewer: A Network Visualization Tool for Human Brain Connectomics. PLoS ONE 8(7): e68910. doi:10.1371/journal.pone.0068910
Figures