0425
Fractional Anisotropy Within the Subthalamic Nucleus: An Imaging Biomarker for Early Parkinson’s Disease? A High-Resolution 7Tesla Magnetic Resonance Imaging Study1Center for Magnetic Resonance Research, University of Minnesota, Minneapolis, MN, United States, 2Neurology, University of Minnesota, Minneapolis, MN, United States
Synopsis
In this study, we used high-resolution 7Tesla MRI to study whether subthalamic nucleus (STN) characteristics, such as volume and fractional anisotropy (FA), can be used as a biomarker for Parkinson’s Disease (PD). 7Tesla MRI data were acquired for twenty-nine PD patients and twenty-one controls. Right STN volume was significantly lower in PD patients and it was negatively correlated with the UPDRS motor score. The PD group also had significantly decreased FA values in bilateral STN. To our knowledge, this is the first study to report differences in volume and FA of the STN between people with PD and controls.
Introduction
Parkinson’s Disease (PD) is a neurodegenerative disorder characterized by the loss of dopaminergic cells within the substantia nigra pars compacta. As the second most prevalent neurodegenerative disorder after Alzeihmer’s disease, PD impacts the life of millions of people worldwide1. The search for imaging biomarkers has predominantly been focused on measures of the substantia nigra (SN). The results of structural MRI and diffusion imaging have been mixed, and sometimes contradictory2-8. Therefore, it is not clear whether the SN can be used as a MR imaging biomarker. Comparatively few studies have investigated the subthalamic nucleus (STN). One study found a reduction in the volume of the STN in patients with PD with advanced disease9 while others found no differences between those with PD and controls10. The STN is a small basal ganglia structure that is difficult to visualize using a common MRI scanner (1.5T or 3T), it varies a lot in shape, size and orientation between individuals11. Most researchers only have access to “one-size-fit-all” templates, which is a particularly inadequate model for small and varying structures, such as the STN. This could explain why no study has reported fractional anisotropy (FA) differences between PD patients and controls within the structure. Ultra-high-field MRI enables viewing the boundaries of the STN11-13, thus, enabling analysis at the individual level possible11,14. In this study, we used high-resolution 7Tesla (7T) MRI to study whether characteristics of the STN, such as its volume and FA can be used as a biomarker for PD.Methods
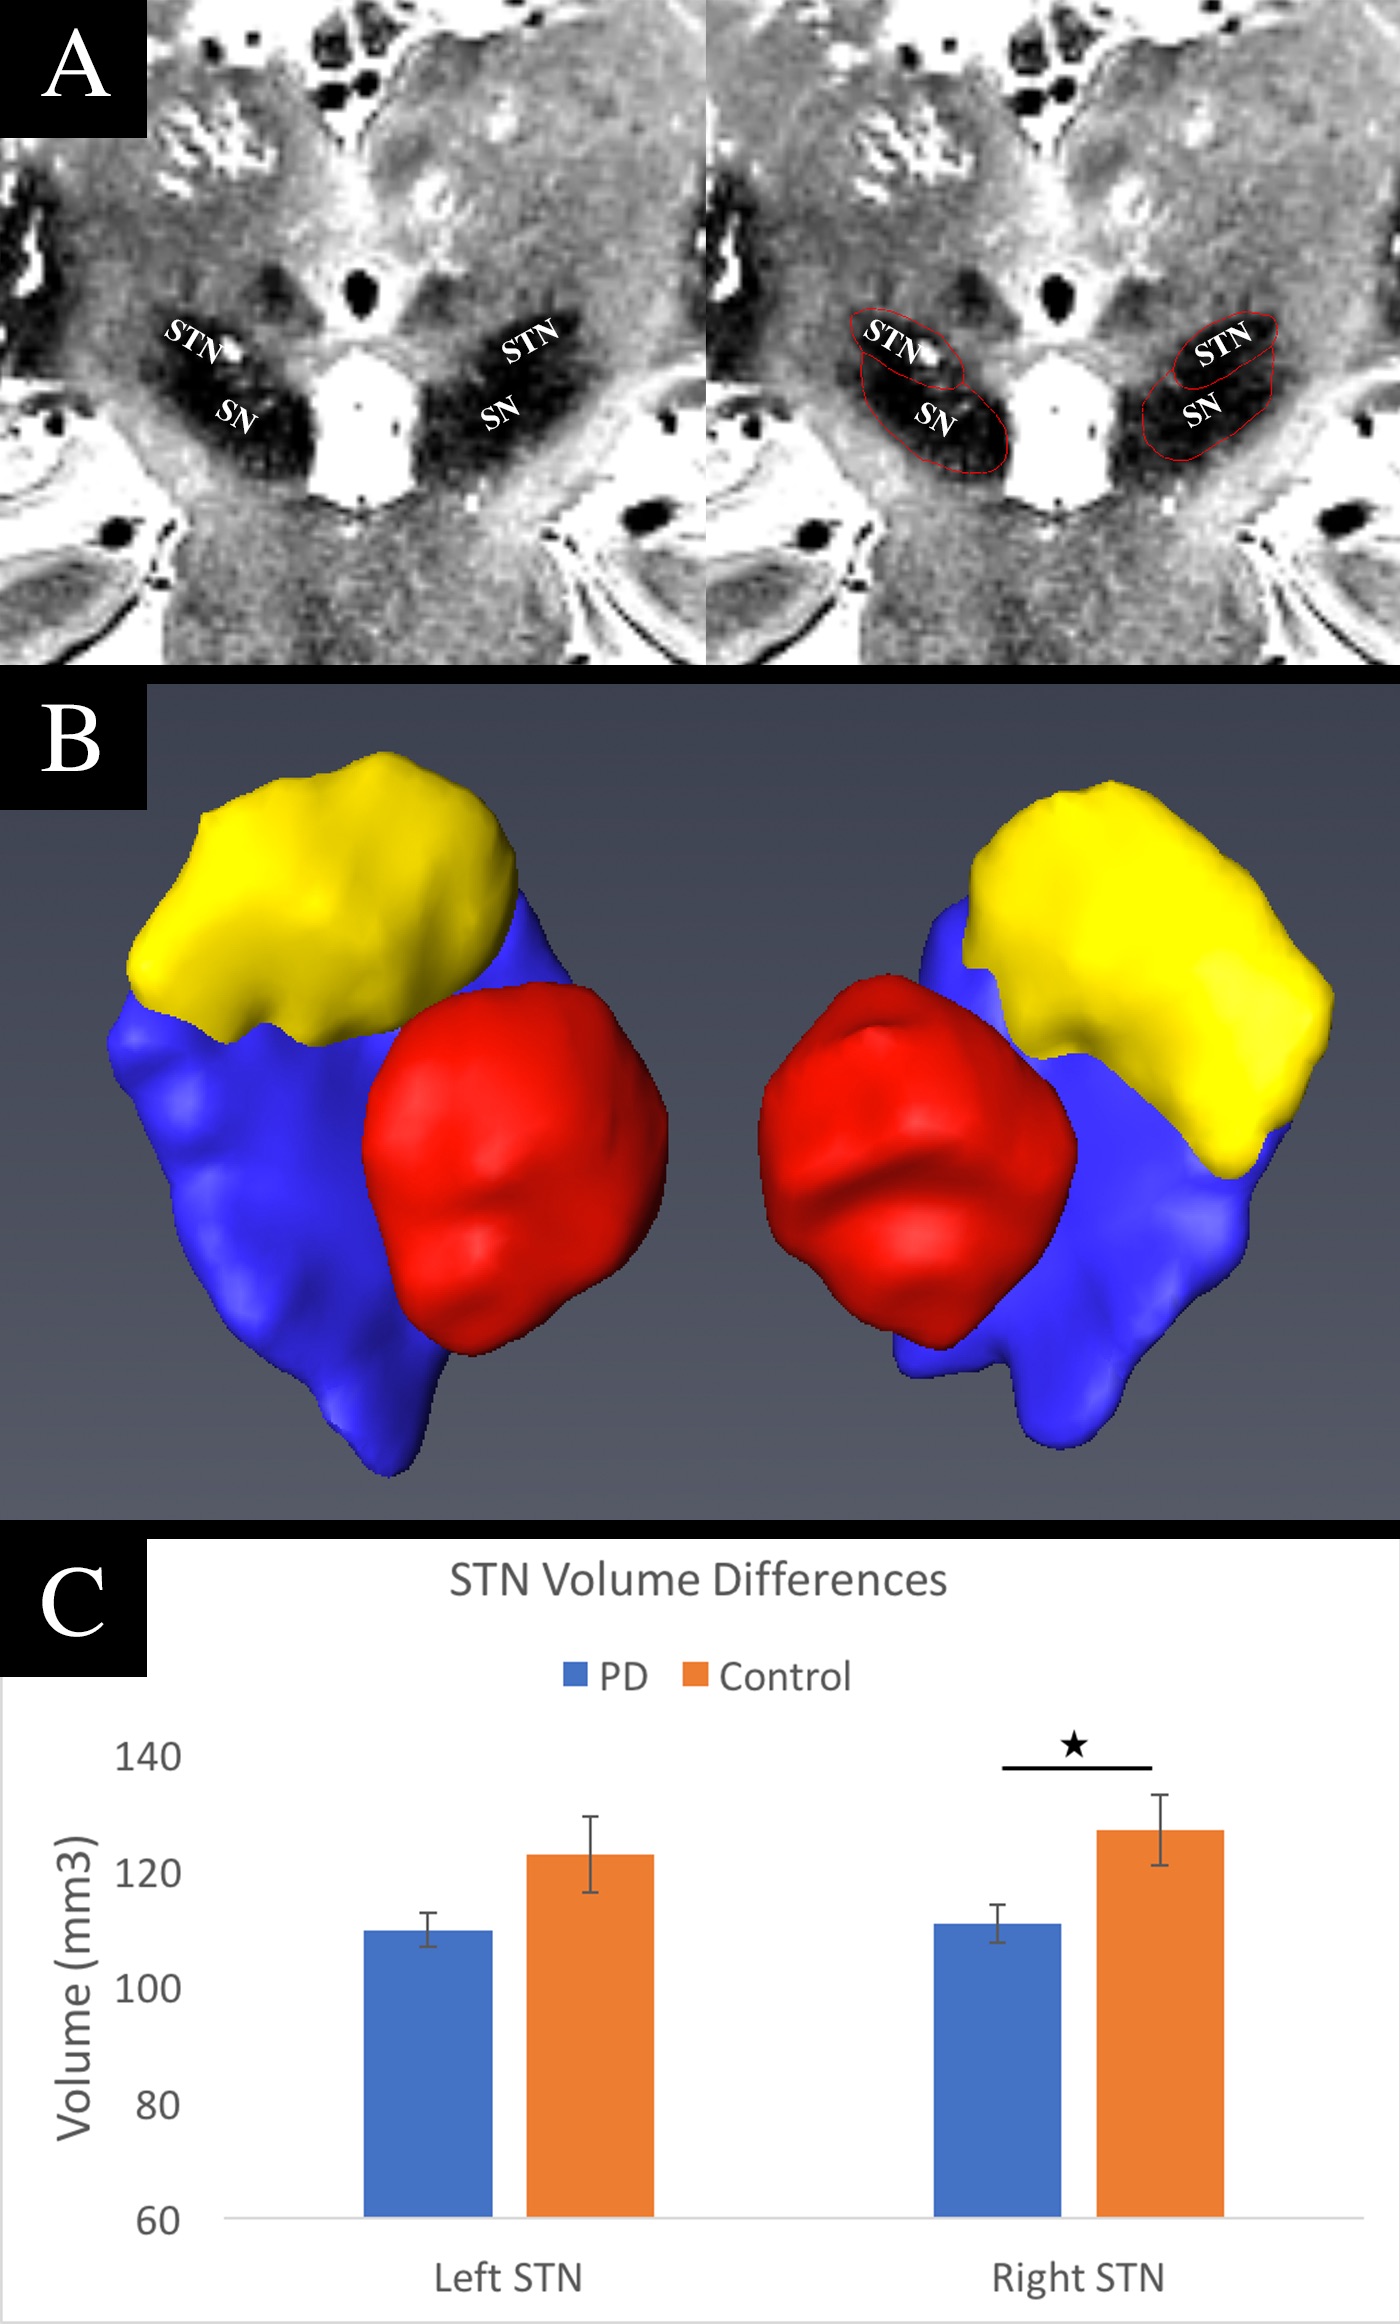
7T MRI data were acquired for twenty-nine subjects with early PD (age = 64±7yr, 13F, disease duration = 2.1 ± 2.0yr) and twenty-one healthy controls (age = 54±17yr, 7F). T2 images with 400mm in-plane resolution were used to manually segment the STN of each subject. Further, diffusion images with 1.25mm isotropic were corrected for distortion, motion, and eddy current effects. FA maps were computed from the corrected data. Finally, in native diffusion space, FA values were averaged over the left and right STN of each subject separately. The STN volumes and FA values were analyzed between groups and post-hoc analyses were preformed within the PD group.Results
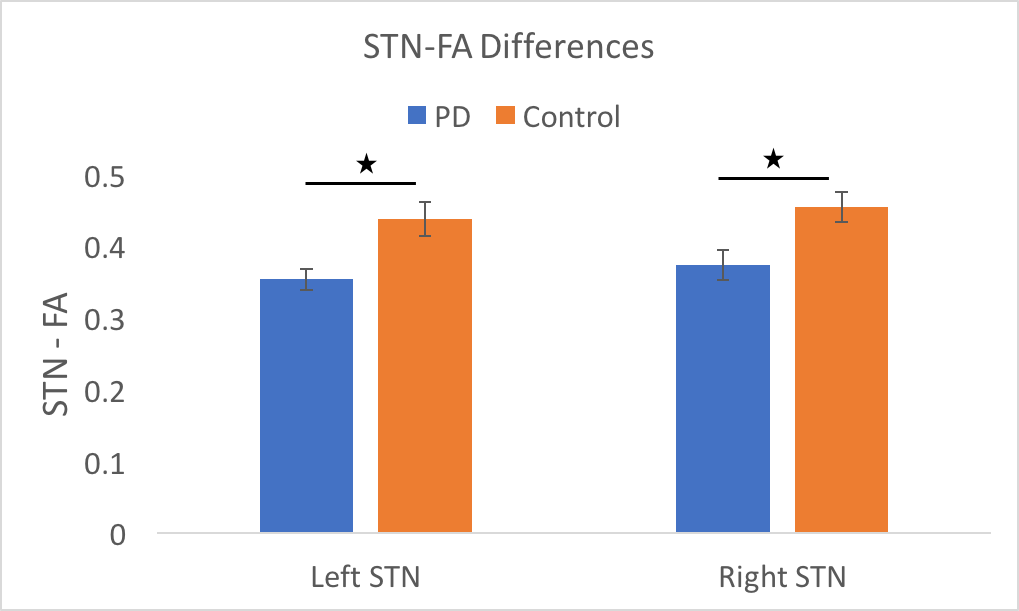
A Chi-squared test revealed no significant differences in terms of the number of male and female participants between the two groups (p = 0.60). A T-test found a significant difference in age between the two groups (p = 0.02); therefore, age was used as a co-variate in our analyses. Across all subjects, the STN volumes were 115 ± 24 mm3 for the left STN and 118 ± 23 mm3 for the right STN (p = 0.61) (Figure 1). The right STN volume was significantly smaller in PD patients compared to controls (p = 0.04). Post-hoc analysis revealed that, in PD patients, smaller right STN volumes were associated with higher the UPDRS motor scores (corr = -0.38, p = 0.04) (Figure 2). An ANOVA analysis, also controlling for STN volumes, showed that the PD group had decreased FA values in the left and right STN compared to controls (corrected p = 0.01 and p < 0.05 respectively) (Figure 3).Discussion & Conclusion
By leveraging the increased signal-to-noise ratio at 7T, we were able to accurately create a subject-specific 3D model of the STN for all the subjects involved in the study. The STN volumes were consistent with those reported in the literature9,11,13. The STN volume differences between the PD and control groups observed here are consistent with a previous report including patients with more advanced disease9. Furthermore, the right STN volumes correlated with UPDRS part III scores. In addition, we report the novel finding that the STN-FA was significantly reduced bilaterally compared with controls. Taken together, the volume and FA changes suggest that neurodegenerative changes in the structure of the STN can occur early in disease and the extent of the change impacts the expression of motor impairment. These results are also consistent with recent studies in animal models of parkinsonism showing that loss of nigrostrial dopaminergic neurons is associated with marked changes in the morphology and function of cortico-STN synapses15. Changes in the structure and afferent-efferent function of the STN are likely to impact the function of the indirect and hyperdirect pathways of the basal ganglia. The timing and extent of change in the STN may also impact the efficacy of deep brain stimulation in this region to treat the symptoms of PD.Acknowledgements
This project was funded by NIH RO1-NS088679, NIH UL1TR000114, NIH R01-NS085188; P41 EB015894; P30 NS076408, MNDrive Fellowship to MP, and the University of Minnesota Udall center P50NS098573References
1. Foundation Ps. Statistics - http://parkinson.org/Understanding-Parkinsons/Causes-and-Statistics/Statistics. http://parkinson.org/Understanding-Parkinsons/Causes-and-Statistics/Statistics.
2. Hirata FCC, Sato JR, Vieira G, et al. Substantia nigra fractional anisotropy is not a diagnostic biomarker of Parkinson's disease: A diagnostic performance study and meta-analysis. Eur Radiol. 2017;27(6):2640-2648.
3. Kwon DH, Kim JM, Oh SH, et al. Seven-Tesla magnetic resonance images of the substantia nigra in Parkinson disease. Annals of neurology. 2012;71(2):267-277.
4. Langley J, Huddleston DE, Merritt M, et al. Diffusion tensor imaging of the substantia nigra in Parkinson's disease revisited. Hum Brain Mapp. 2016;37(7):2547-2556.
5. Lenfeldt N, Larsson A, Nyberg L, Birgander R, Forsgren L. Fractional anisotropy in the substantia nigra in Parkinson's disease: a complex picture. European journal of neurology. 2015;22(10):1408-1414.
6. Minati L, Grisoli M, Carella F, De Simone T, Bruzzone MG, Savoiardo M. Imaging Degeneration of the Substantia Nigra in Parkinson Disease with Inversion-Recovery MR Imaging. Am J Neuroradiol. 2007;28(309-313).
7. Oikawa H, Sasaki M, Tamakawa Y, Ehara S, Tohyama K. The Substantia Nigra in Parkinson Disease: Proton Density–Weighted Spin-Echo and Fast Short Inversion Time Inversion-Recovery MR Findings. Am J Neuroradiol. 2002;23:1747-1756.
8. Peran P, Cherubini A, Assogna F, et al. Magnetic resonance imaging markers of Parkinson's disease nigrostriatal signature. Brain : a journal of neurology. 2010;133(11):3423-3433.
9. Coplan ME, Slavin KV. Subthalamic and red nucleus volumes in patients with Parkinson’s disease: Do they change with disease progression? Parkinsonism & related disorders. 2010;16(6):398-403.
10. Burciu RG, Ofori E, Archer DB, et al. Progression marker of Parkinson's disease: a 4-year multi-site imaging study. Brain : a journal of neurology. 2017;140(8):2183-2192.
11. Duchin Y, Shamir RR, Patriat R, et al. Patient-specific Anatomical Model for Deep Brain Stimulation based on 7 Tesla MRI. Journal of neurosurgery. submitted.
12. Abosch A, Yacoub E, Ugurbil K, Harel N. An assessment of current brain targets for deep brain stimulation surgery with susceptibility-weighted imaging at 7 tesla. Neurosurgery. 2010;67(6):1745-1756; discussion 1756.
13. Lenglet C, Abosch A, Yacoub E, De Martino F, Sapiro G, Harel N. Comprehensive in vivo mapping of the human basal ganglia and thalamic connectome in individuals using 7T MRI. PloS one. 2012;7(1):e29153.
14. Plantinga BR, Temel Y, Duchin Y, et al. Individualized parcellation of the subthalamic nucleus in patients with Parkinson's disease with 7T MRI. Neuroimage. 2016.
15. Chu HY, McIver EL, Kovaleski RF, Atherton JF, Bevan MD. Loss of Hyperdirect Pathway Cortico-Subthalamic Inputs Following Degeneration of Midbrain Dopamine Neurons. Neuron. 2017;95(6):1306-1318 e1305.
Figures