0424
Lateral-ventral tier nigral iron deposition and neuromelanin depletion in Parkinson's disease1Center for Advanced Neuroimaging, University of California Riverside, Riverside, CA, United States, 2Department of Neurology, Emory University, Atlanta, GA, United States, 3Department of Bioengineering, University of California Riverside, Riverside, CA, United States
Synopsis
The substantia nigra, a neuromelanin containing structure in the brainstem, contains a dense distribution of dopaminergic neurons which undergo degeneration in Parkinson’s disease. In this abstract, we examine spatial locations of neuromelanin depletion and iron deposition in the substantia nigra after onset of Parkinson’s disease. We found the lateral-ventral tier of substantia nigra to exhibit significant neuromelanin depletion whereas iron deposition was observed across the entire substantia nigra. These results accord with prior histological studies examining substantia nigra neuronal loss and may offer insight into the mechanisms behind this loss.
Introduction
It is well established that Parkinson’s disease (PD) causes degeneration of the substantia nigra (SN). SN, a paired midbrain structure, is comprised of substantia nigra pars reticulate (SNr) and the substantia nigra pars compacta (SNpc). SNpc contains a dense distribution of neuromelanin containing dopaminergic neurons and at the time of Parkinsonian symptom onset, up to 50% melaninzed neurons in SNpc have been lost [1]. Further evidence suggests that iron deposition is related to this neuronal loss and reduction of neuromelanin in SNpc [2]. However, there are conflicting studies as to the causal relationship between dopaminergic neuronal loss in the SN and iron deposition in SNpc with several studies suggesting that increased iron deposition in PD is not a primary event but a byproduct of neuronal loss [3-4] and other work suggesting that increased iron deposition causes neuronal cell death in the SN [5].
MRI offers a noninvasive way to examine these changes arising from PD. MRI techniques sensitive to iron have been used to measure iron deposition [6-8] or neuromelanin depletion [9,10] after onset of PD separately. Further, separate studies have found reduced neuromelanin content [11] or measures associated with increased iron content [12] in the lateral ventral tier of SNpc. However, no studies have concurrently examined iron deposition and neuronal loss in this region of SNpc. Here, we examine iron deposition, with R2*, and neuromelanin depletion, with neuromelanin sensitive MRI (NM-MRI), in SNpc concurrently and determine the spatial locations where these changes occur.
Methods
A cohort consisting of 59 subjects (31 early stage PD and 28 control) were scanned in this study. PD subjects met the UK Brain Bank criteria for PD diagnosis. All subjects gave written, informed consent and demographic data is summarized in Table 1.
Data were acquired on a 3 T MRI scanner (Prisma Fit, Siemens Medical Solutions, Malvern, PA) using a 64-channel receive only coil. Images from a MP-RAGE sequence (echo time (TE)/repetition time (TR)/inversion time=3.02/2600/800 ms, flip angle (FA)=8°, voxel size=0.8×0.8×0.8 mm3) were used for registration from subject space to common space. T2*-weighted data were collected with an eight echo 3D gradient recalled echo (GRE) sequence: TE1/TE/TR = 4.92/4.92/50 ms, FOV = 212 × 212 mm2, matrix size of 448×336×80, slice thickness=1mm, acceleration factor=2. NM-MRI images were acquired with a magnetization transfer prepared 2D GRE sequence with parameters identical to [13].
Data were processed in MATLAB and FSL. Magnetization transfer contrast (MTC) and R2* values were estimated using the following equations:
$$$MTC=\left(I-I_{ref}\right)/I_{ref}$$$ and $$$S(t)=S_{0}e^{-R_2TE}$$$
where $$$I$$$ denotes the intensity of a voxel in the NM-MRI image, $$$I_{ref}$$$ is the mean intensity of a reference region in the NM-MRI image, and $$$S_{0}$$$ denotes a fitting constant. R2* was calculated in MATLAB and MTC was calculated in FSL. R2* maps and MTC images were transformed from standard space to subject space using FSL and a MNI152 SNpc atlas, defined in healthy controls, was used to define SNpc.
Results
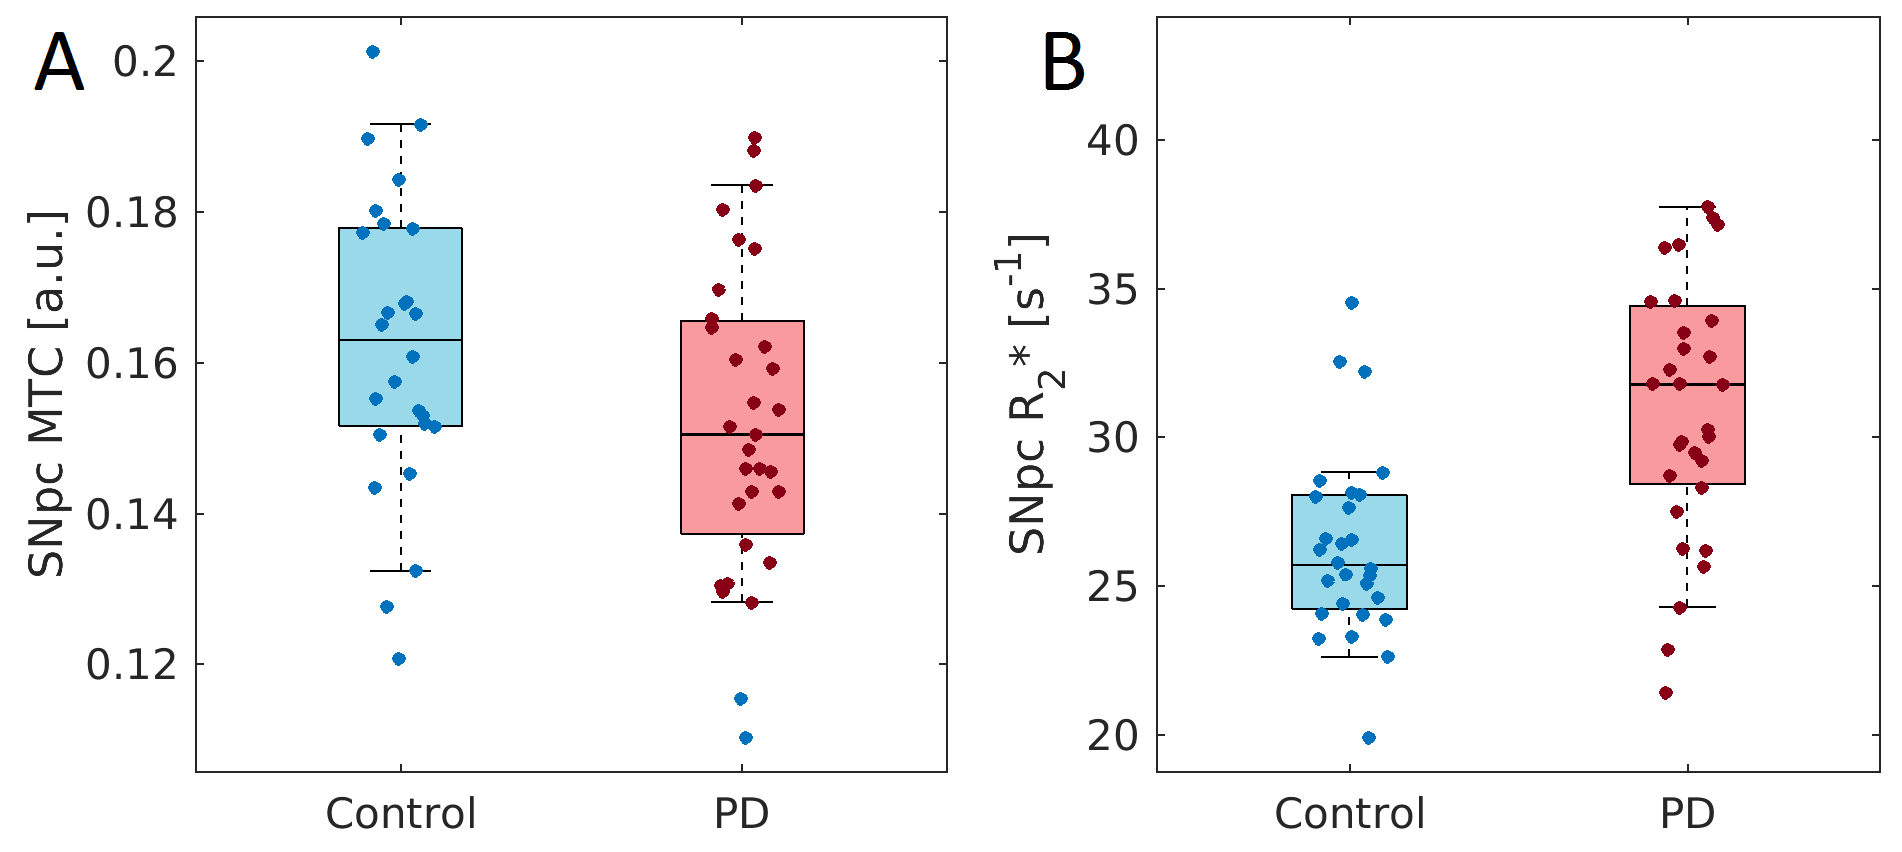
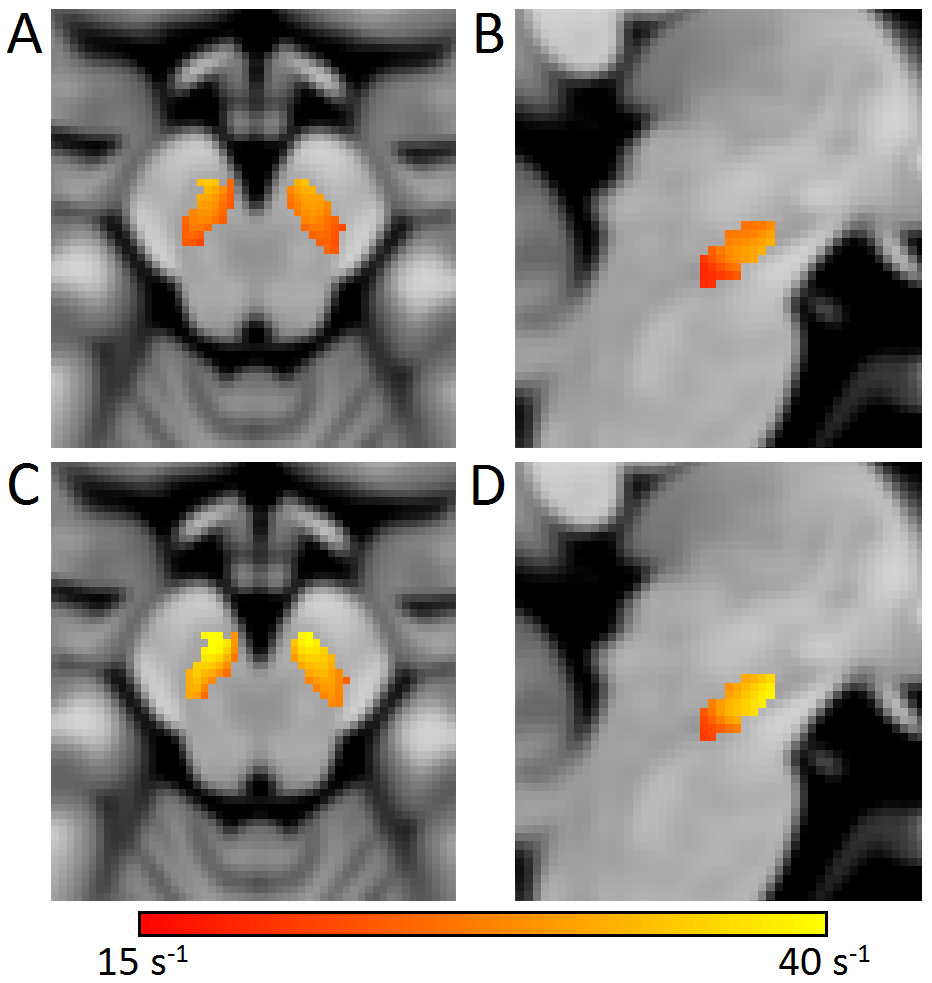
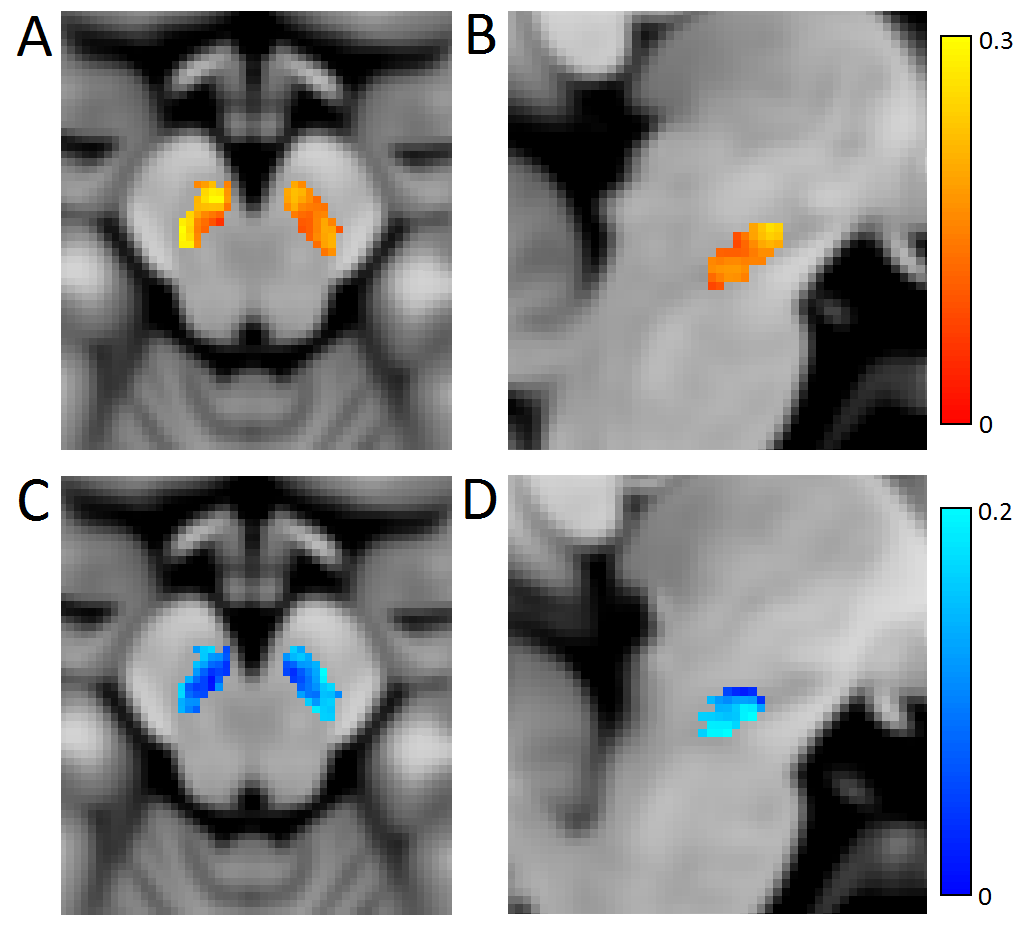
Mean SNpc R2* values, as defined by neuromelanin-sensitive MRI, were increased in the PD group (PD: 31.2 s-1±4.7 s-1; CO: 26.3 s-1±3.1 s-1; p<10-5). Mean SNpc MTC was decreased in the PD group as compared to controls (PD: 0.152±0.02; CO: 0.162±0.02; p=0.03). These results are summarized in Figure 1. No correlations for R2* or MTC were observed with disease duration or UPDRS-III score. Figures 2 and 3 show mean MTC maps and mean R2* maps for both cohorts in standard space. The change in R2* or MTC, as a percentage of the control value, is displayed in Figure 4. In Figures 2-4, it is seen that NM-loss is localized to the lateral and ventral areas of SNpc whereas iron deposition is found over most of SNpc.Discussion
In this abstract, we found increased R2*, consistent with increased iron deposition, and decreased MTC, consistent with neuromelanin depletion, in SNpc. Both results are in accordance with results from histology [1,2] as well as earlier studies examining the spatial location of SNpc neuromelanin depletion [11] or iron deposition [12]. In Figures 3 and 4, an iron deposition gradient is seen with lateral and ventral areas exhibiting higher R2* values and lower R2* values in medial and dorsal regions. However, the largest discrepancy in MTC occurs in the lateral and ventral areas with little to no neuromelanin depletion in the medial and dorsal regions (Figures 2 and 4). This may indicate that iron deposition is a precursor to SNpc neuronal loss. Future longitudinal studies following patients in the prodromal stages of PD into the early symptomatic stages may verify this observation.Acknowledgements
This work was supported by the Michael J. Fox Foundation [MJF 10854].
References
[1] Fearnley & Lees. Ageing and Parkinson’s disease: substantia nigra regional selectivity. Brain 114:2283-2301.
[2] Dexter, et al. Alteration in the levels of iron, ferritin and other trace metals in Parkinson’s disease and other neurodegenerative diseases affecting the basal ganglia. Brain 114:1953-1975.
[3] Uitti, et al. Regional metal concentrations in Parkinson's disease, other chronic neurological diseases, and control brains. Can J Neurol Sci 16:310-4.
[4] Becker, et al. Degeneration of substantia nigra in chronic Parkinson's disease visualized by transcranial color-coded real-time sonography. Neurology 45:182- 4.
[5] Galazka-Friedman, et al. Iron in parkinsonian and control substantia nigra--a Mossbauer spectroscopy study. Movement Disorders 11:8-16.
[6] Martin, et al. Midbrain iron content in early Parkinson disease: a potential biomarker of disease status. Neurology 70:1411-1417.
[7] Peran, et al. Magnetic resonance imaging markers of Parkinson’s disease nigrostriatal signature. Brain 133:3423-3433.
[8] Du, et al. Combined R2* and diffusion tensor imaging changes in the substantia nigra in Parkinson’s disease. Movement Disorders 26:1627-1632.
[9] Schwarz, et al. T1-Weighted MRI shows stage- dependent substantia nigra signal loss in Parkinson's disease. Movement Disorders. 26:1633–38.
[10] Sasaki, et al. Neuromelanin magnetic resonance imaging of locus ceruleus and substantia nigra in Parkinson's disease. Neuroreport. 17:1215-8.
[11] Huddleston, et al. In vivo detection of lateral-ventral tier nigral degeneration in Parkinson's disease. Human Brain Mapping. 38:2627-2634.
[12] Langley, et al. Parkinson's disease-related increase of T2*-weighted hypointensity in substantia nigra pars compacta. Movement Disorders. 32:441-449.
[13] Chen, et al. Simultaneous imaging of locus coeruleus and substantia nigra with a quantitative neuromelanin MRI approach. Magn Reson Imaging. 32:1301-6.
Figures